Isaiah 60:19
“No longer will you need the sun to shine by day, nor the moon to give its light by night, for the lord your God will be your everlasting light, and your God will be your glory.
I am grateful to God.
https://t.co/JvIefoax5o (First Class Hons.) in Ecotourism and Wildlife Management at the prestigious Federal University of Technology Akure officially bagged.
#futaclass21#grandeza
STOP this continuous procrastinating-attitude of yours before it halts your tech journey.🌚
Start by having an accountability partner.
Want one ? RT this, state what you’re learning & someone would connect with you.✌🏽
The map shows us the elevation of the catchment area and how the area is sloped to allow water flow into the direction of our outlet point.
#gismapping#spatialanalysis#dataanalytics#maps
Map 3:
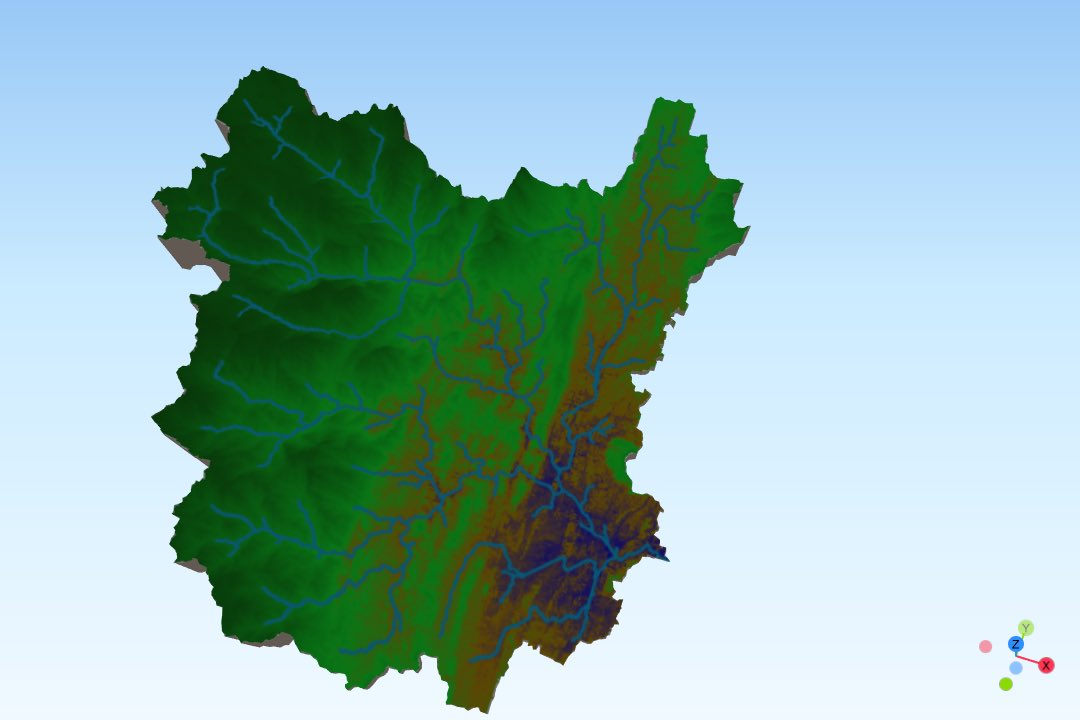
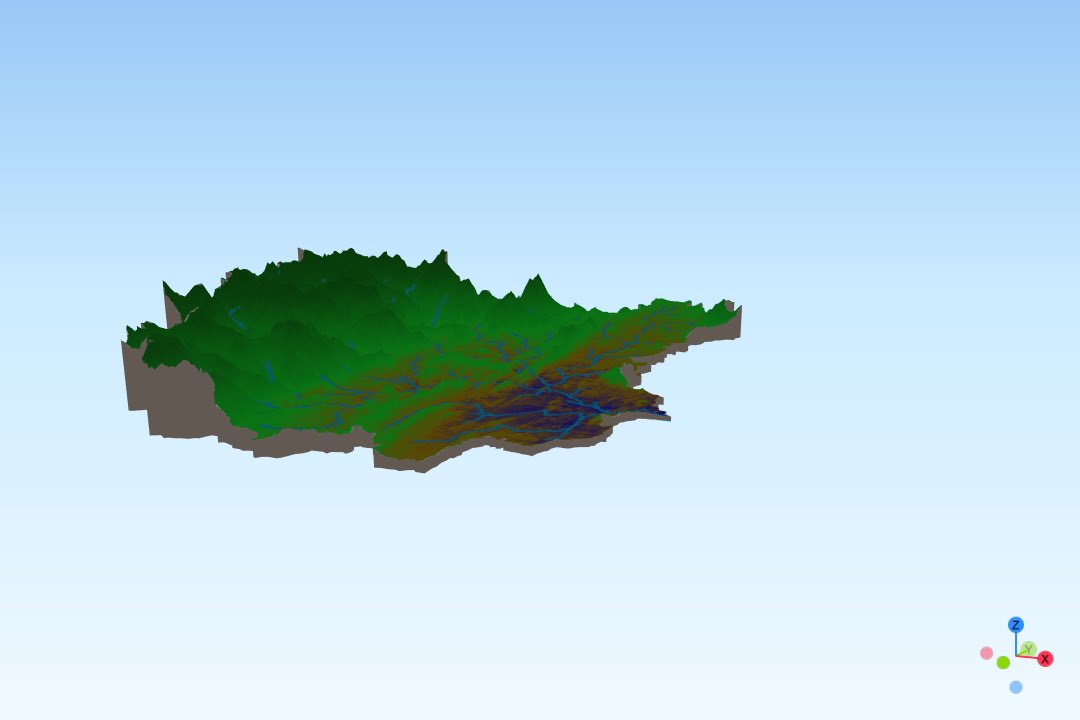
I created a 3D Model of the watershed area of Cameron Highland, Malaysia from the raster layer in my previous post. I converted the raster catchment boundary and river network to a vector data. Then, I clipped my DEM raster data by the extent of the catchment area.
I went further to create a 3D model of my map using the QGIS pluggin - QGIS2threejs, which interestingly allows us to export the 3D Model of our map that can be interacted with, to web as a .html document.
This map can help us locate the streams that are connected to the source stream (chemically poisoned) and implement the required conservation effort.
#spatialanalysis#qgis#dataanalysis#conservation
Map 2:
This time, I extracted a river network from a DEM raster data of Cameron Highland area in Malaysia, provided by Geodelta
The funtionalities of QGIS and GIS environments generally, are numerous, and I’m excited to be exploring them.
It was discovered that a factory that uses harmful chemicals to make electronic products somewhere within the catchment area have carelessly released their liquid waste into one of the rivers that contribute to the major outlet area.
I spatially analyzed the elevation of Bayswater area using a DEM raster data (secondary data) that was obtained from the tutorials of @Geodelta lab.
This map displays the height above the sea level, using contour lines to characterize areas with the same elevation.