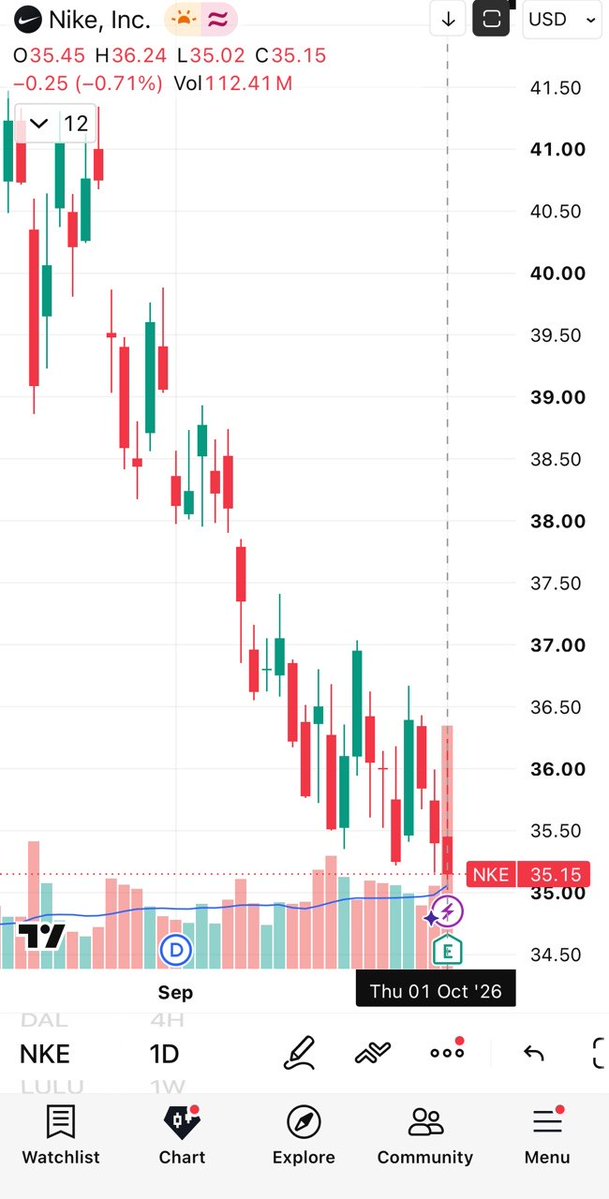
100M+ volume flushes in $NKE have only happened 20 times in 46 years. This is event #20 in $NKE’s 46-year history to cross 100M daily volume. Out of the previous 19 instances, post-flush price action followed a distinct 30–60 day statistical pattern. Published the detailed analysis and historical breakdown on my profile.
100M+ volume flushes in $NKE have only happened 20 times in 46 years. We haven't seen a cluster of >100M volume sessions like this since the 1980s, 5 events in the last 28 months after a 27-year drought.
I have shared a detailed analysis of the full 46-year dataset on my timeline for reference during future volume shocks.
Honestly, this feels like a low-effort retail narrative, completely beneath your usual analytical standards. Every $NKE thread is filled with this exact spam right now…
I travel internationally quite a bit and my real-world channel checks show a totally different reality. From metros and flights to cafes and hotel gyms,Nike is still everywhere, incl. various age groups.
I’ve seen plenty of turnarounds fail because management wastes time on fluff. Nike, however is making the right corporate governance moves, focusing on the core mechanics and structurally they are executing this turnaround correctly. They will reap the rewards of this. It is only a matter of time..
Classic retail trap: crying over a 0.8% revenue miss while completely ignoring a solid EPS beat ($0.48 vs $0.44).
Bottom-line defense proves management’s operational restructuring is actually gaining traction. Margin expansion comes 1st, top-line growth follows.
Retail gets distracted by headlines, completely missing the structural bottom-line defense..
A 46-year volume sweep on $NKE across 11,500+ sessions shows daily volume has crossed 100M shares only 20 times. Event #20 printed yesterday at 112.4M shares into earnings, followed by a -10%+ pre-market drop today.
Here is what historical data shows about post-event price behavior.
Regime Shifts & Event Frequency
The distribution of these 100M+ volume events is heavily clustered across history:
- 1980–1990: 13 events (averaging once every 9 months)
- 1997: 2 events in 2 months (April and May 1997), followed by a 27-year total drought with zero 100M+ sessions
- 2024–2026: 5 events in 28 months (accelerating to once every 5.5 months)
Out of 20 total sessions: 9 closed positive, 9 closed negative and 2 closed flat (including the 1980 IPO).
Top 3 Highest Volume Days in History
- May 29, 1997 (157.5M vol, -13.48%): Generated a +15.71% bounce over 45 days, then rolled over into a prolonged bear trend through September 1998.
- March 18, 1988 (155.5M vol, +1.97%): Pulled back -15.94% over 12 days before initiating a major multi-year bull trend.
- March 8, 1983 (136.5M vol, -2.34%): Rallied +36.80% to a peak on day 35, then entered a long downtrend bottoming in October 1984 before a long-term bull market started.
Historical Post-Event Price Distribution
Tracking every major volume flush reveals a consistent pattern: an initial 30–60 day relief bounce followed by the resumption of the primary trend.
- June 2024 (#16): 130.0M vol (-19.98% crash) -> +20.32% rally by day 62 -> primary downtrend resumed into April 2025.
- June 2025 (#17): 117.5M vol (+15.19% gap up) -> double top at day 20 and 40 (+11%) -> trend reversed back down.
- Dec 2025 (#18): 108.7M vol (-10.54% drop) -> dropped another -2.93% over 2 days -> +20.18% rally by day 39.
- April 2026 (#19): 114.2M vol (-15.51% drop) -> +6.76% bounce peaking at day 57 -> primary downtrend resumed to present.
Analytical Takeaway
Extreme capitulation volume gap-downs create highly quantifiable 30-to-60 day mean-reversion windows as selling pressure temporarily exhausts near major support levels. However, traders must distinguish between a tactical relief bounce and a structural trend reversal. Without broader operational stabilization, post-event rallies remain counter-trend setups within an ongoing primary macro trend.
In other words, unless Nike fixes its underlying business fundamentals, any rally after these volume spikes is just a temporary relief bounce inside a larger downtrend, not a permanent turnaround.
Bookmark this data for reference during future high-volume expansion events.
Data maps the probability, execution handles the risk. Every level is written down before I touch anything, where I buy more, where I am wrong, where I walk. I share structured setups and execution levels on my timeline for those who trade mechanics over noise.
$NKE closed today at 36.39. The 52-week high is 76.97.
Brand Finance still has the brand at 27.3 billion, 3rd in the world, down 7% on the cycle.
The share price halved. The brand did not. Earnings Thursday and I'm long into it.
Look up what $ENPH did after January 2017. I'm not typing the number here, it would read like a pitch.
$SPWR carries a going-concern warning in its own filings. It's my smallest position, sized strictly for zero.
A pattern isn't a thesis.
January 2017: T.J. Rodgers and John Doerr put $10 million into $ENPH. Rodgers joined the board.
September 2026: The same 2 names anchor a $26.2 million raise in $SPWR, at $0.30.
9 years apart. Same pair. Same playbook.
The number that matters isn't 649% or 694%.
It's 55, 32 and 56.
That's how many weeks of nothing came first. Roughly a year each time. The edge here isn't timing the turn, it's tolerating the year.
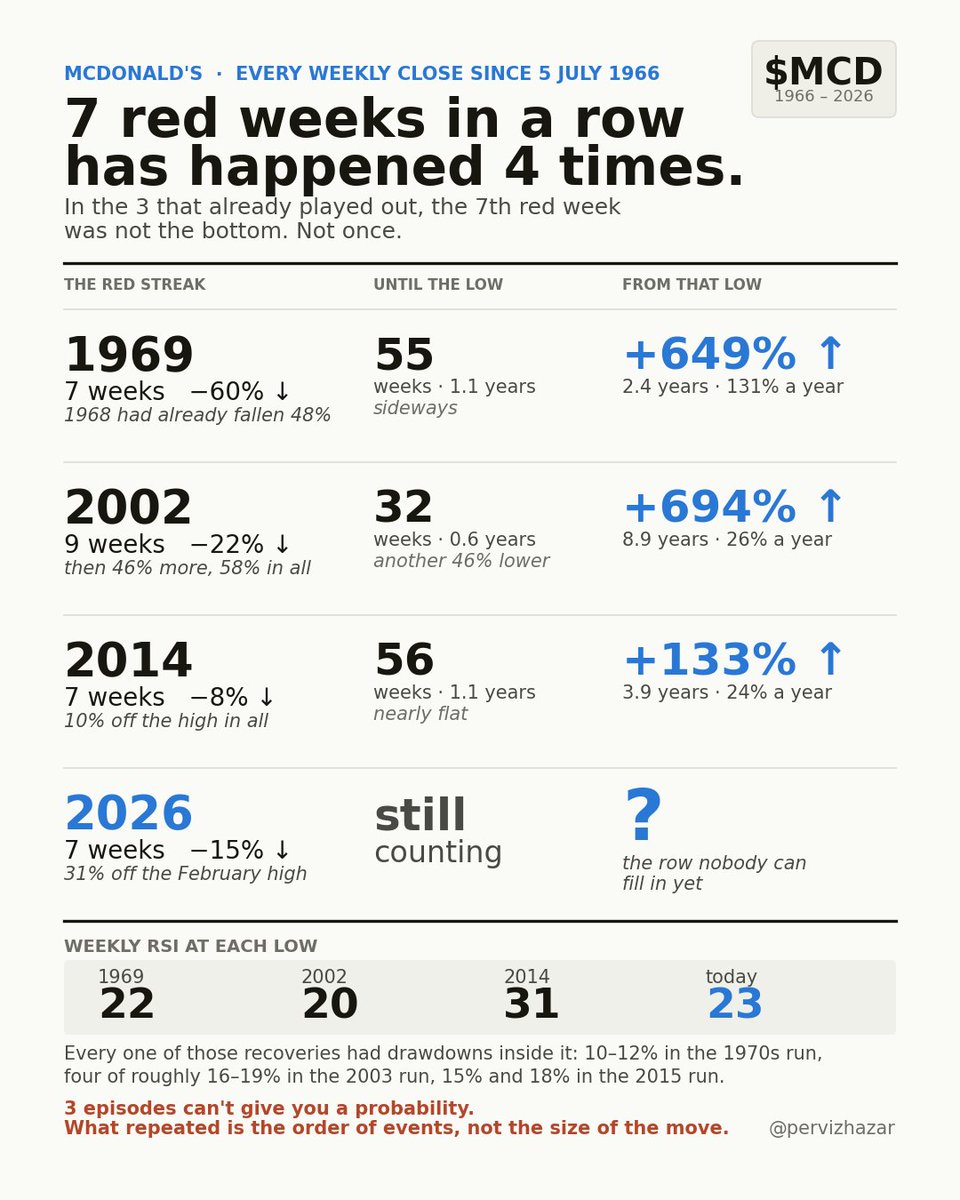
McDonald's has closed red 7 weeks running 4 times since 1966.
1969. 2002. 2014. And the one that ended last Friday.
In none of the first 3 did the stock turn the week the streak ended. Every time it went sideways for about a year first.
1969: 55 weeks of nothing. Then +649% over 2.4 years.
2002: 32 more weeks and another 46% down. Then +694% over 8.9 years.
2014: 56 flat weeks. Then +133% over 3.9 years.
Weekly RSI at those 3 lows: 22, 20, 31. Today it's 23.
2002 ran to 9 red weeks before it stopped. We're at 7. $MCD
@Barchart Retail sees "Extreme Fear" and market sells into deep support...
Institutions see "Liquidity" and start scaling into structural bids.
The best risk/reward setups of the year are born in this exact zone.
@Mr_Derivatives Still inside the +/- 8.8% expected move boundary..
Bottoms aren't caught in thin after-hours liquidity. They form when IV crushes and volume capitulation confirms seller exhaustion on the open. Let's see
@Mr_Derivatives Earnings flushed the price from 35.15 down to 32.79 (-6.7%), so the implied volatility +/- 8.8% is holding up efficient, for now, but overnight liquidity can still expand the range..
Watching the tape closely to see if this IV buffer holds into tomorrow's open.
Honestly, I’m so sick of this brain-dead retail narrative. Are people really sitting behind a screen all day pretending to be consumer behavior experts? Every single $NKE thread is flooded with this exact same lazy take..
I spend a huge amount of time traveling globally and my actual boots-on-the-ground channel checks tell a completely different story. From subway lines and airports to local cafes and hotel gyms,Nike is everywhere, across every single generation.
Most turnarounds collapse because management chases superficial noise. Nike is doing the complete opposite.They’re executing the playbook correctly and the payout is an absolute inevitability.
There is nothing inherently wrong with tighter Treasury-Fed coordination, it is often a natural macro alignment during fiscal-monetary transitions.
However, considering Trump is actively asking and pushing for aggressive rate cuts, his recent rhetoric demanding the removal of dissenting legacy members (Powell, Cook, Barr), regardless of one's view on their policy track record, leads me to believe this is a direct output of the Warsh-Bessent dialogue rather than mere political noise.
It represents a calculated effort to centralize the Fed’s reaction function and eliminate internal friction before any policy shift..
You don't restructure the Board for standard rate cycles or a prolonged hold. You clear the dissenters when the White House explicitly demands a frictionless path for liquidity and you need absolute alignment to execute it.
If Warsh and Bessent are consolidating power to deliver this politically mandated dovish baseline, the fixed income market is stubbornly asleep. The long end of the curve is severely exposed, mispricing both structural inflation and term premium risks. Ultimately, this trajectory means we could see long-term yields blowing out to levels far beyond what the market currently considers alarming.
For the sake of broader market stability, let’s hope we don't have to actually test those extremes…
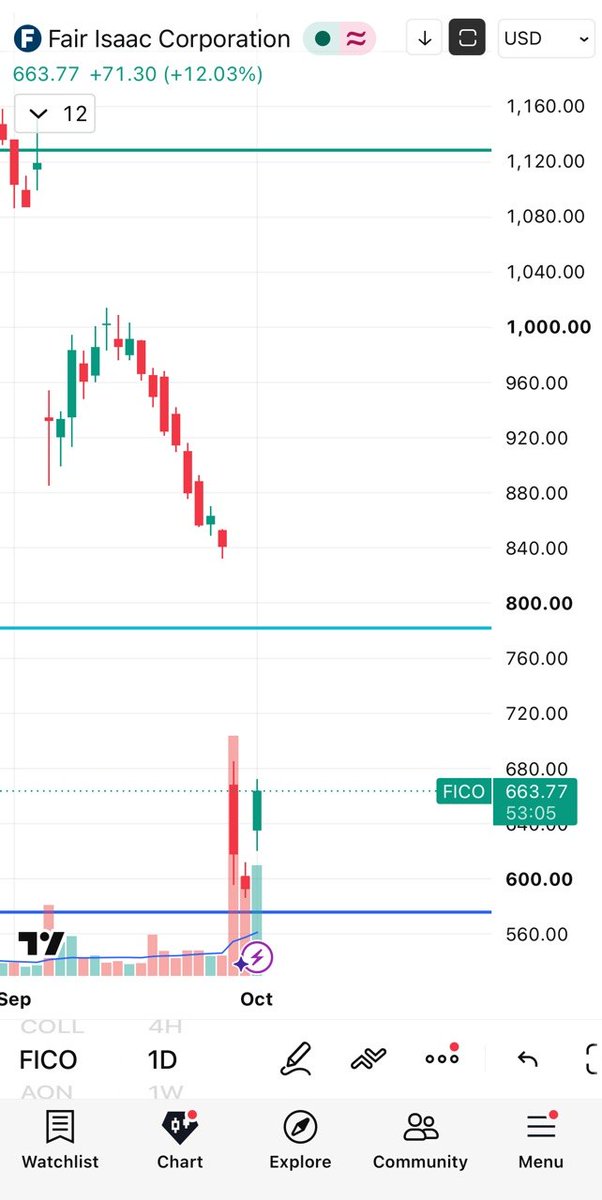
I mapped the post-crash behavior for all 18 historic >4M volume days in $FICO history since 1987..
With the stock ripping +12% today off deep support, this quantitative study holds serious alpha.
Here is what 39 years of extreme volume capitulation actually tell us:
1. The >15% Crash Rule &Recovery Velocity:
Before Sept 29, 2026, $FICO only suffered a >15% volume crash 3 times in 39 years (2002, 2004, 2008).
When a bounce happens, it’s violent.
- July 2004 (-23.5%): Bounced +4.46% on Day 1 and kicked off a multi-year structural bull run.
- Jan 2002 (-23%): Fully recovered the drop by Day 13 and entered a macro uptrend.
- Aug 2008 (-19%): Delivered an immediate +12.60% relief rally over the next 9 days.
2. Downside Asymmetry:
Across all historic crash days, additional downside over the next 7 trading days was capped at just -1% to -2.5% before buyers stepped in. The crash day itself absorbs almost all the panic.
3. Structural Regime Shift &Clustering:
These events cluster in high-volatility regimes driven by earnings and macro shocks. Between 2002-2008, we averaged one extreme-volume event roughly every 5 months. That was followed by a 15-year quiet era (2008-2023).
That silence is now broken. We are officially back in a high-volatility regime..
4. Market structure:
Not all extreme green days are tops, but the most devastating multi-year drawdowns in FICO’s history (like 2004 and 2007) were triggered right after extreme-volume green days (late buyers trapped). Conversely, heavy red volume marks seller exhaustion into support.
On September 29, 2026, $FICO suffered its worst crash in 39 years (-26.52%), landing directly on the 0.886 Fib. Today's +12% violent bounce confirms the mechanics.
With the next earnings window set for November 2026, risk managers should be on high alert. The regime has shifted.
Bookmark this study for the next time $FICO panics. (And yes, looking at today's candle, I really wish I hadn't locked in my long so early in pre-market! Honestly, looking at all this data now, I just wish I had completed this study a lot sooner!)
Consumer confidence is a sentiment indicator, not a measure of structural economic destruction.. Historically, confidence hitting decade-lows often operates as a contrarian lagging indicator,not a macroeconomic death sentence. The Great Recession took years because massive systemic debt had to unwind.