For the next 30 days, I'll be working with Excel to develop and demonstrate my data analysis skills through practical exercises, using a single dataset.
The goal is to understand how to approach dataset, identify problems, clean information, analyse data
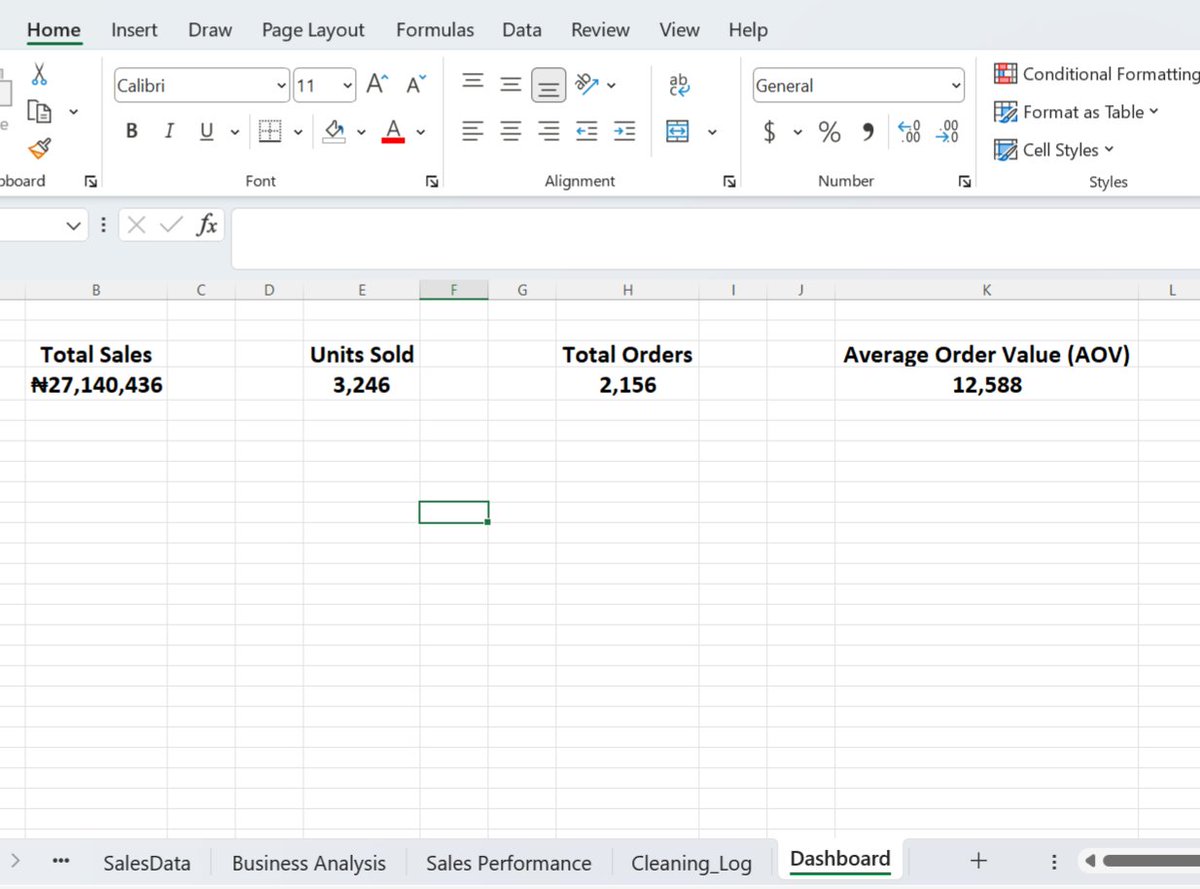
I created a new worksheet named Dashboard and used Excel formulas to calculate these metrics from the cleaned dataset.
My key takeaway is, a good dashboard starts with the right questions and the right metrics.
I chose these metrics because they provide different but complementary perspectives on the business's sales performance. Together, they provide a broader picture of the business's overall sales performance than revenue alone.
useful overview of sales performance in the Bloom Mart Retail Sales dataset.
I selected four key metrics for my dashboard:
Total Revenue: ₦27,140,436
Units Sold: 3,246
Transaction Count: 2,156
Average Transaction Value: ₦12,588
Day 22: Dashboard Planning
Before building a dashboard, one important question needs to be answered: What information should the dashboard communicate?
Today, I focused on Dashboard Planning, identifying the Key Performance Indicators (KPIs) that would provide a
Day 21: Interactive Analysis
What if you could explore sales performance across different regions without manually changing your PivotTables every time?
Today, I focused on Interactive Analysis, practising PivotTable filters, Slicers and Timelines in Microsoft Excel.
For example, you can explore Lagos's sales performance month by month, comparing January, February and other months without having to manually adjust the PivotTables.
Data analysis is not just about presenting figures, it's also about making those figures easier to explore.
I created Slicers and Timelines to make it easier to filter and explore sales performance by region.
These tools allow users to interact with the analysis, select specific regions and examine how sales performance changes over time based on their selections.
@Femiforge Hi, I'm Saheed and I'm currently building my data analytics portfolio
I need someone to mentor me on data analytics, I'd be glad if I get this opportunity from you
removing unnecessary decimal places, formatting revenue figures in Nigerian Naira (₦), and arranging categories to make comparisons easier. Choosing the right chart matters. Bar and column charts are useful for comparing categories, while line charts help reveal trends over time
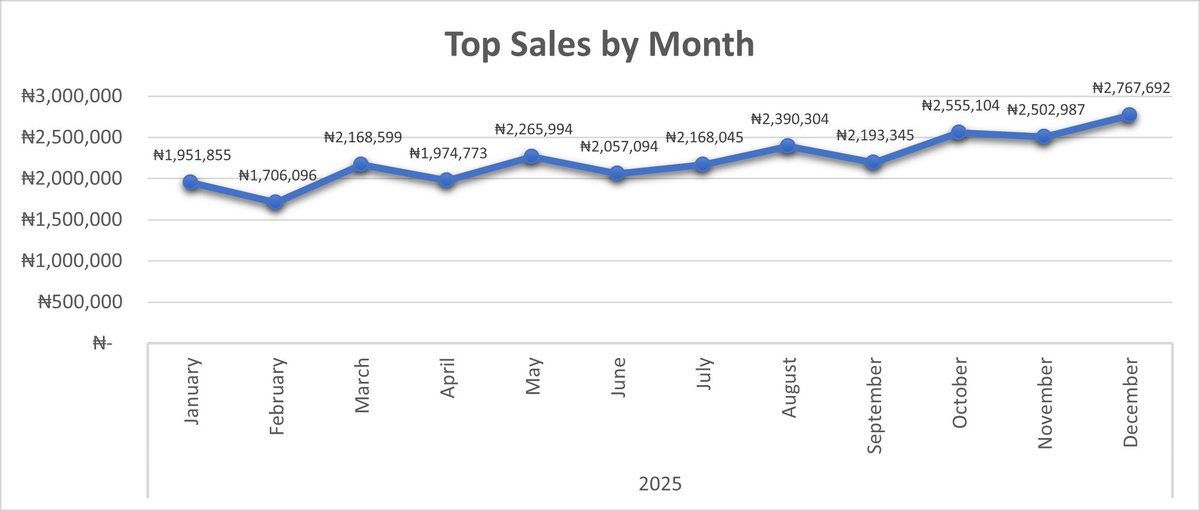
Revenue grew over the year, from ₦1,951,855 in January to ₦2,767,692 in December, an increase of 41.8%. February was the weakest month (₦1,706,096).
I also worked on formatting the charts, including adding meaningful titles, adjusting data labels,
then there's a sharp drop, Wuse earns almost twice as much as Ring Road. This could be location, store size or stock availability.
Finally, I used Line Chart to visualise changes in monthly revenue and identify patterns across the year.
The drop from one product to the next is gradual, which suggests a fairly balanced portfolio.
I used Column chart to compare revenue across stores and identify the strongest and weakest performers. Wuse, Surulere, Ikeja, Garki and Lekki each earn between ₦3.3M and ₦3.9M,
Using the PivotTables I created in previous exercises, I developed three charts:
I used Bar Chart to compare revenue generated by different products and identify the top-performing products. Blender 1.5L leads at ₦2,668,046, followed by Cutlery Set and Ankara Fabric.