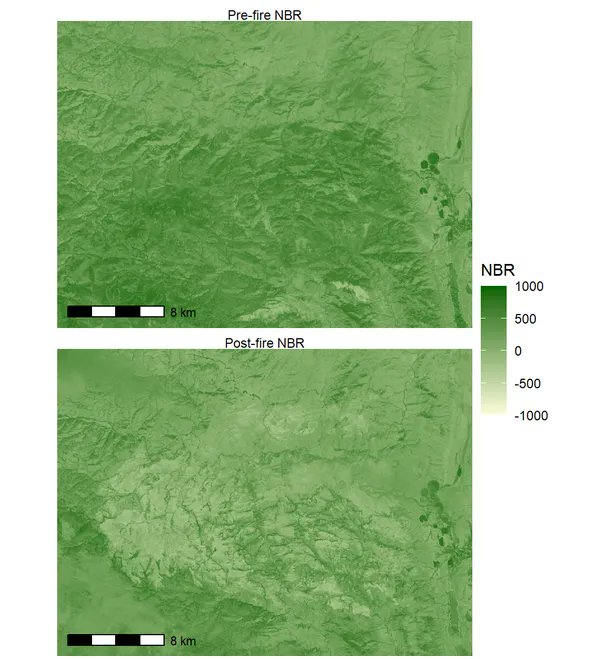
"Geographic Data Science with R: Visualizing and Analyzing Environmental Change"
An #open-source book by Michael C. Wimberly.
You can read it at https://t.co/89AhmymKup.
#rstats#rspatial#geochat
There are hundreds of software tools available for research right now.
But in reality most of them are not worth your time.
Here are 8 tools that I've actually use, that can super-charge your research productivity.
A thread🧵
👇Using the {lidR} package to both create a DEM as well as extract tree canopies, and then plotting the data (using the new `render_tree()` function) in 3D with #rayshader + #rayrender: the reason #RStats is so awesome is you have tools to do everything!
Introduction to Mixed-Effect Modelling! Join us Wed 20th April 3-5pm UK Time on Zoom as we delve into linear mixed-effect modelling in #RStats, a fundamental skill for beginner and experienced coders alike! Details and joining info below 🔽🔽
If you are building an #opensource single tree #forest 🌲 simulator, you should check this out https://t.co/ZceIOsxQfI We have just published our forest similator framework #SiTree, open-source and fully written in #R! The software is available at https://t.co/bU72hI6Bld
During data wrangling stage, sometimes we may need to rotate the dataframe (such that rows become columns and vice versa).
The {rotate_df} function from {sjmisc} 📦 provides just the tool! 🔧
https://t.co/fB1vqf4uqu
#rstats#DataScience
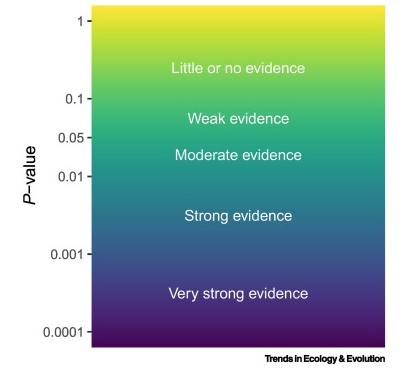
Lots of discussions about Fig. 1 in @StefanieMuff et al., "Rewriting results sections in the language of evidence", recently published by @Trends_Ecol_Evo, https://t.co/mdPa7T0k1m
The figure suggests a direct correspondence between p-values and the evidence for !H0 (1/4)
This is a great map by @artlebedev studio. All the countries scaled and shaped correctly. I thought of doing this but wouldn't have done it this well! #dataviz
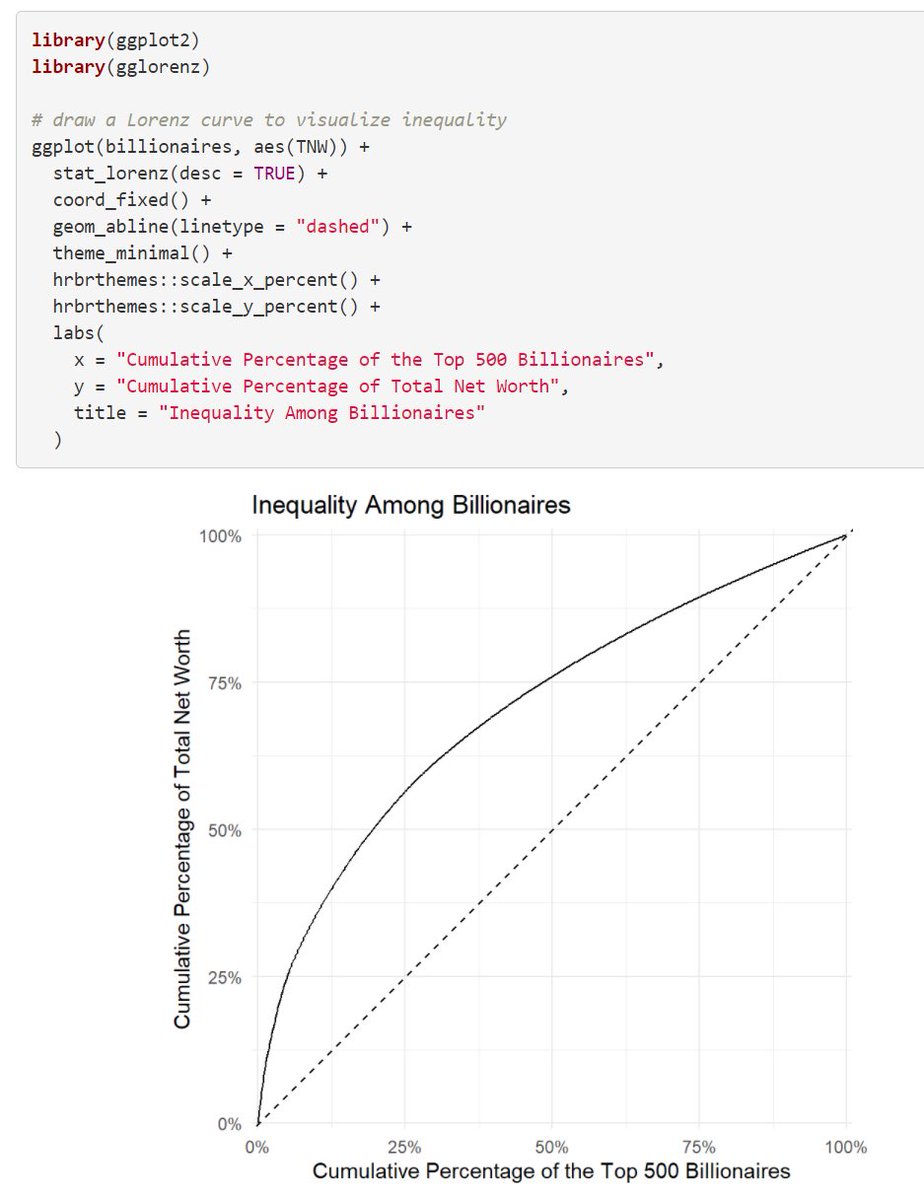
Lorenz curves provide a good way to visualize inequality in the distribution of a variable (like wealth).
The {stat_lorenz} function from {gglorenz} 📦provides the needed geometric layer to create such a curve easily 🙌
https://t.co/AJpWz8rHCr
#rstats#DataScience