FUN FACT: $TLT has been in a bear market for 5.5 years, but the bottom could be in... 👀
Here are some reasons why:
1. Price hasn't retested the blue line since January 2022.
2. Longer-term bullish divergence.
3. Price may have put in a macro higher low.
4. Daily chart is bullish.
5. Weekly chart is bullish.
6. 2-week chart has a pending buy signal.
7. 3-week and monthly charts are peaking above dots.
Caution: Price is still below the blue line in a downward trend.
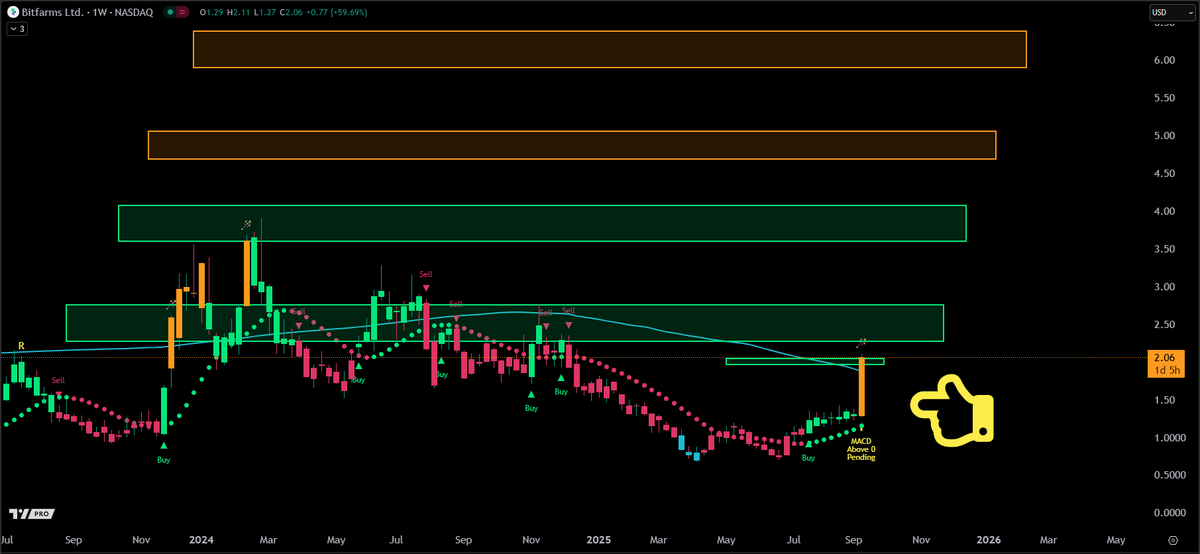
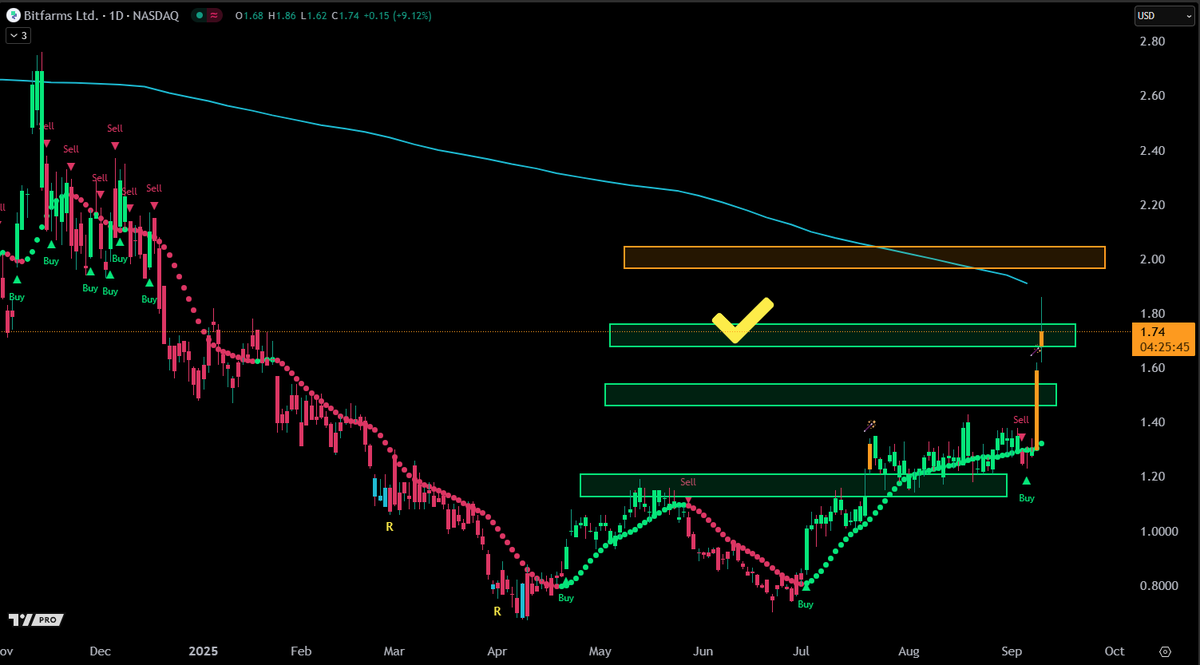
BREAKING: Someone just lit #Bitcoin mining stock $BITF's weekly candle on 🔥
All four shorter-term targets have been hit and the longer-term targets are still valid imo.
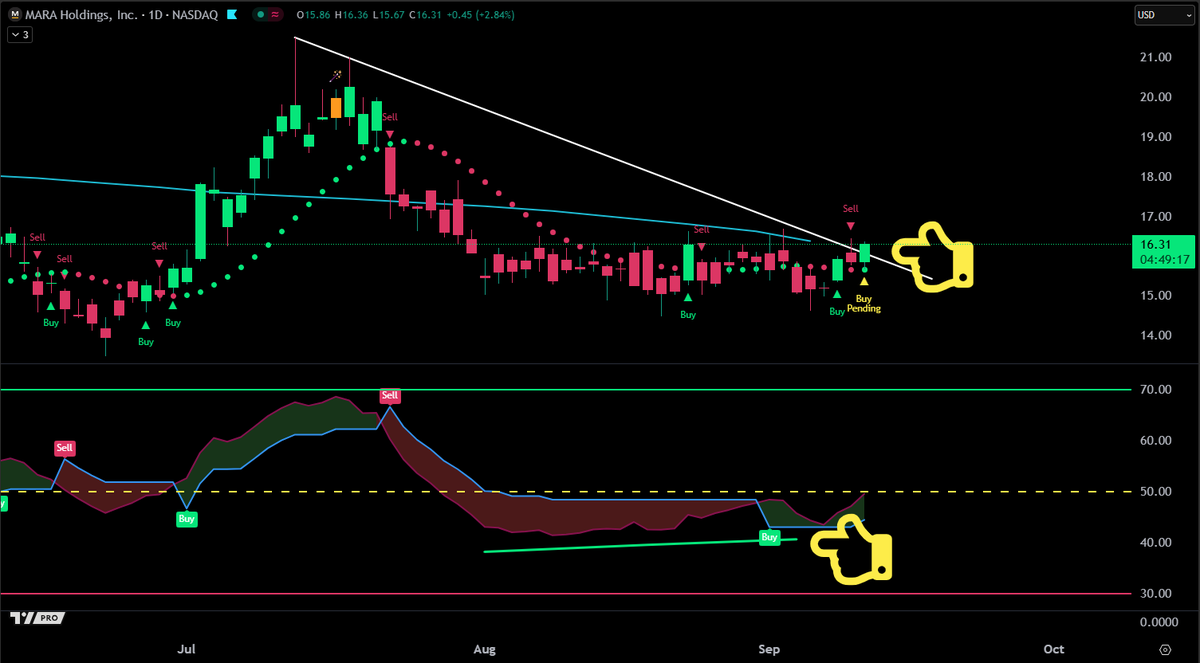
Pending buy signal on #Bitcoin mining stock $MARA:
• -33% correction lasting 57 days
• Indicator picked up bullish divergence
• RSI buy signal
• Candle closes above trending dots
• Today could see a candle close above trend line
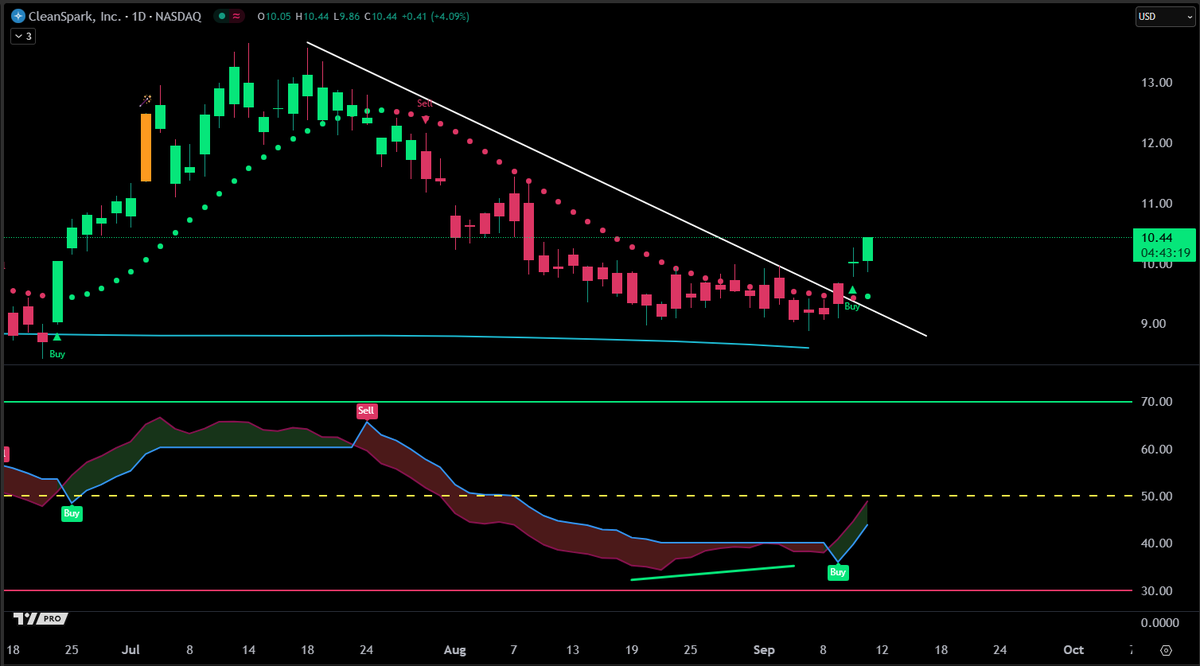
Is $MARA & $CLSK lagging timewise? 🤞
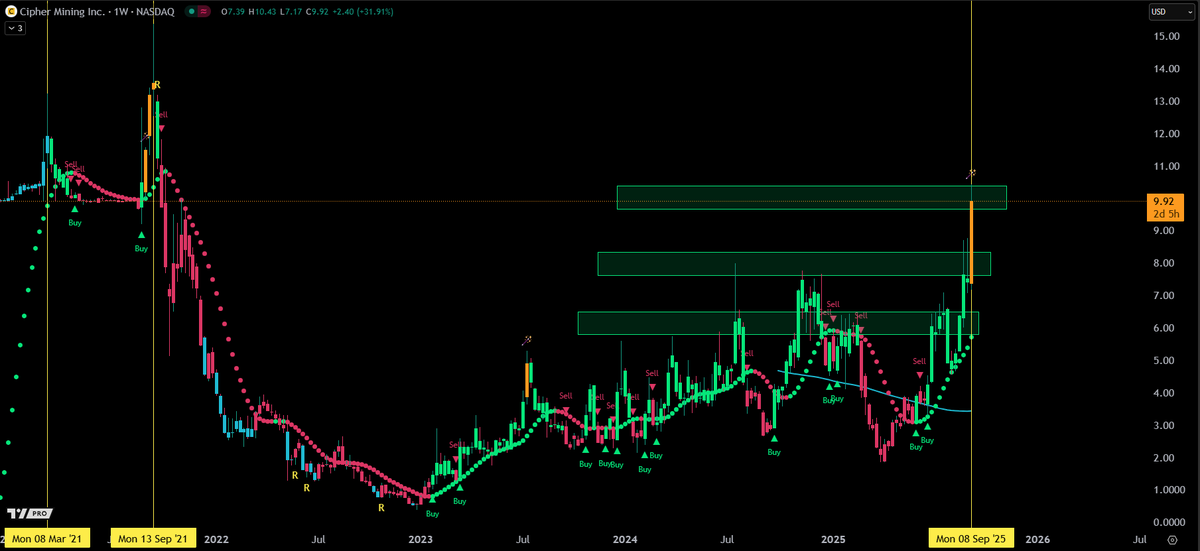
JUST IN: #Bitcoin mining stock $CIFR has hit four out of four longer-term targets laid out years ago, lol.
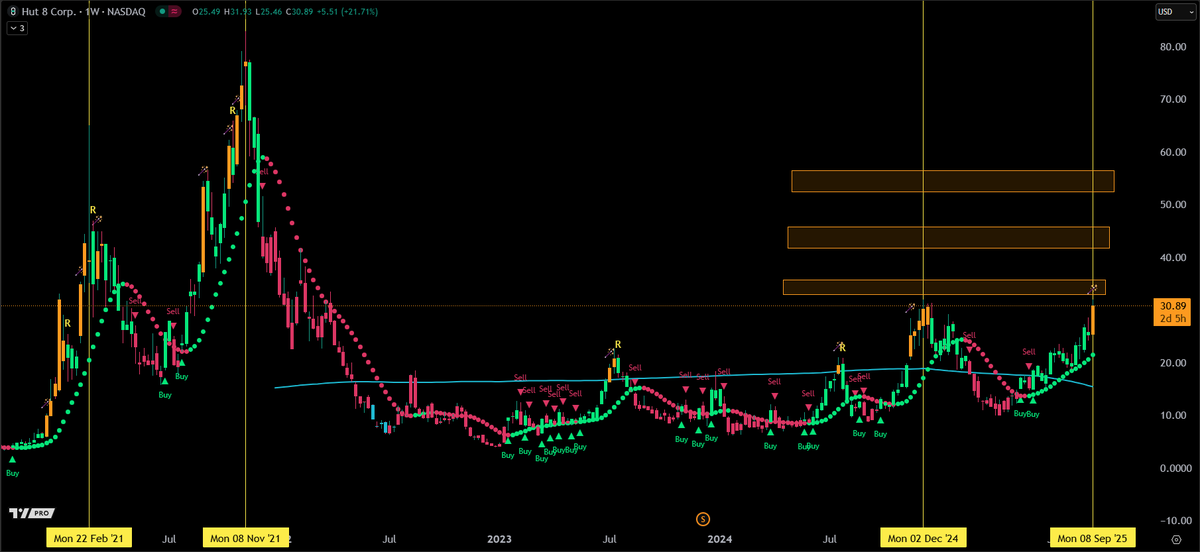
As mentioned before, miners typically pump the hardest towards the end of the cycle.
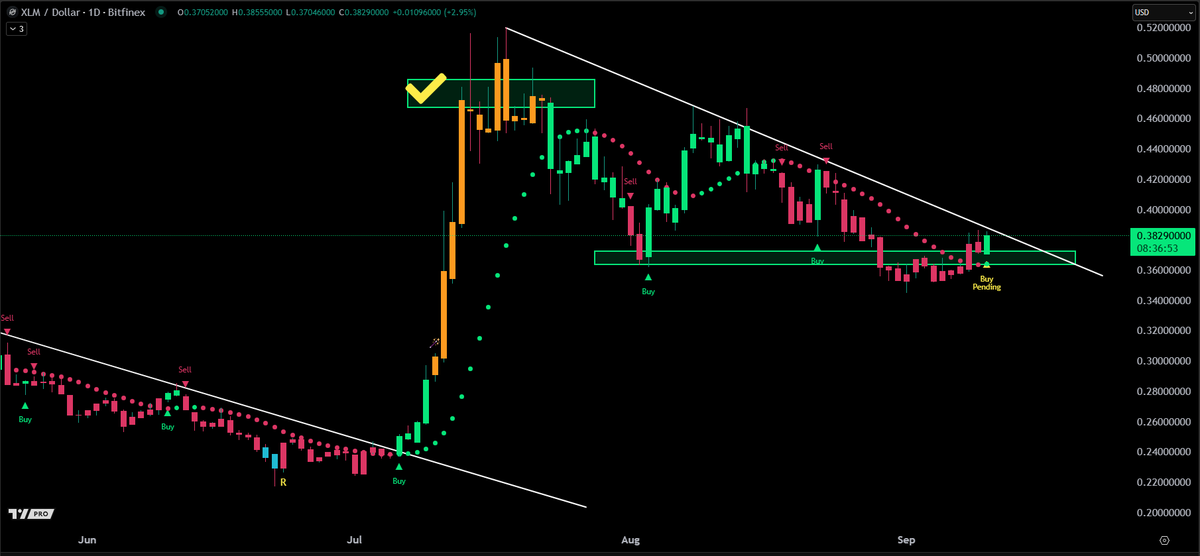
Quick $XRP recap:
• -26% correction lasting 51 days & hit 3 of 4 targets ✅
• Candle close above trending dots ✅
• Buy signal ✅
• RSI buy signal ✅
• Candle close above trend line ✅
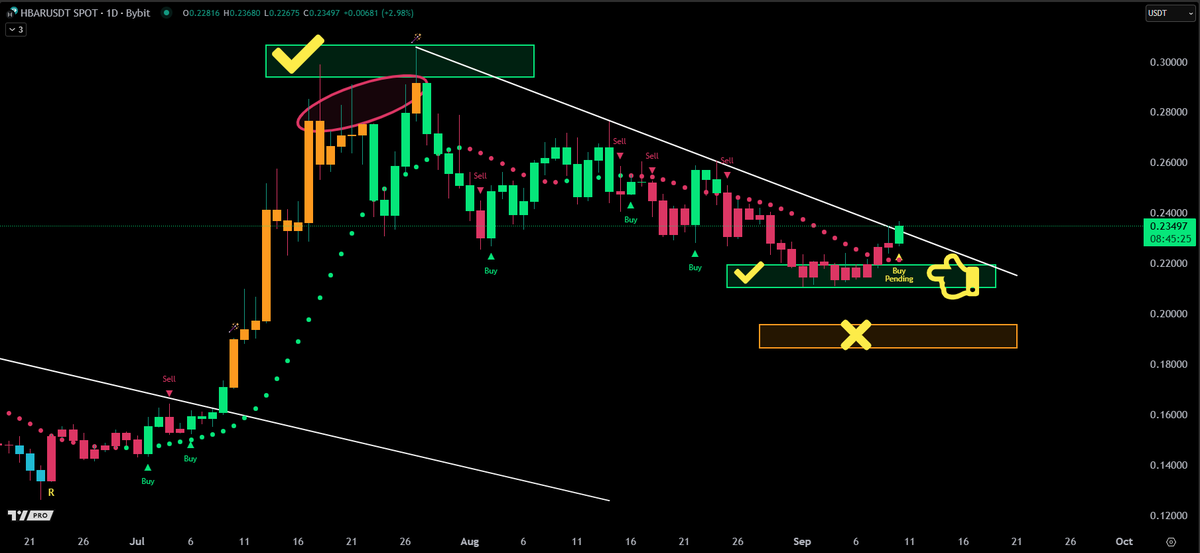
Pending buy signal on $HBAR's daily chart.
Quick recap:
• Price hit all four targets to the upside ✅
• Bearish divergence cleared ✅
• Price hit three out of four targets to the downside ✅
• Candle closes above trending dots ✅
• Pending RSI buy signal
• Pending MACD bullish crossover
• Pending candle close above trend line
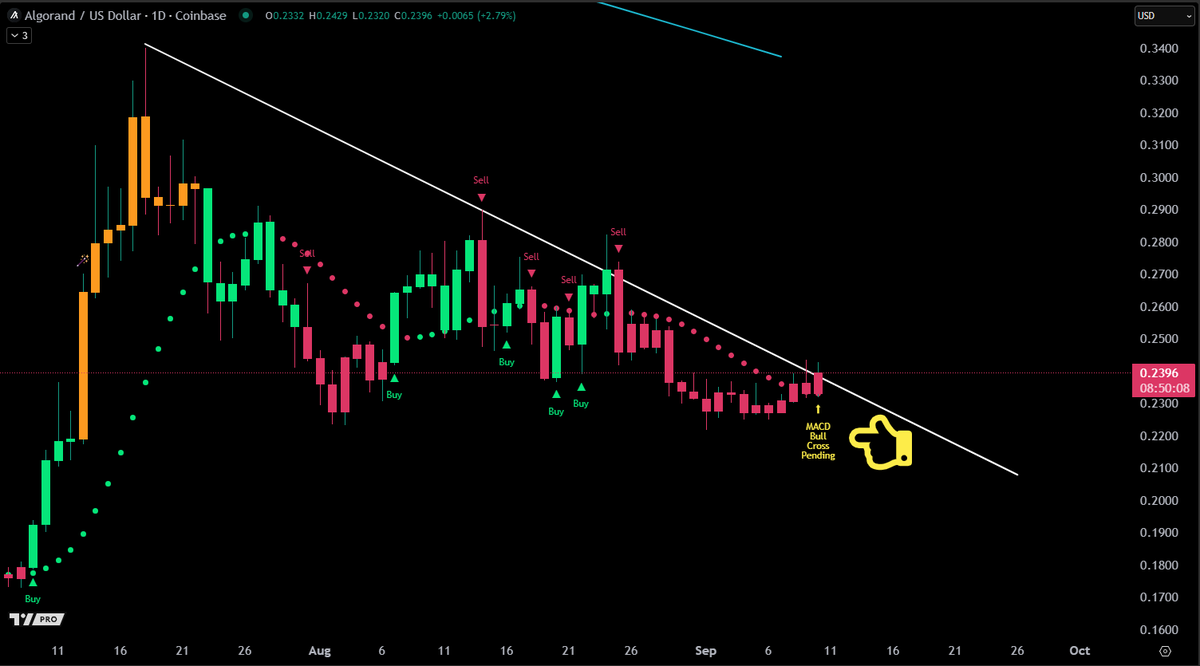
Pending MACD bullish crossover on $ALGO's daily chart.
Quick notes:
• -35% correction lasting 53 days so far
• Candle close above trending dots
• Could see a candle close above trend line
• Could see an RSI buy signal soon
• Could see a buy signal soon