This Bitcoin bull run is going to be ugly in the best way for everyone who is bearish.
Between 2028 and 2029 we’re looking at a move that melts faces, and $230k to $340k stops being a fantasy and just becomes the new targets people have to live with.
We’ve seen this movie before.
The biggest runs always show up after most people have already given up and convinced themselves it’s over.
Right now the setup is lining up again, liquidity is turning, institutions are actually in it instead of just talking about it, and the pain phase that always comes before the real explosion is basically done.
Anyone who stayed positioned through the chop is about to get paid in a way that rewrites portfolios. Everyone else is going to watch the price do things that currently sound ridiculous. $230,000 to $340,000 isn’t some random number I pulled out of nowhere, it’s where this cycle is pointed once the real money starts chasing.
The bull run is coming, it’s going to be violent.
If you have a plan, stick to it.
Fasten your seatbelt, we are going to heaven.
Everyone in XAPA's WORLD is in Profit 🎯
Imagine not being a part of it
https://t.co/6atyr1eq5F
bitcoin:native
Yesterday, while uncertainty dominated the market, I stayed completely calm because I could roughly anticipate what was coming.
4 days after the lowest low, Bitcoin saw a rejection, went sideways-down for 16 to 32 hours, and then pumped further.
If this pattern repeats, a new high is to be expected this week.
You can see below, that the oscillator is about to break through the momentum, which historically has always signaled a strong pump!
100 % hit rate 🎯
imagine you are not part of XAPA's WORLD
https://t.co/6atyr1eq5F
bitcoin:native
Nailed every trade, tops and bottoms.
Did not expect to grow that fast, thank you for your support.
See you next week. 🚀
There is no siderline in XAPA's WORLD
join XAPA's WORLD
https://t.co/6Ws5lTFCXU
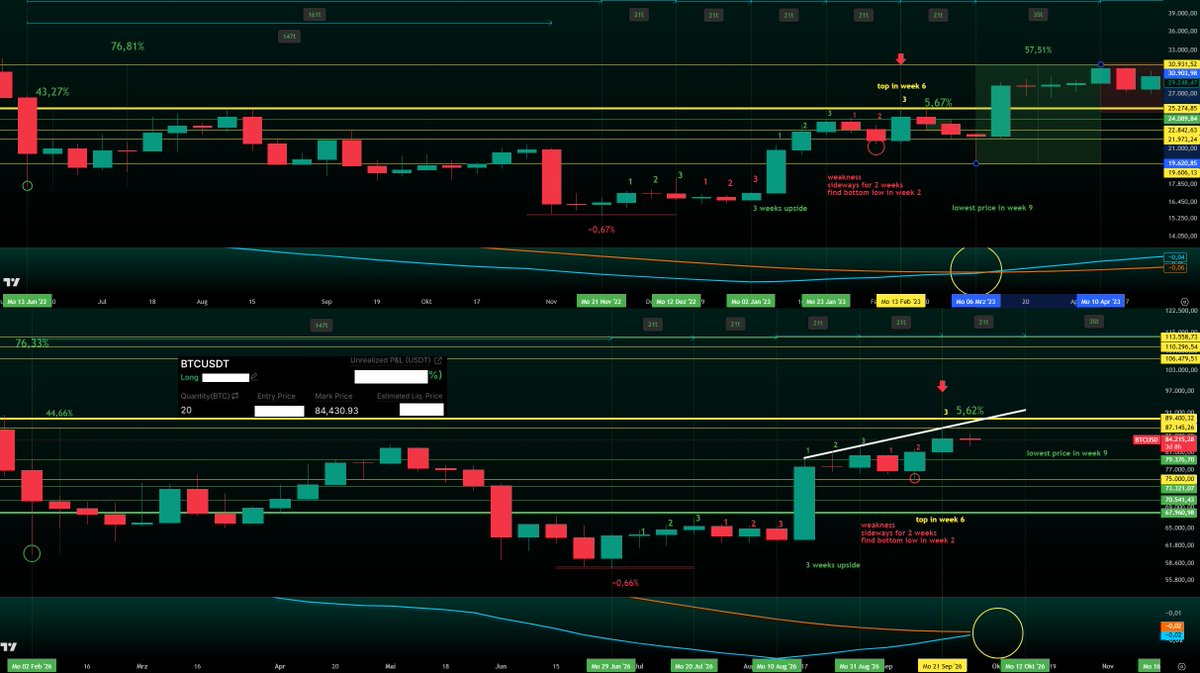
The HTF weekly pattern has played out exactly so far. Drawdowns are clearly smaller, so I don’t expect Bitcoin to go below $75,000.
I’m extremely bullish, but rational!
First the area around $87,000 has to be taken.
Once that’s done, the path almost inevitably leads toward $89,000, with momentum up to $91,000, where I expect a rejection.
Once that happens, I expect the low in the week 9.
A higher high above $87,300 would completely change the read on this pattern and would have to be treated differently.
After all this unnecessary noise, Bitcoin will rise toward $100,000 and print a new all-time high by next year.
I’ll close the 20 Bitcoin long between $87,000 and $89,000.
The chart says more than 1,000 words.
Every dip is an opportunity, a serious one.
This is a gift for our future. 🌹
bitcoin:native
As you could already see in my previous thread, it wasn’t off the table that Bitcoin would tap $84,600 again before falling further.
What can we expect now?
If the pattern continues to play out the same way it did in the past before the breakout, I expect Bitcoin to leave the yellow TEM zone today, meaning it should lose the important $82,800 level for the first time today.
Weakness should show up between 6 PM and 2 AM.
The low should be in by today’s daily close, or tomorrow’s daily close at the latest.
I expect Bitcoin to tap the $79,700 area at most, even if only briefly, before a 5% pump.
After that pump, I expect a correction back toward $79,000, with an open possibility that Bitcoin also sees the $75,000 level before Bitcoin pumps toward $100,000.
bitcoin:native
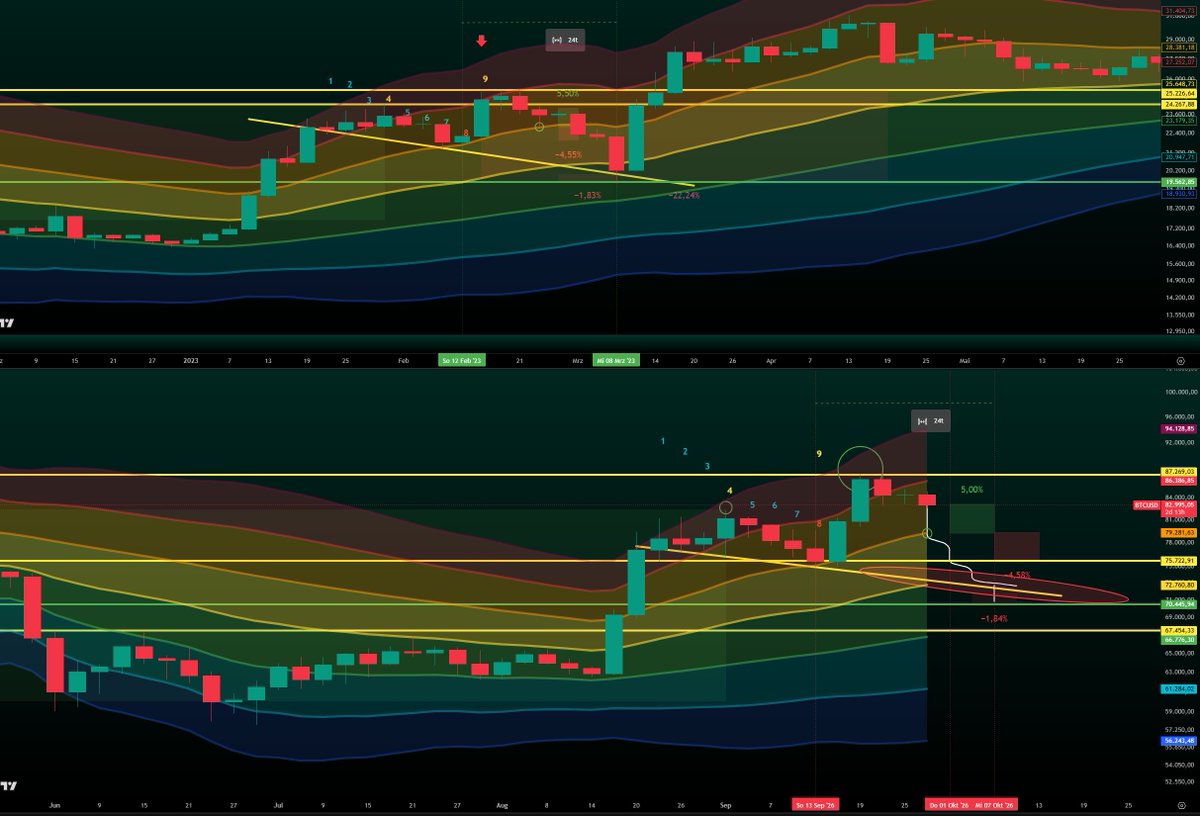
According to the pattern, on the 3D timeframe, Bitcoin could be at $79,300 by Wednesday, a dump into month-end and quarter-end.
If Bitcoin sells off into the month-end close, I expect a 5% pump afterward, followed by a move down into the $75,000 zone, thats the pattern.
I expect Bitcoin to hold the $75,000–$79,000 range before heading toward $90,000-$106,000.
That’s why my first long entry is at $79,500, not at $79,000 anymore.
If the pattern repeats, it would look like this:
Dump into Wednesday toward $79,000, then a 5% pump within 3 days into October 4.
From October 4 to October 7, a final red 3D candle, then the move toward $90,000-$106,000.
Otherwise you can see on the chart what the maximum lows would be if the pattern repeated 1:1 on a percentage basis.
I’m not betting on that exact copy.
I’m betting on the $75,000–$79,000 range.
My longs will be larger than my shorts.
If we keep falling, I’ll add more to the long between $75,800 and $68,000.
bitcoin:native
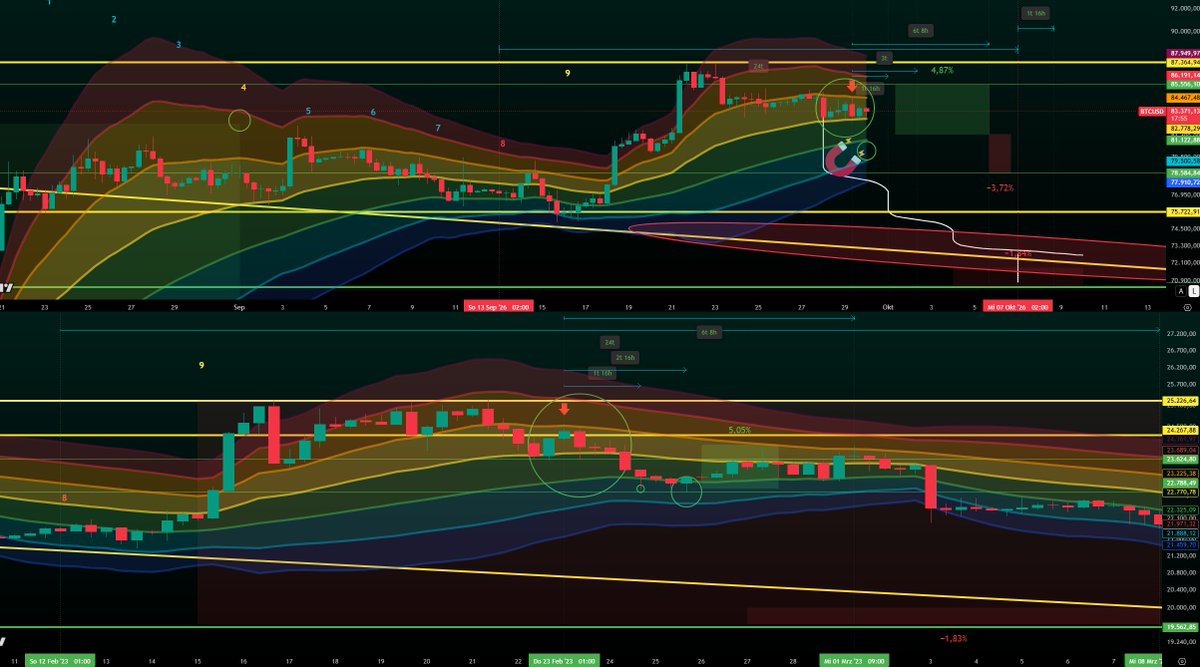
In 2023, Bitcoin needed just under 7 days from the first major breakout above the red TEM zone to the first touch of the light-yellow TEM line.
16 hours after that first touch of the yellow line, there was one last, very tight pump into the orange TEM zone, just barely above it.
From the touch of the yellow line to the next low, 3 days and 8 hours passed.
The same scenario is repeating now.
From the large wick outside the red TEM zone to the touch of the yellow TEM line, exactly 7 days passed.
If the pattern repeats on the LTF, we could expect at most one more wick above the orange zone, roughly between $84,600 and $85,600.
Measured from the yellow-line touch, Bitcoin should find its next low within 3 days and 8 hours.
That date falls on October 1 and therefore still fits my view as well as the 3D timeframe outlook.
bitcoin:native
The reason I doubled my SOL short is simple.
On the daily timeframe this indicator’s black bar only slides into the red zone once or twice a year.
That is rare.
When it has appeared in the past it has coincided with large, sustained downside moves.
It is doing it again now, which is why I increased the size.
The genius who coded that indicator is
https://t.co/Q7leQj5tEB
Please follow him, he deserves it!
solana:So11111111111111111111111111111111111111112
The black bar sliding into the red zone on the 4H timeframe, something that does not happen very often, is a signal that Bitcoin has to correct shortly afterwards.
On the 4H timeframe the signal is strongest when the black bar slips into the red overheated area. (LTF ONLY)
There is also a signal on the 4H when the black bar touches the green area, though it is not as strong as the red-zone signal on that timeframe.
In that case you can assume Bitcoin moves a few percent higher, likely 2–3%. So it is not off the table that Bitcoin could test the 85–86k area again.
I will increase my short positions in this price range, in case that actually happens.
The reading that a black bar touching the green zone is bullish is strongest and most reliable on the 12H and higher timeframes.
bitcoin:native
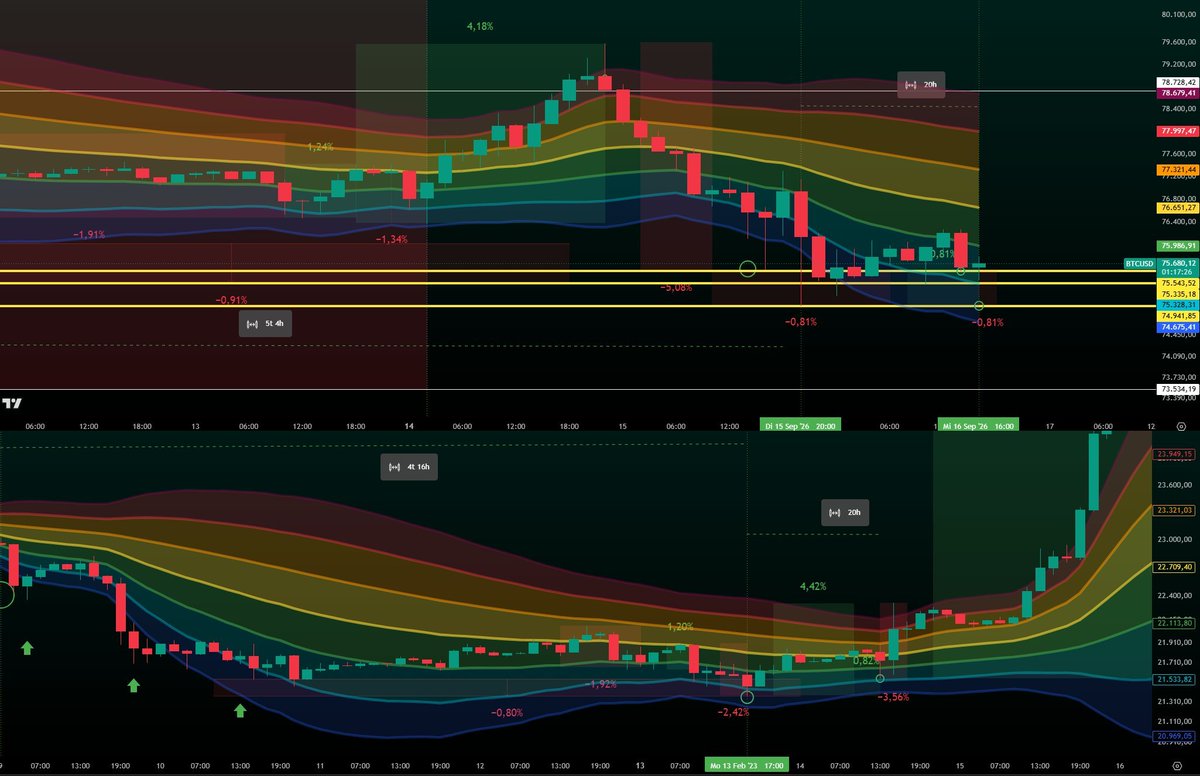
At the start of this video you’ll see exactly what I showed you yesterday!
Measured from its low, Bitcoin showed weakness 18–20 hours later before the rally resumed.
In 2023, 18–20 hours after the local bottom had formed, the move measured from the low up to that candle was only +0.81%.
That’s why the target was $75,000 and that level had to hold and it did.
The second photo is a 4h timeframe to show you the further development as a comparison with 2023.
On the last photo, which is the 2h timeframe, you can see that I had expected Bitcoin to stop at $75,000 after an approximately 0.81% drop.
What comes next is a push toward $80k+, followed by a move back toward $71k.
If the same time interval repeats, the first breakout should hit Thursday afternoon and run through the end of the week.
A new local high is likely to form from here.
It doesn't necessarily mean it has to happen again!
Since this is a high-timeframe (1W) pattern, delays or deviations may occur on lower timeframes than 1W.
bitcoin:native
Everyone’s hunting for a reason again, Clarity Act, headlines, whatever excuse fits.
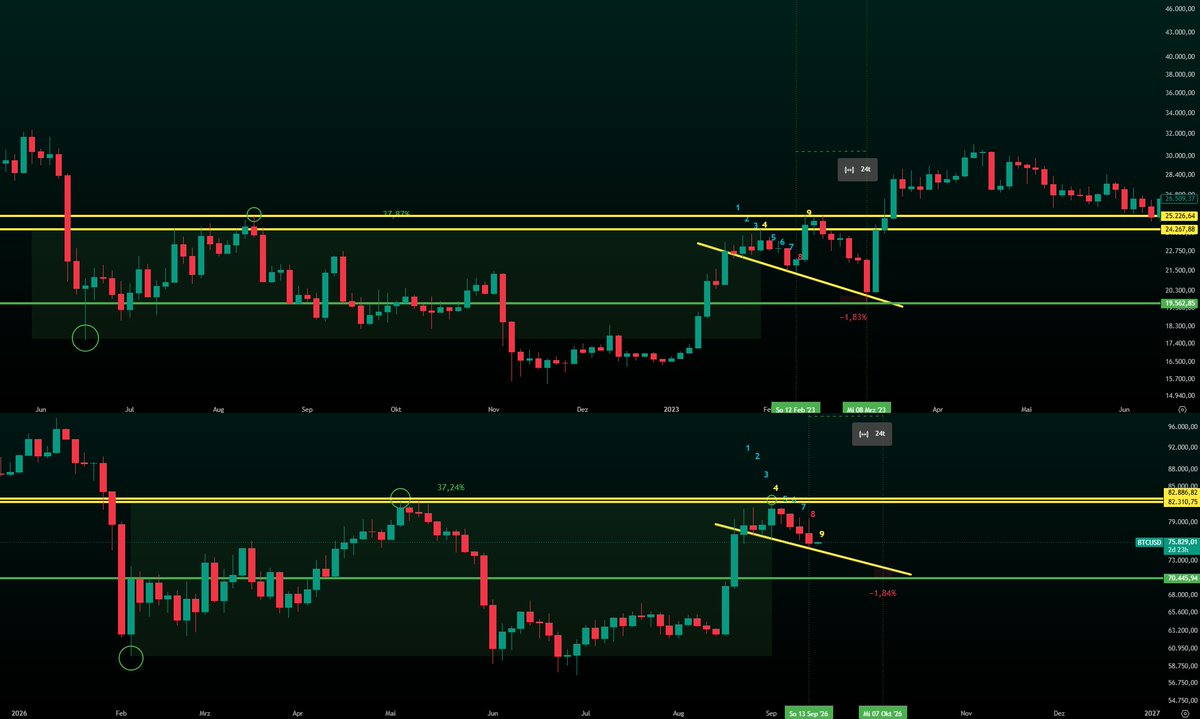
The HTF pattern was already there.
I refined it on the LTF so you could see it yourself, a clean copy-paste!
After the $82k rejection I said the target was the $75k zone, max $73k, within two weeks, then a pump back to $80k+.
Bitcoin doesn’t care if the Clarity Act passes, and it doesn’t need anyone.
If you’re still looking for news after the move, you never saw it.
The breakout in my previous video was marked for 2-4pm.
Rule number 1: Stick to your plan.
Voilà. 🎯
I've warned several times in Discord when I exit the trade and when I get back in.
It took a full 3 attempts before Bitcoin finally found support.
I now expect the move toward $80,000 to continue, followed by a dump to $70,500–$71,000. ⌛️
https://t.co/6atyr1dSg7
bitcoin:native
It's looking very similar to me.
The same pattern on the 3D view.
I don’t expect a sharp dump and currently don’t see Bitcoin going below $70,000, though it can’t be ruled out.
Candle 4 = high
Candle 8 = low
At exactly the same time!
On the 3D timeframe, the day falls on a Sunday.
I already showed you the time intervals in the previous post.
If it repeats:
Rejection at 82k
bottom Oct 7 around 70.5k
90k+ by early November
" If the $75k area is lost, $73,000–$73,900 are the next targets where I’ll add more to my long. "
Since this is a high-timeframe (1W) pattern, delays or deviations may occur on lower timeframes than 1W.
It doesn't necessarily mean it has to happen again!
bitcoin:native