Areas of Pure Mathematics that Fuel Artificial Intelligence:
◆ Linear Algebra
◆ Calculus
◆ Probability & Statistics
◆ Set theory
◆ Graph theory
◆ Optimization
◆ Information theory
◆ Topology
◆ Combinatorics
Is it possible to have a discordance between weak /moderate calibration while keeping mean calibration (O:E =1 and alpha = 0) fixed? while share same ICI despite opposite calibration verdicts and or markedly different curve shape /tail.
@ESteyerberg@BenVanCalster@f2harrell I can't see that the use of Quadratic (lp^2)or cubic spline terms rcs(lp) in calibration curve is efficient when the underlying baseline outcome exhibits seasonal risk patterns such as cardiac events peaking in winter, or infectious diseases incidence.
New blog article on Statistical Thinking:confidence limits for bootstrap overfitting-corrected predictive performance measures for regression models, useful for strong internal validations including confidence bands for debiased calibration curves: https://t.co/IiqxnRsK8q #rstats
Footage by @badr_elhabsi (Oman).
Me: PCA Projection
♦️Real Camel (3D)
♦️Shadow on Sand (2D)
♦️Sunlight direction: Projection axes; which variance is best preserved.
♦️Sun angles: Different PCA Projections.
♦️Shadow distortion:loss in dimensionality reduction @f2harrell
من يستثمرُ بالعلم، يبني حضارةً خالدة، ويغرسُ في الزمن عقلاً لا يَشِيخْ.
أشكال الإستثمار بالعلم:
♦️التعليم الجيد
♦️البحث العلمي
♦️المنح الدراسية المحلية والدولية
♦️نشر الثقافة العلمية
♦️التكنولوجيا والابتكار
I see that a change in the logistic regression order in terms of variables has an impact on the model's coefficients[effect size estimates]; with a backward or forward regression for the same model variables can lead to a different set of predictors being selected (based on AIC).
To illustrate the difference between least squares estimation and maximum likelihood estimation, I built an interactive #Python dashboard using @matplotlib.
Adjust the mean of a parametric distribution:
Top plot – the mean squared error (MSE) between the parametric CDF and the empirical CDF of the data.
Bottom plot – the likelihood of the observed data under the parametric PDF.
A visual comparison of how squared error and likelihood differ when estimating parameters. I share it on #github @ https://t.co/lNdq4FF4Bl ∀.
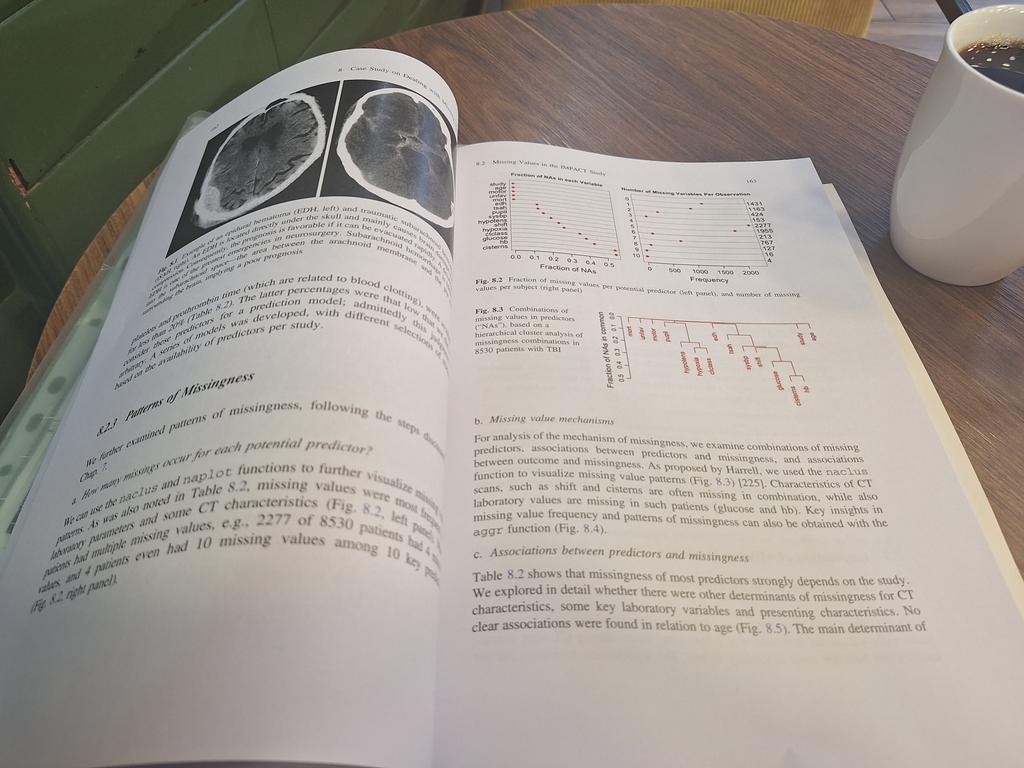
Clinical Prediction Models:Chapter 8 (Dealing with Missing Values).
●Missing values in outcome ●Quantification of missingness of predictors
●Patterns of missingness
●Imputation of Missing Predictor Values.
@ESteyerberg