She/Her MSc Past Climate and Environmental Change(Quaternary Science) student at Royal Holloway🌲🌏🌋🪨⛰️
Looking for my next opportunity in academia & research
Mysterious volcanic eruption of 1831 finally identified as the Zavaritskii caldera on Simushir Island (Kurils) using ice cores from Greenland. @WillHutchGeo@peter_abbott@EarthSciStA@unibern @OeschgerCentre @ERC_Research
🌋🌋🌋
https://t.co/4REaOKYfVD
A reminder of the Lund Luminescence Day 2025 (LLD25).
The program for January 16 is now set - it will be an intense day with information about what luminescence is and can be used for, and examples of ongoing research.
https://t.co/g2efWf9UlU
Really looking forward to speaking at this workshop in February about my work on socio-environmental and colonial histories of nature reserves in Jordan 🌿🌿
🌋NERC competition-funded #PhD opportunity @SwanseaTephra@swanseageog
Interested in using distal ash fall to constrain the timing and scale of past volcanism and climate change in the Mediterranean?
Full details: https://t.co/0bf0zlPIf4
Want to turn your research into real action? Join this free #PolicyEngagement training for #UKResearchers. Get hands-on guidance and policymaker insights.
Register by 5 pm (UK time) on Wednesday, 4 December 🔗 https://t.co/3kU6ltljmV
This virtual training is offered at no cost on behalf of @NERCscience and @ESRC.
#ResearchImpact #PolicyImpact
For women in academia, barriers to having children aren't just finding partners or preserving fertility. It's systemic barriers—relentless relocations, temporary contracts, focus on individual achievement—planning for a family is like an impossible luxury.https://t.co/itwB9c9odw
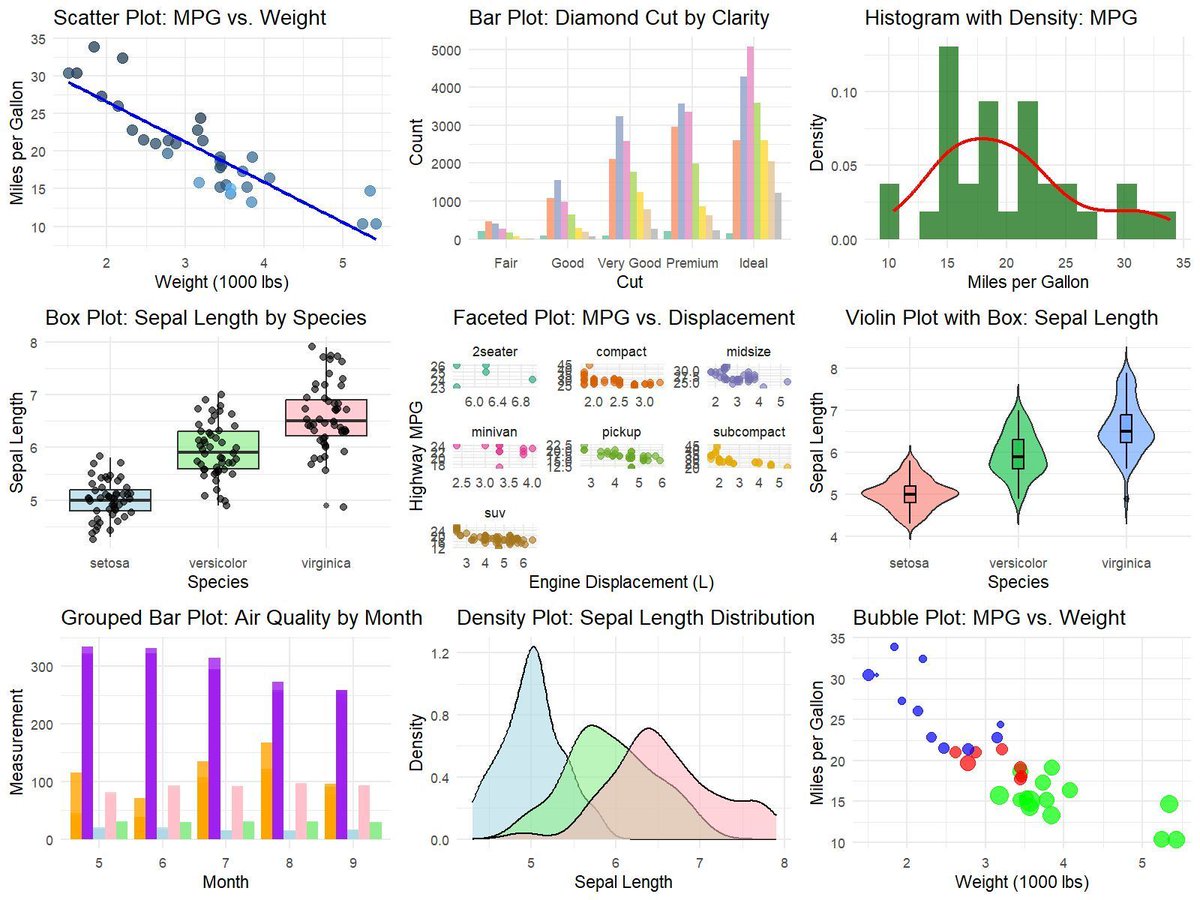
ggplot2 is the gold standard when it comes to data visualization. Here's why:
✔️ Consistent, intuitive syntax that makes it easy to learn and use across various plot types.
✔️ Seamless integration with other tidyverse packages, enabling smooth data workflows.
✔️ Efficient handling of large data sets, ensuring smooth and responsive plotting even with complex data.
✔️ Over 100 extensions that enhance its core capabilities, providing endless options for creative visualizations.
✔️ Trusted by more than 1,000 packages, ensuring reliability and broad support.
The image in this post showcases examples of ggplot2 visualizations, demonstrating its versatility to create a wide range of plots with nearly limitless customization options.
Want to learn more? Check out my online course, "Data Visualization in R Using ggplot2 & Friends" for a deeper dive into creating stunning plots with ggplot2.
More information: https://t.co/ztlEzoEDWv
#Data #DataVisualization #RStats #datavis
New work reveals the impact of anxiety & depression on PhD students.
"Anxiety and depression can have a substantially detrimental impact on graduate students’ experiences [..] and likely also contribute to increased time to degree and student attrition."
https://t.co/iNitLTuagj
I’m recruiting a technician & PhD students to join my lab at UF! I'll be based at the Fort Lauderdale REC and focus on soil-plant-microbe interactions in response to env. change. Check out the details below and feel free to share! Candidates, contact me at [email protected]
New topsoil geochemistry data provides the most extensive snapshot of environmental pollution effects around the UK.
The maps pinpoint the distribution of 41 different chemical elements, providing invaluable insights across a wide range of disciplines.
https://t.co/DgDTtSmGkz


![ItaiYanai's tweet photo. New work reveals the impact of anxiety & depression on PhD students.
"Anxiety and depression can have a substantially detrimental impact on graduate students’ experiences [..] and likely also contribute to increased time to degree and student attrition."
https://t.co/iNitLTuagj https://t.co/kej4BRT7dt](https://pbs.twimg.com/media/GdXPlFtXAAA9FBP.jpg)


