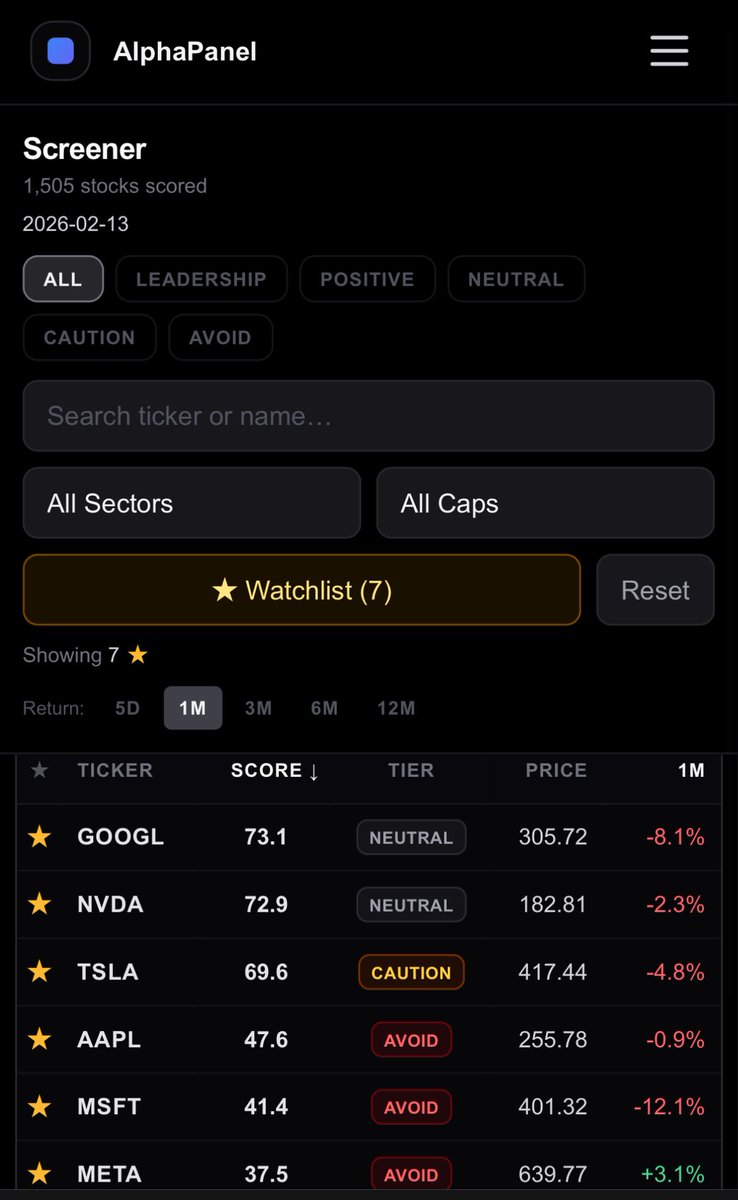
@MMatters22596 $SOFI has had our Positive rating since early ’25.
It hasn’t broken out the way many expected, but relative strength hasn’t collapsed either.
Still ranking in the upper percentiles.
@yianisz $PLTR currently scores 80.3 on my composite framework.
That places it in the Positive tier — constructive, but not top-decile leadership.
Sub-70 would signal structural deterioration.
@TheRonnieVShow $MSFT scores 41.4 in our system — lower-tier positioning at the moment.
But it’s absolutely still on the watchlist.
If structure improves and it climbs back into the 70s+, that’s a different conversation.
@KrisPatel99 $NOW at 25.2 on composite.
Even with insider buying headlines, it’s sitting in the bottom decile across 1,500+ U.S. stocks.
That tells me this isn’t just optics — the cross-sectional structure in SaaS has materially weakened.
@anandchokshi19 Valuation is one lens.
On composite positioning across 1,500+ U.S. stocks, most of the Mag 7 are currently mid-tier — not leadership.
I’d want to see composite strength re-emerge before getting aggressive.
@Speculator_io Agree on the structural case for energy.
In our cross-sectional ranking (outside of uranium), the strongest traditional energy names right now are:
• $PARR
• $DK
• $BTU
Strength is showing up in refiners and coal before the broader complex.
@TheETFTracker We rank all 11 SPDR sectors cross-sectionally.
Current leadership:
1️⃣ Industrials (XLI)
2️⃣ Health Care (XLV)
3️⃣ Materials (XLB)
Tech no longer dominates. Rotation is broadening.
@midascabal From a relative strength standpoint, $PATH ranks 38.2 in our cross-sectional model.
Still lagging most of the market despite recent volume pickup.
Would need to see sustained improvement before it cracks higher tiers.
@LEAPTRADER_ Of this list, $MU is one of the strongest technically right now — 91.2 composite score and firmly in Leadership.
Not many stocks are clearing that bar at the moment.
@DividendTalks Interesting shift.
On our dashboard, Industrials currently rank #1 by composite strength, while Tech sits closer to the middle of the pack.
Breadth improving outside the Mag 7.
@MarketMatrixs Interesting overlap.
$MU currently scores 91.2 in my cross-sectional strength model — one of the few names in the Leadership tier right now (~3% of the universe).
Strength and capital flows seem aligned here.
@TheRayMyers From a strength perspective, $SOFI ranks 86.8 in my universe of 1,500+ stocks — strong, but true leadership is currently limited to ~3% of the market.
Allocation matters more when breadth is narrow.
@JasonL_Capital Fundamentally there’s a strong case here.
From a trend standpoint, $AMZN still isn’t showing leadership yet in my rankings — but that can change quickly if momentum rotates.
@MMatters22596 $AMD prints an 89.4 composite in our cross-sectional model.
That places it firmly in the upper decile — but just shy of Leadership.
Only 2.9% of stocks are currently 90+.
Strength is there. Breadth is thin.
Each stock receives a 0–100 composite score based on structural strength and regime context.
Higher scores signal leadership.
Lower scores flag deterioration.
No narratives. Just rankings.
@nikoliasgoninus Down ~31% this month, but now scoring an 85 in my composite ranking.
Cross-sectional strength hasn’t collapsed the way price alone might suggest.
@qualtrim AWS now driving 57% of operating income is impressive.
In my cross-sectional models, when profitability becomes this concentrated, forward return dispersion tends to widen.
The durability of cloud margins becomes everything.
@SJosephBurns $CSCO screens 50.1 in my composite model — Avoid tier.
Relative structure had already deteriorated before this move.
Large single-day losses often follow prolonged cross-sectional weakness.
@meetblossomapp Interesting on valuation.
From a cross-sectional perspective, $NFLX ranks in the lowest decile in my model (11.2).
Weak relative structure has persisted despite multiple compression.