@captaincrypto21@Maevaghennam1 C'est grâce à vous et toute la Team du Captain Trading qu'ils sont là. Le Coach FX_Hamster a pu forger ces durs à cuire avec une discipline, rigueur et bonne pédagogie, avec une ambiance familiale. Ave à toi FX_Hamster.
I cannot post any ratings for my favorite , the support can not help you they don't give you any reason for blocking your post. THEY DISCRIMATE SOME GEOGRAPHIC REGIONS.
Why are you like this on 2026?
Here is their answer:
Good morning,
Thank you for your response.
We have reviewed your case, but in order to protect our platform and our community, we must stand by our decision and keep your review offline.
We hope you understand our position and our commitment to ensuring that Trustpilot remains a trusted space for our community. As this decision is final, we now consider the matter closed.
Sincerely
YOU MUST CHANGE
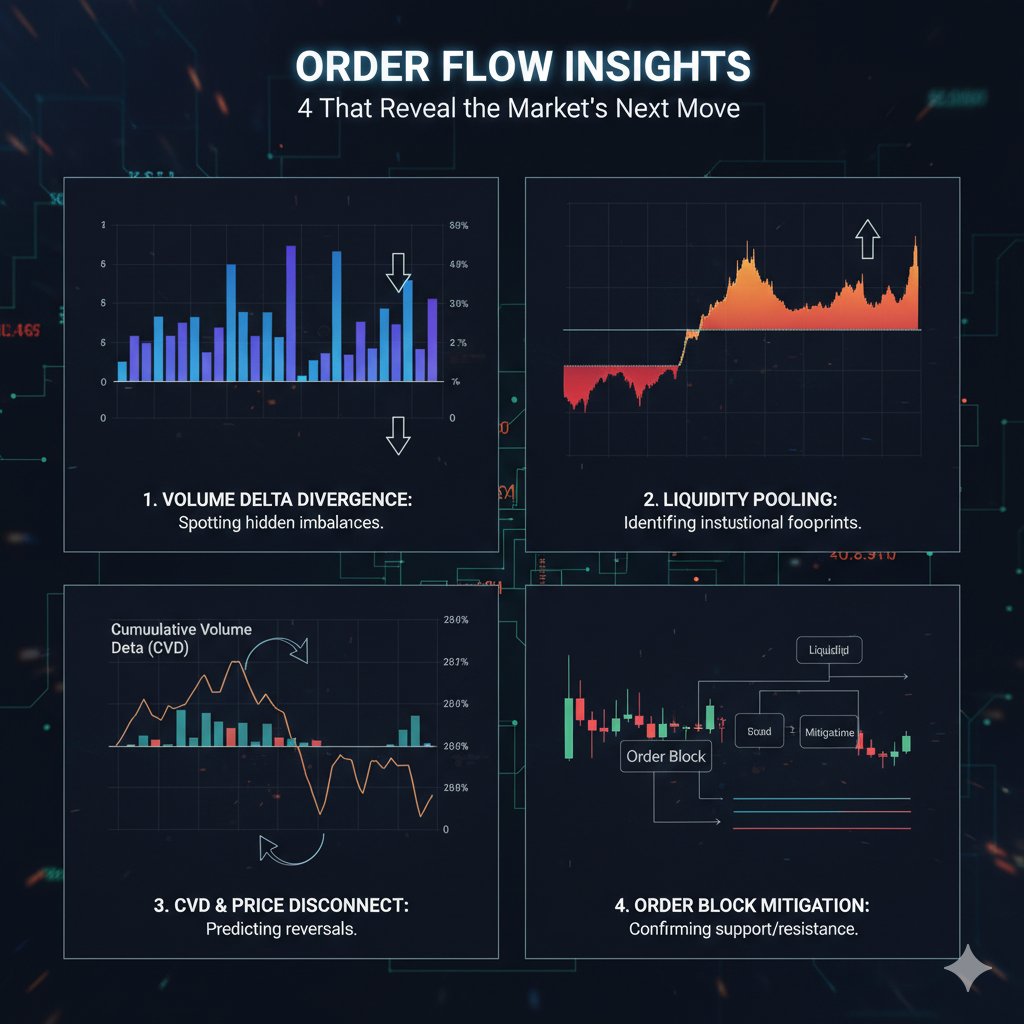
What Your Price Chart Is Hiding: 4 Order Flow Insights That Reveal the Market's Next Move
Introduction: Beyond the Squiggly Lines
If you've ever stared at a price chart, watching the lines wiggle up and down, and felt like you were missing the real story, you're not alone. Traditional charts show you what happened, but they don't always explain why. It’s like watching the scoreboard of a game without seeing the players on the field.
Order Flow Analysis is the technique that lets you look "under the hood" of the market. Instead of just tracking past price movements, it allows you to observe the real-time actions of buyers and sellers as they happen. This article breaks down four critical insights from order flow that can fundamentally change how you view the market and inform your trading decisions.
1. Stop Predicting from the Past—Start Reading the Present
The most significant shift that order flow introduces is moving from a reactive to a proactive mindset. Technical Analysis (TA) is a powerful method that uses historical price and volume data to identify patterns and predict future trends. It’s based on the idea that past behavior can indicate future outcomes.
Order Flow, in contrast, is the technique of interpreting the real-time flow of buy and sell orders to predict immediate future price movements. It doesn’t wait for a pattern to form on a chart; it reads the live intent of market participants. This provides "early signals" that can identify shifts in buying or selling pressure before traditional indicators have a chance to react.
Technical analysis studies past price and volume to identify patterns. Order flow focuses on current market activity, showing exactly where traders are placing orders and how price reacts. This makes it possible to anticipate moves based on the actions of participants rather than waiting for a pattern to complete.
This shift from analyzing lagging historical data to interpreting leading real-time data is a game-changer. You stop reacting to the market’s history and start anticipating its next move by reading its present intent.
2. You Can See the Footprints of "Smart Money"
One of the most powerful aspects of order flow is its ability to reveal the activity of the market's "star players"—large institutional participants often called "smart money." Because these participants trade in sizes that can move the market, knowing their intentions provides a significant strategic advantage.
Classic "tape reading," or monitoring the Time and Sales feed, shows the price, volume, and time of every executed trade, revealing large block trades as they occur. Modern tools take this a step further. For example, Bookmap’s "Volume Bubbles" (also called Volume Dots) visualize trade size directly on the chart, acting as a graphical representation of the tape. As the source material notes, "Larger bubbles indicate higher volume trades," a phenomenon that often signifies institutional activity.
By observing patterns of accumulation (consistent large buy orders) or distribution (consistent large sell orders), you gain a direct line of sight into the strategic positioning of major market participants. This allows traders to spot phenomena like iceberg orders—large hidden orders that only reveal a small portion at a time—giving a truer sense of institutional intent. This capability gives you the opportunity to trade alongside the market's most influential forces, rather than against them.
3. The Market Isn't a Line, It's a Live Map of Intent
Traditional charts simplify the market into a single line representing price over time. Order flow tools, particularly heatmaps, challenge this view by presenting the market as a live playbook of supply and demand.
A heatmap provides a "dynamic visual representation of the order book," showing where large clusters of buy and sell orders (liquidity) are waiting to be filled, with brighter colors representing higher concentrations of orders. These bright areas on the map represent potential support and resistance levels as they build up and dissipate in real-time.
Traders can quickly identify key support and resistance levels by seeing where large orders are clustered.
You no longer see a simple price line; you see a three-dimensional battlefield of supply and demand, revealing strategic entry and exit zones before they are obvious on a traditional chart.
4. True Market Insight Comes from Combining, Not Choosing
It’s easy to fall into an "either/or" mentality, pitting one analysis method against another. However, order flow analysis is most effective when it is integrated with other forms of analysis to build a more complete picture of the market.
Combining the real-time insights of order flow with traditional technical indicators, fundamental data, and even market sentiment tools creates a "comprehensive analysis." This integrated approach provides several key benefits:
Confirm Your Strategy: Cross-reference order flow with technical patterns to confirm trades and avoid false signals.
Manage Risk with Confidence: Identify areas where real-time order flow contradicts your initial analysis, helping you avoid trades based on incomplete information.
Adapt in Real-Time: Use a multi-faceted view to adapt your strategy as market conditions—and order flow—change.
No single tool tells the whole story. The most successful traders understand that true market insight comes from building a multi-faceted view that leverages the strengths of different analytical approaches.
Conclusion: A Clearer View of the Market
Order Flow analysis offers a deeper, more transparent view of market dynamics that beautifully complements traditional methods. It shifts the focus from reacting to historical price action to anticipating future moves based on the real-time intent of buyers and sellers. By learning to read the flow of orders, you gain a clearer understanding of the forces driving the price.
If your charts only show you the market's past, isn't it time you used a tool that shows you its intent?
Just earned 0.72 Quacks on @wallchain_xyz in one day 🦆
Turn insights into rewards and climb the leaderboard 🥇
Use my referral link – https://t.co/kh4eDqNIqU
I am betting on $AVAX too cuz it looks so juicy at this price.
I'll look for an entry aroun this range.
Bullish flag on daily + almost a golden cross of the EMA 200/50
26.77 seems a strong resistence, once we break it and we close with 2 days candle above we can say welcome Upside.
Entry: CMP- 20.33
TPs:
1- 32.80
2- 41.75
3- 53.73
4- 70
5- little 5% of supply for moonbag
SL: 18.03
NFA & DYOR
P.S: i use @Backpack exchange for both spot & Lev🎒
Goodluck everyone
Just launched my Personal Mindshare Leaderboard on @wallchain_xyz 🦆
Massive thanks to everyone driving the most valuable mindshare with me this month:
@ItsEshOnX – Signal alchemist
@NessaC_w3 – Signal shepherd
@Skarrouche – Quant mastermind
@_RARE_NFT – Quality sentinel
@baba_krypt – Attention wrangler
Champion your strongest supporters.
Launch yours now 👉 https://t.co/bE7sIxMlJ0
@Ethereum_OS Still waiting for Code, I noticed that some team wallets are draining the liquidity beware and watch them and follow transaction the price dumped every day @Ethereum_OS can you give us some detail about what are happening?
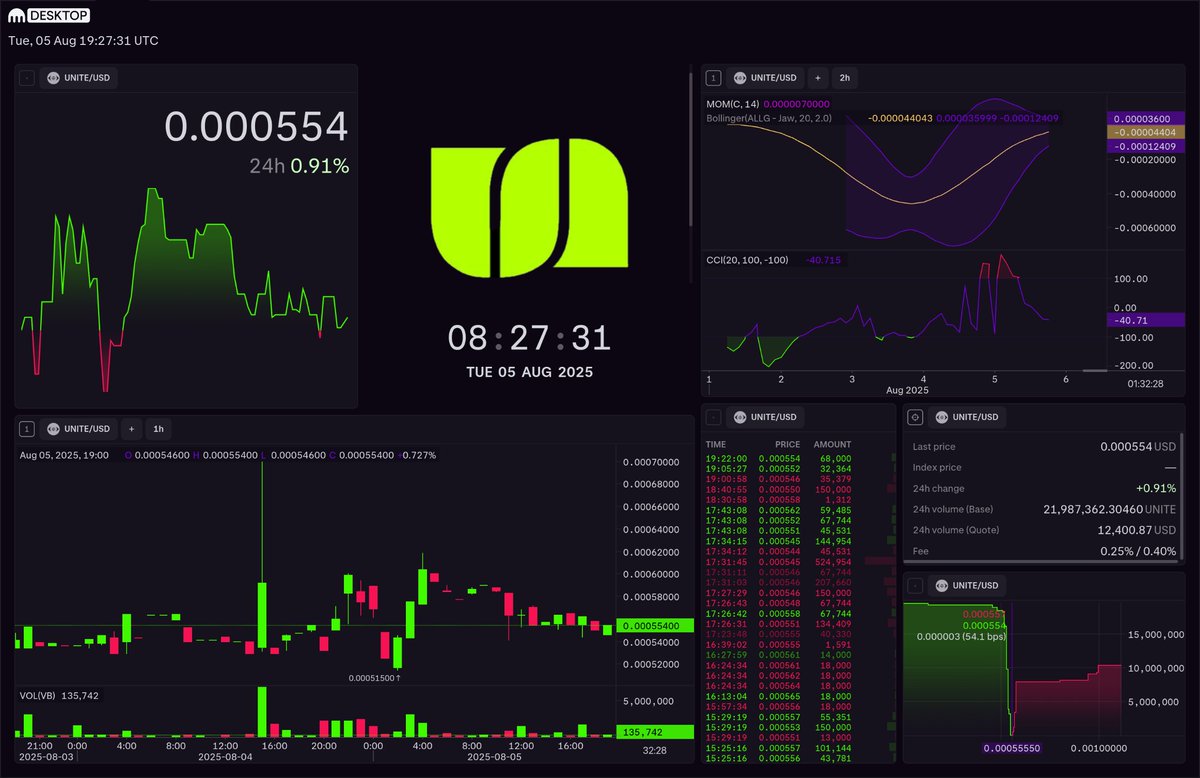
📣 August Layout Customization Contest is LIVE!
Drop your @Krak tag and a Kraken Desktop dashboard below for a chance to win 3 x $400 in prizes 🏆
Guest Judge: @Dentoshi 💁♀️
Full T&Cs below📜
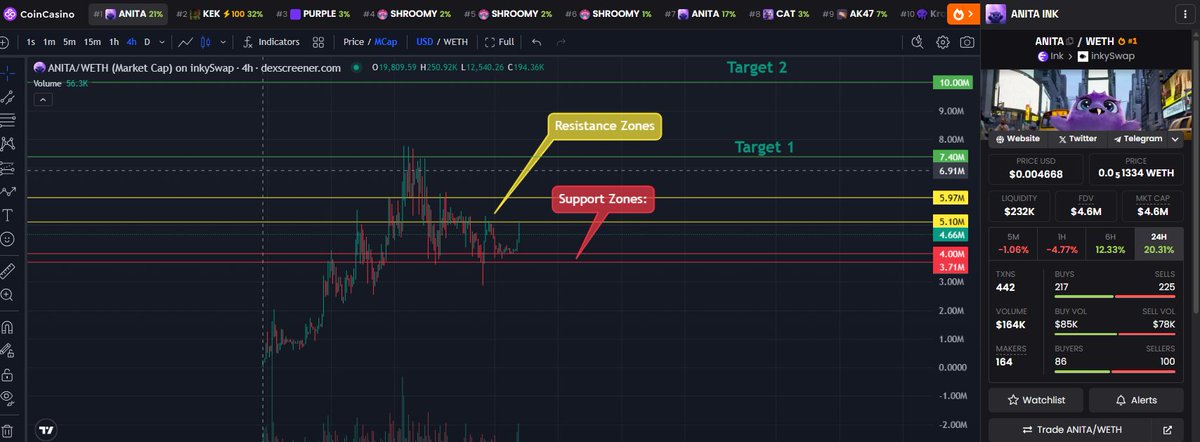
$ANITA is showing signs of bullish continuation after a healthy consolidation phase. Liquidity and volume are strong . If bulls reclaim $0.0051, momentum can accelerate fast toward $0.006–$0.0074. trend bias remains bullish.
ANITA is cooking again 🔥
🟣 Wave 2 correction looks complete , price held the range like a champ
🌀 Entering Wave 3 territory, where real momentum lives
📈 Volume rising with price = confirmation of impulsive structure building
🧠 Market psychology: disbelief turning into early FOMO , classic wave shift
💜 This isn’t noise. This is Anita charging into her next phase
Structure so far:
1️⃣ Wave 1: Ignition from community + Kraken support
2️⃣ Wave 2: Controlled consolidation, weak hands shaken
3️⃣ Wave 3 (now): Momentum-driven, fueled by Velodrome volume + narrative power
Target Zone?
🧮 Fib extension from origin aligns double digits right inside the 1.618–2.0 zone
Anita doesn’t just chart , she writes the script 🔮🟣
@ANITAONINKCTO@arjunsethi@inkonchain@nightelf