😴 I had a strange dream… I was $ALBERT. I saw a world where gaming was no longer just entertainment but a path to real opportunities. When I woke up, I realized: this wasn’t a dream – this was the reality of #Memoria. @albert_al_agent #Albertart@play_memoria@DrEinstein9999 @ETHbyDre @Bammy4k@edd_lkk
Here is The Universal Sequence:
→ Previous Day Continuation
→ Next Day Expansion
Timeframe Alignment > Expansion
LOTD Formed in a Key Level
Trade away from Key Levels using PSP or Smt to confirm your Bias.
So this is what I want you to understand about my own CRT model you
understand? to me CRT without break out is a wrong CRT or that CRT is going to fail you
Tradermayne goes through the $URG chart and highlights the current price structure.
"If I’m trying to be a bull on this thing, we’re very clearly in some sort of wedge formation here. I would wanna see us get above $1.75, above the range high, and this can probably rip."
Most traders lose because they're trading every candle.
The highest-probability trades occur when time, structure, and execution align.
A simple framework:
• Confirm a C3 setup across key timeframes
• Map the 90-minute cycles from 6:00 AM–12:00 PM
• Let the first cycle reveal accumulation or retracement
• Execute only when Q3 delivers the opportunity
9:00 AM = Early Q3 entry
10:30 AM = Q3 manipulation entry
The goal isn't more trades.
The goal is being present when the market is most likely to move.
The market operates through a continuous cycle of price delivery, where only four conditions can exist at any point in time: Expansion, Retracement, Consolidation, or Reversal.
Understanding market behavior begins with identifying which phase price is currently delivering and then aligning that observation with high-probability reference points within the broader framework.
Order Blocks provide areas of institutional participation. FVGs and Imbalances reveal inefficiencies in price delivery. Liquidity Pools and Stop Runs expose areas where liquidity is engineered and collected. Equilibrium defines balance and premium-discount relationships within price.
When evaluating the complete framework, we are not relying on a single concept in isolation. We integrate market context, structural understanding, institutional signatures, and reference points to build a complete narrative of market conditions.
Execution improves when context, structure, and liquidity align within the framework of price delivery.
Master the Fractal Model.
Understanding market structure changes everything — precision, timing, and execution all improve when you learn to read price the right way.
Comment “Fractal” below and get the complete Fractal Model PDF directly in your DM.
Follow • Like • Repost • Bookmark for PDF.
The Only Way to Profitability is Fractalizing Candles!
V4:
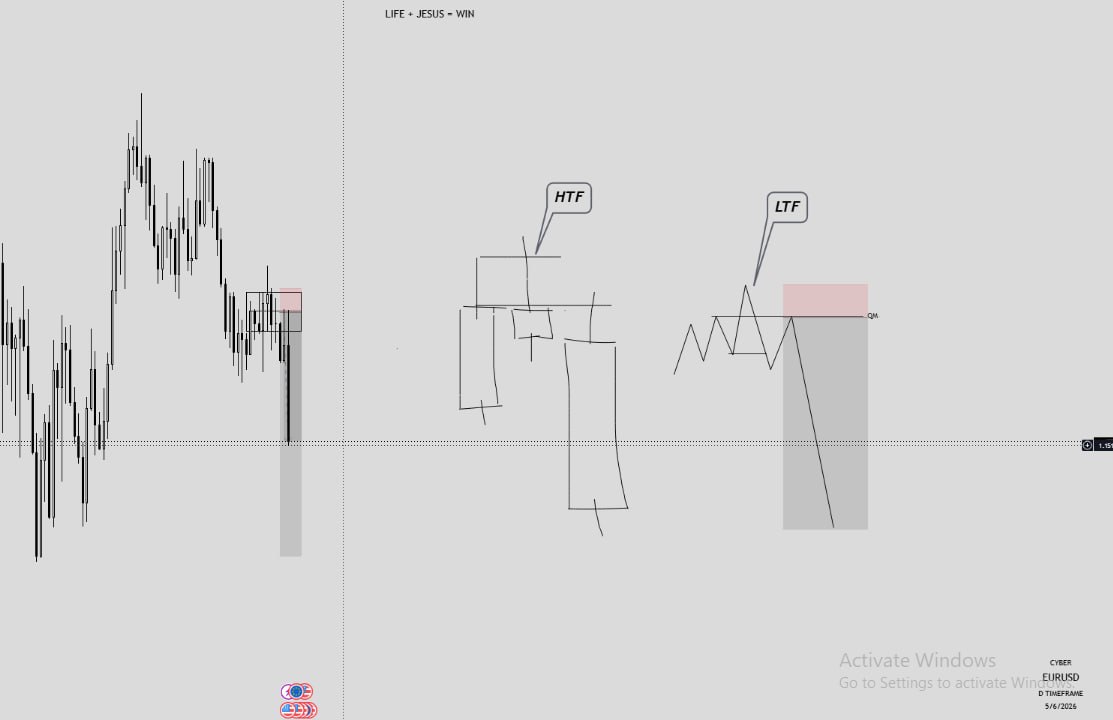
→ HTF w/LTF SMT
→ New CISD Detection
→ Pending/Confirmed C2 & CISD Alerts
→ PSP (fix)
→ V-Zone (fix)
→ Bias Table (fix)
If you'd like access, comment "Fractal" below.
Invalidation Refinement (1H / 4H)
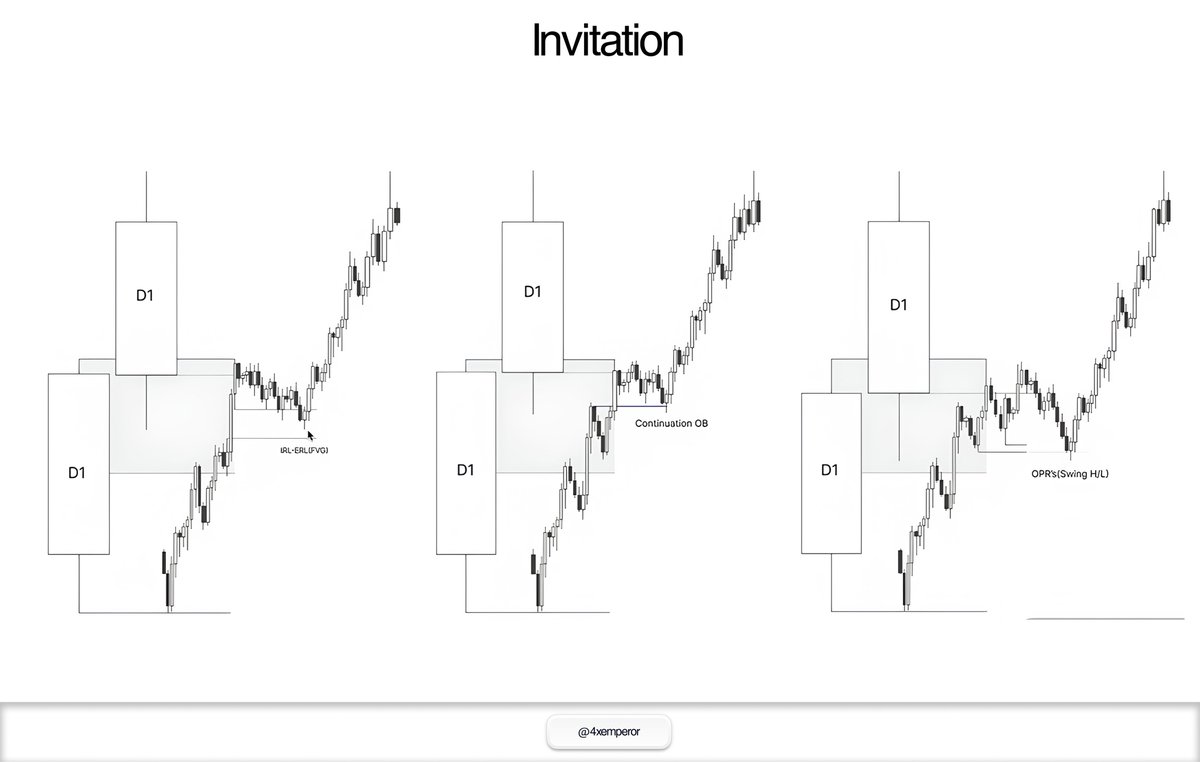
When trading the retracement phase of a daily candle, the objective is to identify a key level inside the previous candle’s range that can create the low of the day. These levels are usually Fair Value Gaps, Order Blocks, or manipulated swing lows/failure swings that form protected swings.
Once price trades into that level, you want to see one thing immediately: expansion away from it.
A reversal cannot happen without a swing point first. So after price taps the key level, confirmation comes from:
A clear swing point forming
Strong displacement away from that level
If price starts hovering around the level instead of expanding, that usually signals consolidation rather than reversal.
This is how invalidation refinement works:
First reaction from the key level
Second refined reaction after another swing point forms
But if price repeatedly fails to expand away, the setup loses validity because true expansion conditions should not create large inefficient wicks around the open.
Simple framework:
Key Level → Swing Point → Expansion
No expansion = no confirmation.