As part of the @LearnWithWiDa externship program, we explored data using Microsoft Fabric! 🚀
We built a dynamic e-commerce dashboard analyzing 51K+ orders, $7M in sales, and customer behavior across markets.
Week 4 consisted of learning Microsoft Fabric as part of the @LearnwithWiDa program!
Microsoft Fabric is a game-changer—combining Power BI, Synapse, Data Factory, and more into one unified analytics platform. From data ingestion to real-time insights.
We explored tools like OneLake, Lakehouses, Data Pipelines, and Notebooks.
With its collaborative workspaces and scalable architecture, it empowers data engineers, analysts, and scientists to work better and faster—all in one place.
I recently analyzed the Nigeria MDGs Information System (NMIS) dataset, covering over 98,000 education facilities nationwide between 2009 and 2014. The data reveals both major achievements and serious challenges in Nigeria’s education sector.
Week 2 Updates.
The @LearnwithWiDa initiative of mentoring both beginners and intermediates in data analysis has a lot of potential to revolutionize the way we look at data.
Our week 2 composed of a year-long financial analysis of Wi-Logistics.
Week 2 | Day 10–13 Update
What a wild week!
But my team and I in the @LearnwithWiDa & @ibn_wittig mentorship program handled a logistics company’s bank statement , and guess what?
We tied for 1st place overall with Team 2!
Here’s how we did it:
Thread🧵👇🏾
Hi #Datafam
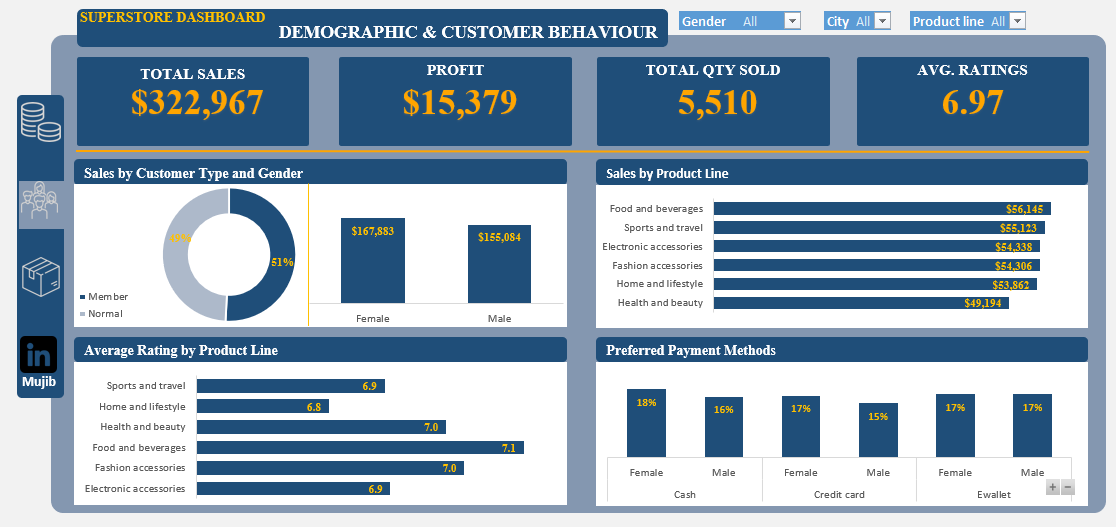
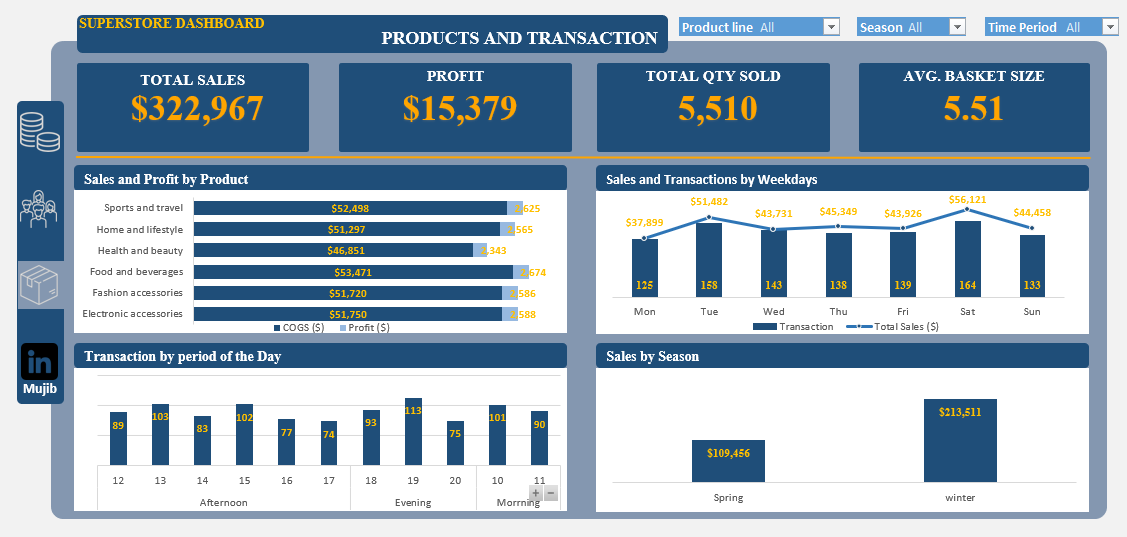
Built a Superstore Dashboard on @msexcel . Used Power Query to import and clean the data, then loaded it into Power Pivot's data model. DAX formulas were used to create measures for in-depth analysis. #Excel#DataAnalysis
As me and my team dive into Nigerian education data, we exploring this key question: How much do facilities and resource availability/management affect student enrollment in basic and senior secondary schools in Nigeria? Let's discuss! #EduData#NigeriaEducation@LearnwithWiDa