The Data Analyst Playbook Community is a space for analysts who want to move beyond tools and start thinking in terms of real business problems.
#DataAnalystPlaybook#DataAnalytics
ESG Data Analytics TikTok LIVE Session Day 2.
We went from:
Business Understanding → Data Understanding → Dashboard Build
Built:
- Overview Page
- Environmental Dashboard
This is how real data analysts work.
Follow to see the full ESG project unfold
https://t.co/3otJfGXFfW
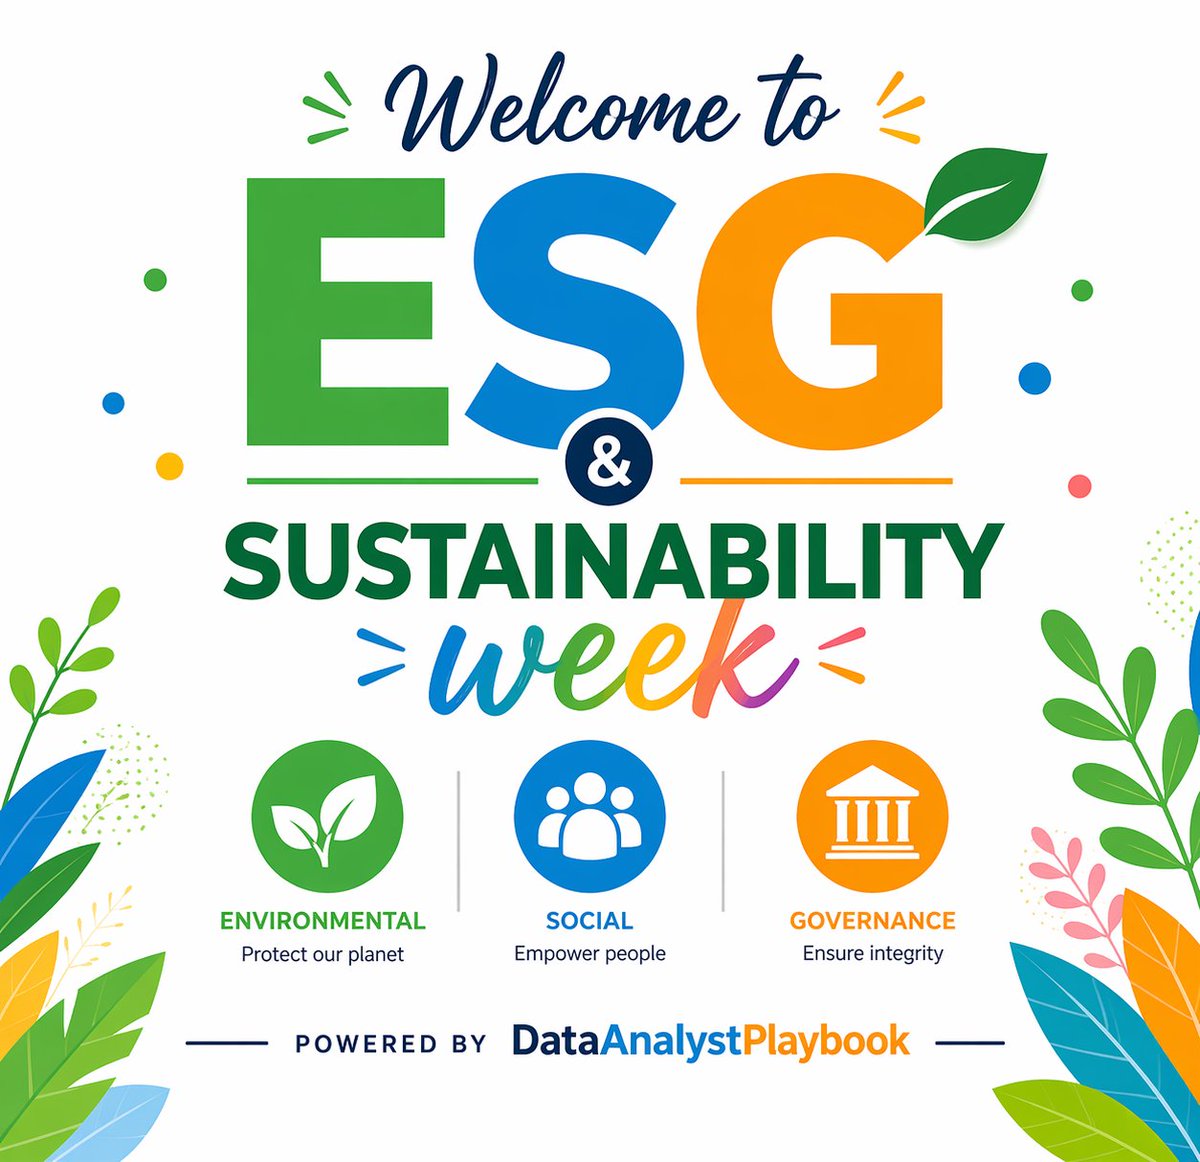
Welcome to ESG & Sustainability Week.
We started yesterday with a powerful session on “The ESG Project and Why It Matters to Businesses Today.
It was an impactful discussion on how Environmental, Social, and Governance (ESG) is not merely a reporting obligation, but a business performance driver, strength and stability, and value over time.
Through the session, we discussed:
- The utilisation of data in monitoring sustainability and compliance by organisations.
- The increasing significance of transparency and accountability in business processes.
- Why ESG measures are emerging as crucial to decision making, investment and growth.
- How analytics and dashboards (as are planned in our current ESG Power BI project) can convert raw data into actionable insights.
One of the lessons was quite evident:
Companies that incorporate ESG in their business are not simply doing good, but they are creating smarter, more sustainable and future-ready companies.
Later in the week, we will get more specific and closer to the real-world ESG analytics, looking at the environmental impact, social responsibility and governance effectiveness using data.
Stay tuned as we break down how data analytics is shaping the future of sustainability.
#ESG #Sustainability #DataAnalytics
Good morning world, blessed day 🙏
Progress update on my data workflow…
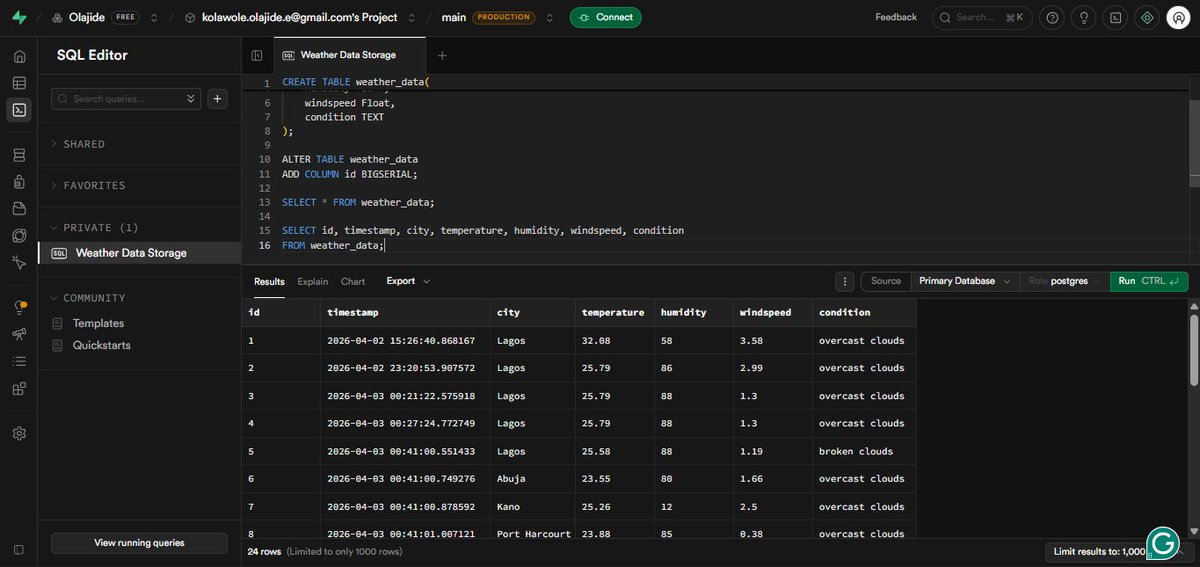
I’ve successfully moved both my Python script and database to the cloud.
After exploring different options, I settled on Supabase for the database. Most cloud services require payment, so I had to be intentional with my setup.
My script is now hosted on GitHub and already scheduled to run every hour, pulling live data from the API straight into my database.
Also expanded the dataset:
It’s no longer just Lagos, I’ve added more cities.
I’ll let the data run for a few days to build volume, then connect it to Power BI for visualization.
Honestly, I’m proud of this one.
Moving forward, all my personal projects will use live data pipelines, not static datasets.😎😎😎
#Datafam #SQL #DataPipeline #ETL #Automation @chidirolex
This week's task on platform marketing analyses with @chidirolex was a tough one, wheew. I've had to learn new marketing terms and techniques some companies use to sell a product.
My analyses show which technique actually worked and which one the company needs to cut back on.
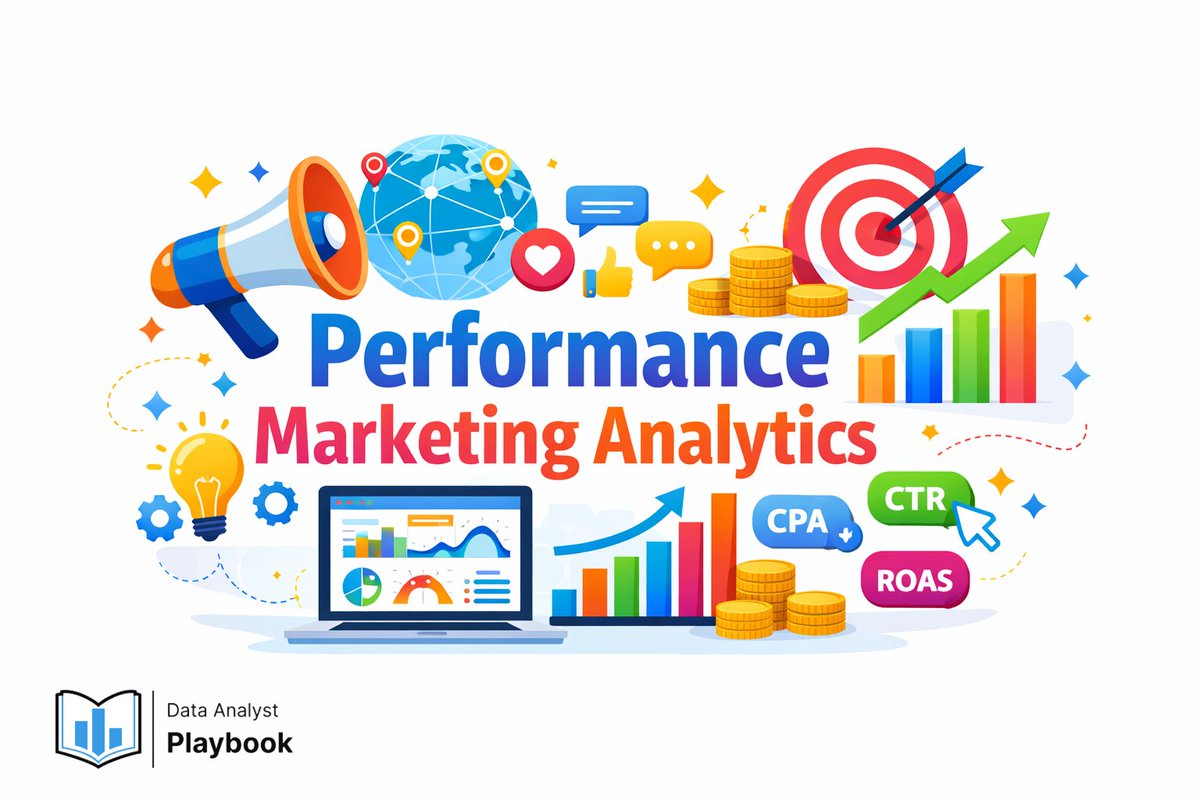
Today, I got my week 2 task brief from @AnalystPlaybook and I’ll be working on a performance marketing challenge for a feminine wellness brand.
I am to explain what’s happening in the business & why based on the business’s platform performance, creative attributes, metrics, …
Today is all about research and understanding 📖
No dashboards. No visuals.
Just taking time to really learn the business behind the data.
I’ll be digging into concepts like:
• CPA (Cost per Acquisition) – what it truly costs to get a customer
• ROAS (Return on Ad Spend) – how profitable campaigns really are
• And other key marketing metrics
But beyond definitions, the goal is to understand:
👉 Why do these metrics exist?
👉 How do they influence real business decisions?
Because better analysis starts with better understanding.
Week 2 – Data Analyst Playbook
This week’s focus is on understanding the data before jumping into analysis.
We’re working with data from Meta and TikTok to see how people move from seeing an ad to taking action.
@chidirolex@analystplaybook@jickson234
Week 2 of the Data Analyst Playbook Cohort 2 just kicked off 🚀
And this week, we’re doing something many aspiring analysts skip…
👉 Understanding the data before touching any dashboard
No visuals yet.
No Power BI builds yet.
Just deep, structured thinking.
We started by breaking down the dataset and the business context behind it:
📊 Creative-level performance marketing data
📱 Platforms: Meta & TikTok
🎯 Focus: Attention → Engagement → Conversion
We took time to properly understand key metrics:
• CTR (Click-Through Rate) – Are people even interested enough to click?
• CVR (Conversion Rate) – Do clicks actually turn into results?
• CPA (Cost per Acquisition) – How efficient is the spend?
• ROAS (Return on Ad Spend) – Is the campaign truly profitable?
Then we introduced a core concept:
👉 The Marketing Funnel & Funnel Leaks
Impression → Hook → Engagement → Click → Conversion
At every stage, users drop off.
That drop-off is called a leak.
And the goal is simple (but not easy):
Find where users are leaking… and explain why.
This week’s focus is on:
📖 Understanding the dataset deeply
🧠 Connecting metrics to real business meaning
🔍 Identifying potential problem areas before analysis even begins
Because strong analysis doesn’t start with charts…
It starts with clear thinking and the right questions.
Next step: turning this understanding into insights.
If you were in this position…
👉 What questions would you ask first about this data?
You can follow along on YouTube, and don't forget to subscribe.
https://t.co/XBPLFfOL2i
#DataAnalytics #MarketingAnalytics
New week at @AnalystPlaybook community!
For Week 2, I’m stepping into the role of a performance marketing data analyst. Big thanks to Mr. @chidirolex for breaking down the project so clearly and setting the tone for what’s ahead.
Let’s get into it 👌
Week 2 of my Data Analytics journey.
Diving deeper into performance marketing analytics using Microsoft Power BI not just building dashboards, but uncovering why campaigns succeed or fail.
Clicks don’t equal conversions. Data tells the real story.
@chidirolex@AnalystPlaybook
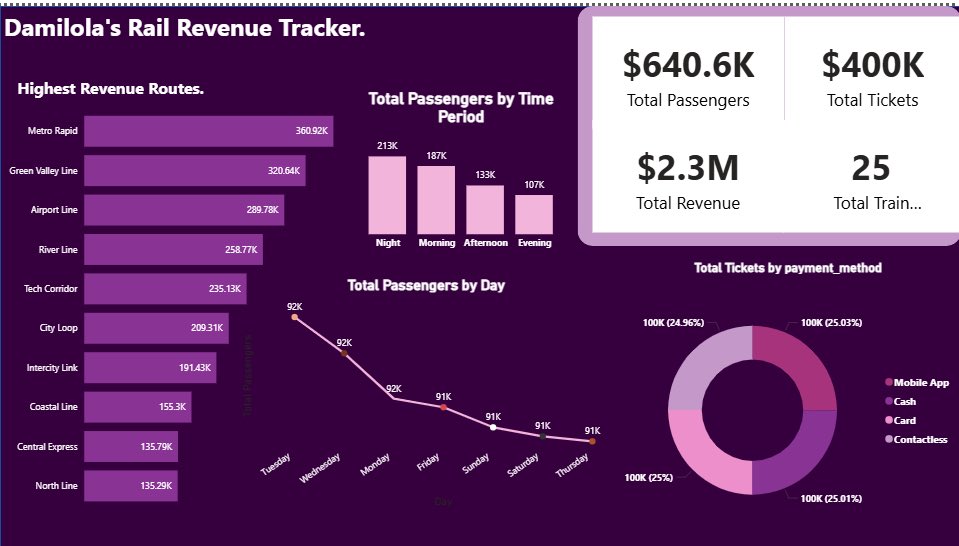
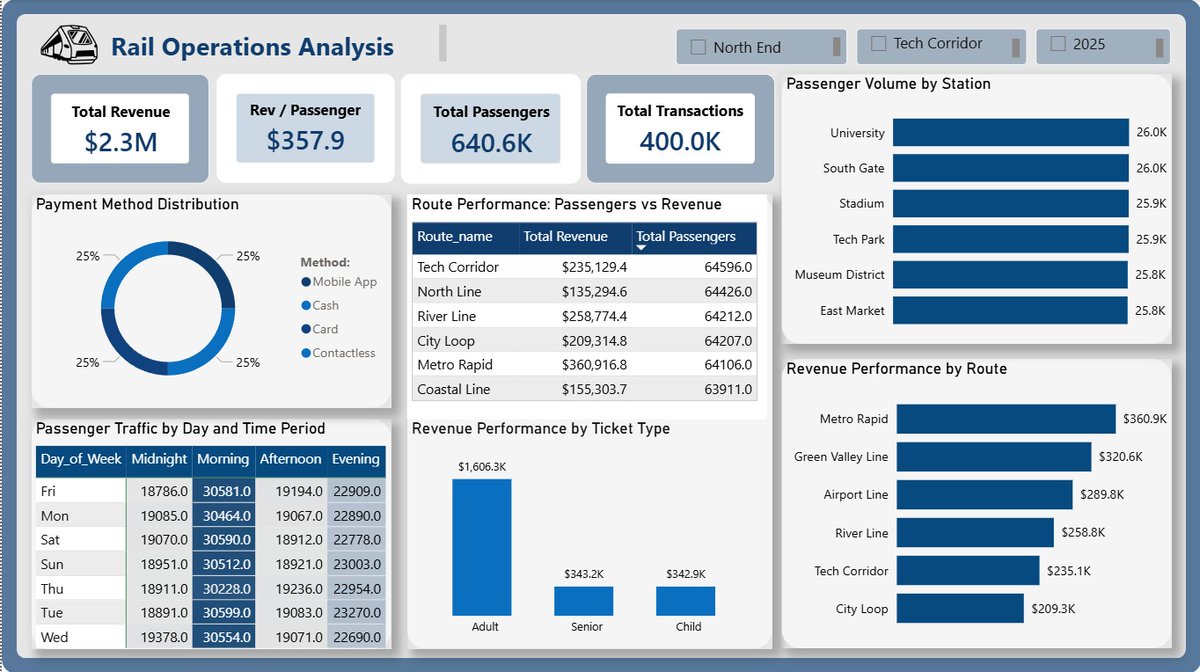
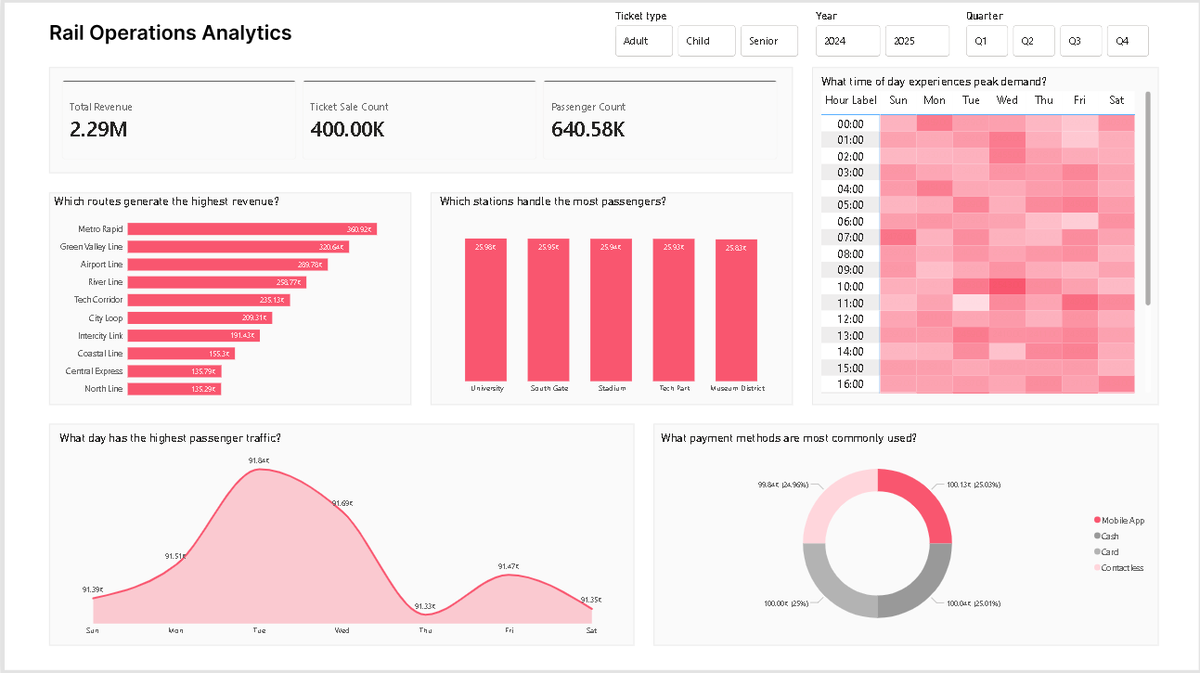
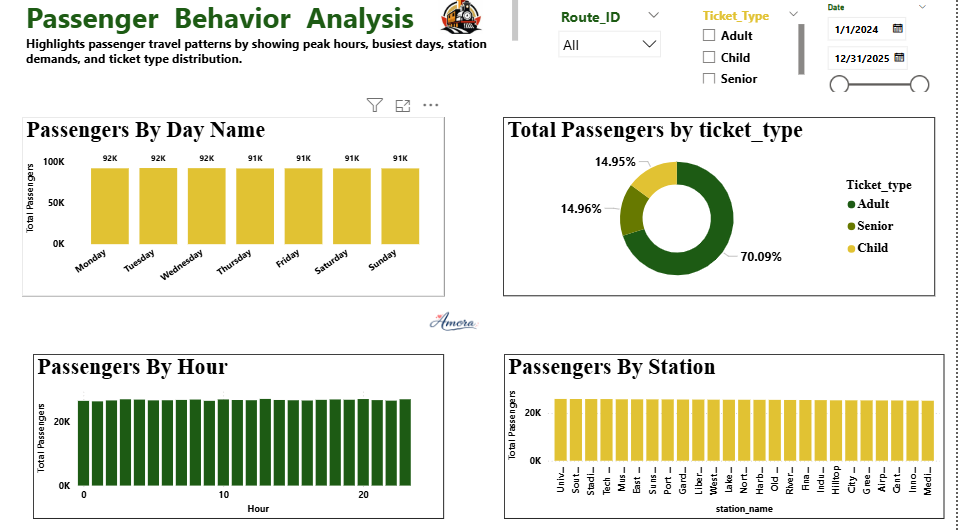
I recently got a railway project that required me to build a dashboard that showed a train company, a detailed analysis of passenger traffic patterns, revenue performance across different train routes/stations, the peak train hours and the best payment method.
Before joining @AnalystPlaybook, i had some problems with power bi. I'm learning gradually and everything is going well. All thanks to @chidirolex for this opportunity 🙏 🙌
As part of the Data Analyst Playbook mentorship with @chidirolex@AnalystPlaybook, I analyzed traffic & revenue data to understand performance.
💡 Insight: Pricing & efficiency matter more than demand.
Full Project documentation: https://t.co/6RxmgYELRb
What really happens behind the scenes of a railway network?
Every day, thousands of passengers move across stations, and schedules. But beneath that movement is data quietly shaping how everything runs.
I worked on a Rail operations Project from @AnalystPlaybook@chidirolex
Just completed a Rail Operations Analytics dashboard analyzing passenger traffic, revenue performance, route performance, and travel behaviour patterns using Power BI.
Thank you for the opportunity, @chidirolex#DataAnalytics#DataVisualization