@bygga_bolag There is always a risk of that if you just randomly try to match periods that look similar. But there is a cycle behind this that I have followed for quite a long time and WD Gann used it already in the early 1900's.
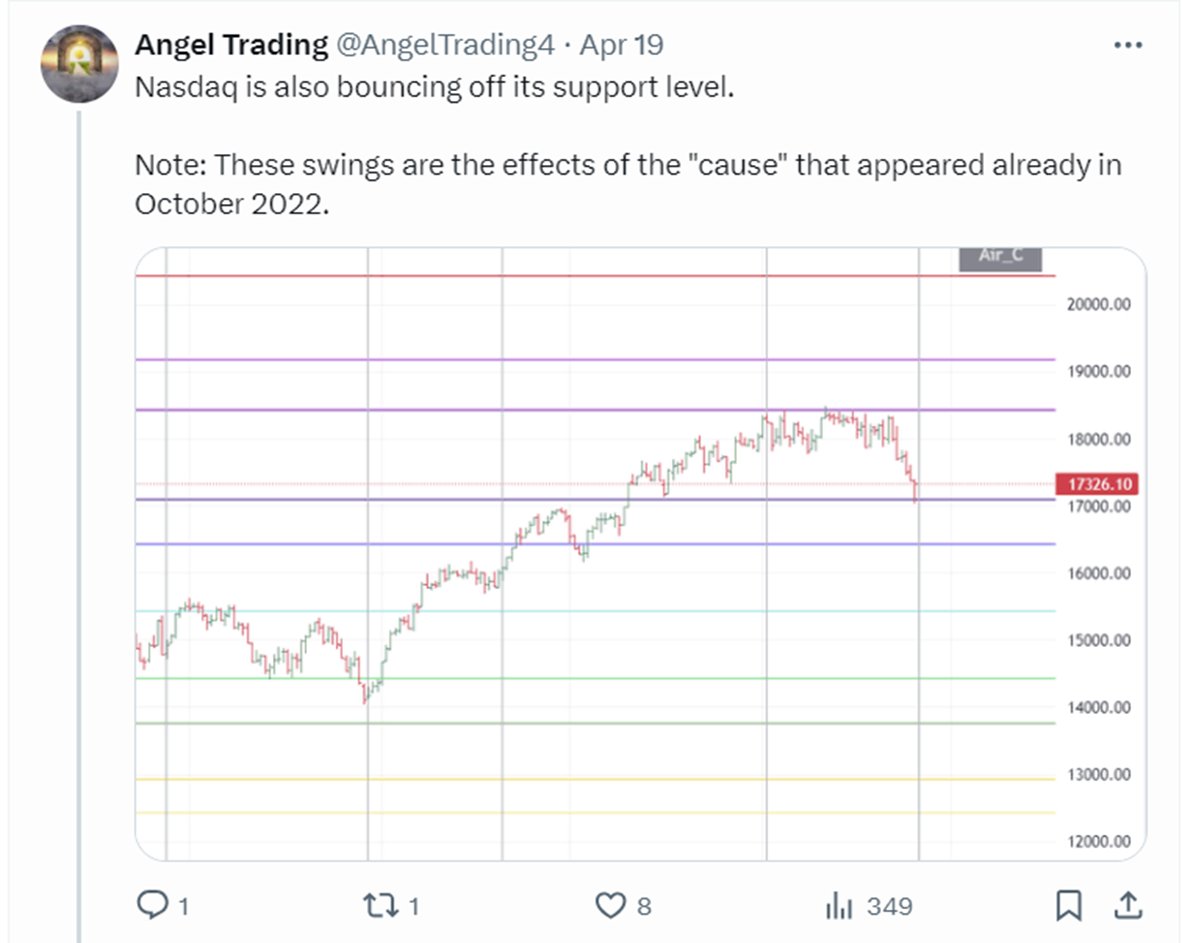
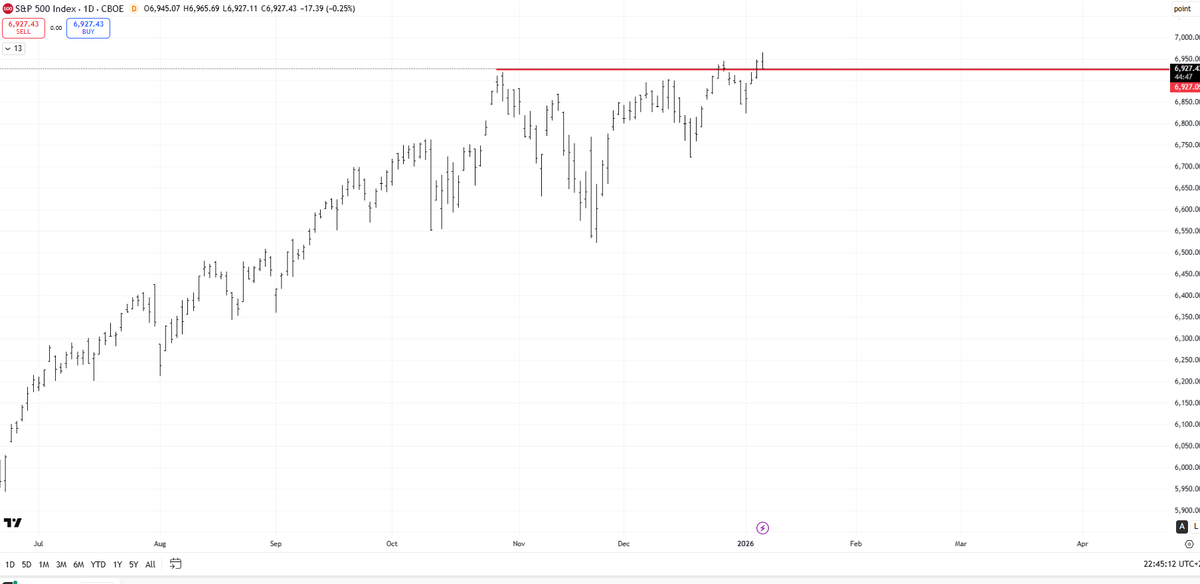
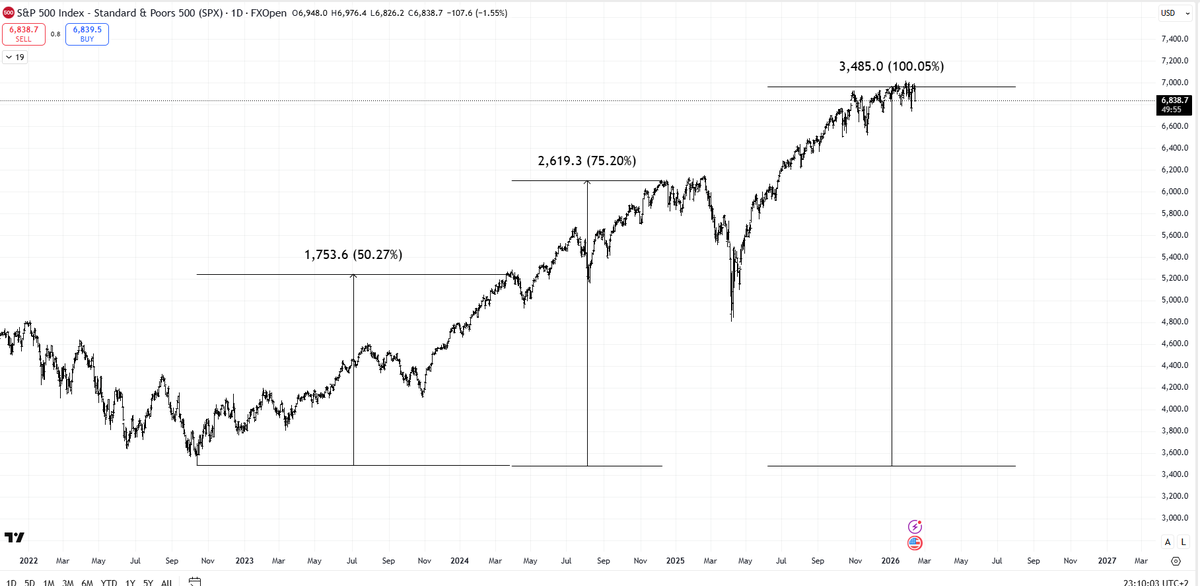
I posted this chart on December 31. We got a correction according to the 20 year pattern. If this pattern holds it means that the current rally is the last one before a prolonged decline.
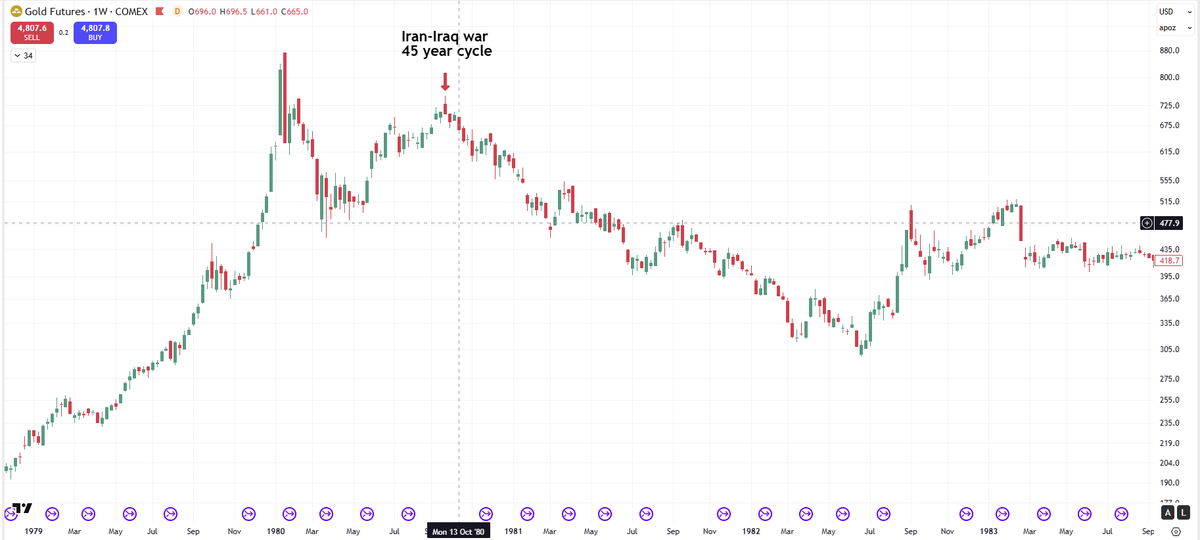
Many investors were surprised when Gold fell at the outbreak of the Iran war. They should not be surprised. Gold started to fall in 1980 (45 year cycle) when the Iran-Iraq war broke out and also went into a bear market when Russia invaded Ukraine. Check history.
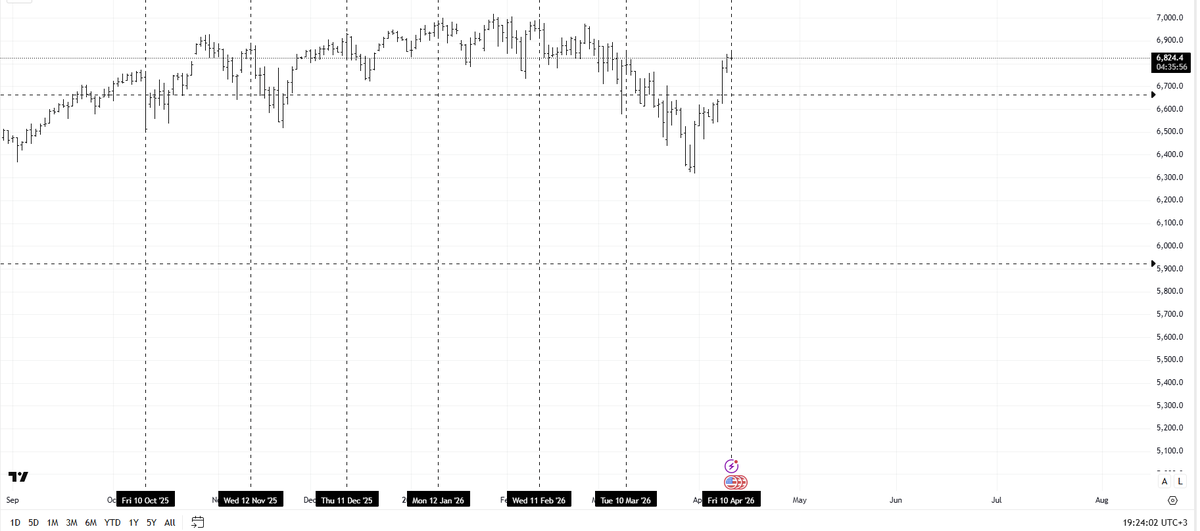
At the end of November I asked you to pay attention to the arrival of the 36 year cycle. So far we have seen a top in the Nikkei, a top in Gold, a top in EUR/USD and a low in oil. This cycle will be energized later this month.
The 36 year cycle is arriving and the effects will soon be felt . Last time this cycle coincided with the crash in Japanese stocks and real estate. The Soviet Union collapsed and the US went through a savings and loan crisis. The financial crisis of 2007 was the cyclical midpoint
@MarkRitchie_II It is a cyclical event. In September 1980 the war between Iran and Iraq broke out. Now we have another war involving Iran. Gann referred to the 45 Year cycle, which it is, more or less.