In my previous thread I showed you a pattern that has played out well so far.
Today I checked for more confluence and added the Paranoia Indicator as well as the standard RSI.
As you can see, there is a similarity to 2023, judging by the RSI and the Paranoia Indicator.
Nothing is guaranteed to repeat, of course, but it is a very interesting perspective.
Check out my previous thread to understand more!
bitcoin:native
In the next few days you’ll see the bears crawling out of their holes.
Now they’re coming out of their holes, flooding X with garbage about $30k Bitcoin and other nonsense.
They’re betting on a black swan because their plans failed.
They kept their followers sidelined and now they’re screaming over a tiny 5% dump.
The cycle top was in July 2025 and the cycle bottom July 2026.
Called it already in May and it played out perfectly.
Thanks for your money, dear bears. 🐻
In the coming weeks, Bitcoin could be around 71–74k, where I will start building my new swing long.
The lowest cluster we can expect is around 67–70k.
In the meantime, I will only scalp.
To not miss anything, join our community server.
https://t.co/6atyr1eq5F
bitcoin:native
As long as the $77,000 level holds, I expect the $80k range to be reached again before a move toward $72,000–$75,000.
If the $77,000 level fails to hold, my first long position will be between $76,200 and $75,300.
If Bitcoin loses the $74,000–$75,000 range, my next major order will be at $72,800, and I will scale in (ladder down) to $67,000.
Dips aren't meant to be ignored, that's the time to take a position.
bitcoin:native
Every time the DSS Bressert crossed up on the 4-day timeframe, a big pump followed.
Bitcoin hit its lowest price in November 2022.
On the 4-day chart it took almost 53 days for the DSS Bressert to make a bullish crossover.
After that Bitcoin pumped hard.
The DSS Bressert is near the capitulation level (the red line).
The bullish crossover started from there.
That is why I show this example.
I already showed in several threads with other indicators that Bitcoin has bottomed.
The current behavior looks a lot like 2019 and 2022.
Here I focus only on the 2022/2023 period.
Even the slightest correction should be taken seriously when it comes to long-term investments.
bitcoin:native
Every time the LMACD Indicator crossed up on the 5-day timeframe, a big pump followed.
When Bitcoin was outside the TEM bands, it took 220 days for the bullish crossover to form.
95 days later, Bitcoin left the red TEM zone and a correction followed before the next pump.
I’ve already shown in several threads with other indicators that Bitcoin has bottomed.
Current behavior looks a lot like 2019 and 2022.
Here I focus only on the 2022/2023 period.
history doesn't repeat itself but it often rhymes
Even the slightest correction should be taken seriously for long-term investments.
bitcoin:native
Dear bears, the bear market is over and the bottom is in.
Back in May I publicly called the bottom for July 1st.
Let me show you a clear video that probably won’t improve your mood.
Stay stubbornly on the sidelines if you want.
Calling $62,200 as the final low. ⌛️
New all time high by 2027. ⌛️
We’re in the early stage of a bull run.🖐️
When the TEM wick printed (marked with the circle), it took 147 days until Bitcoin put in its final low.
In 2022 the price difference between the 147-day and 161-day mark was less than 1%, even with the FTX crash and the lingering corona pandemic effects.
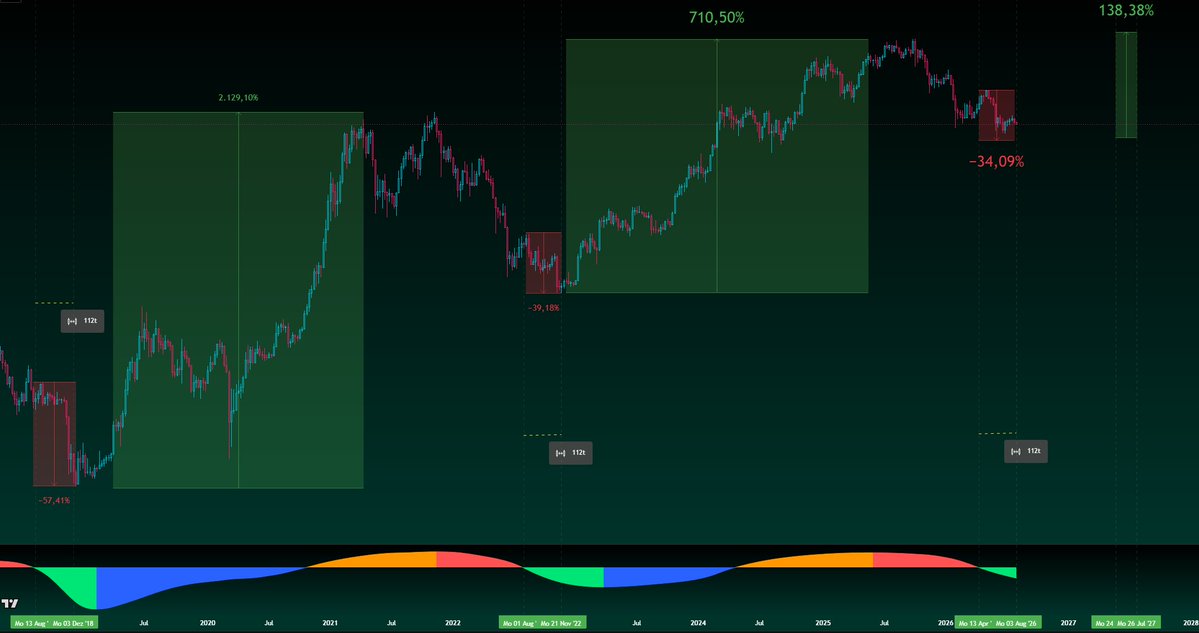
The Bitcoin Journey Map shows that once 112 days had passed, the final bottom was in and that price zone was NEVER touched again.
That means we never see $62,200 again unless a real black swan hits.
That’s now what most of you bears are betting on, because the original plan didn’t work out.
The exact same pattern is playing out right now.
the genius behind these masterpieces is
he deserves every follower, the content he puts out is next-level
@thebtcfrontierX
bitcoin:native
As I said, we will not see any prices lower than $62,200.
You don’t expect anything below that in your thread, that’s why you marked the $63k zone.
Check out my previous thread.
I showed you a clear video.
The Bitcoin Journey Map has a 100% hit rate.
bitcoin:native
In my previous thread I talked about a pattern from 2023.
Comparing it to today, there is a strong similarity.
I closed my swing long position and took over $290,000 in profit.
As I said, I will only take scalp entries at the moment.
The reason I opened a scalp long position is this pattern together with the TEM and Paranoia Indicator, which make it easy for me to scalp long Bitcoin.
You can clearly see that when the black bar hits the green zone, I can scalp long or when Bitcoin touches the blue zone (TEM).
The same behavior happened on the 2H timeframe when Bitcoin reached the blue zone in 2023.
You can see it very clearly at the end of the video.
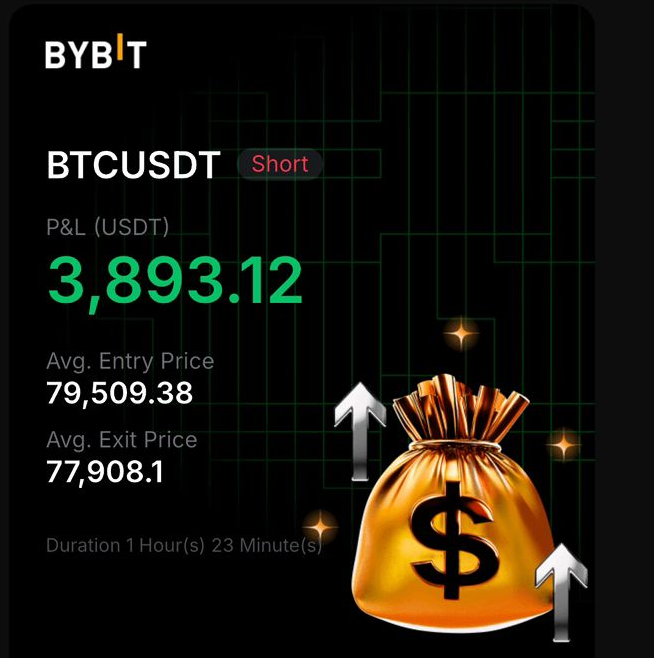
I only shorted from $79.5k to my target in the $77k area and opened a long position from here.
Don’t miss any live trades and join:
https://t.co/6atyr1dSg7
That's why I said:
" If Bitcoin loses the $78,500 level, the next support is at $76,500.
If this pattern repeats, Bitcoin should find support at $76,500 and resume its trend toward the $80k+ level. "
bitcoin:native
In this video, I’m showing you Bitcoin on the Thermo-Dynamic Engine Model (TEM).
You can clearly see that whenever Bitcoin moved into the blue zone on the 1W chart, the bottoming phase began.
On the 10D chart, this is even more obvious!
Historically, Bitcoin has touched this zone one more time before the bullrun started.
At the end of the video, you’ll notice that Bitcoin left the yellow zone only once, during the FTX crash and the COVID pandemic.
expecting first a move toward $69,000, followed by a short correction, and then the next leg up toward $82,000.
coded by
@thebtcfrontierX
bitcoin:native
I decided to update this video for you by showing the timeframes when Bitcoin pumped in 2023 and when it reached its peak price.
Bitcoin is currently behaving in exactly the same way. The pattern is very similar and has repeated itself perfectly so far.
If the rest of the pattern plays out, prices between $83,300 and $91,000 can be expected.
If the timeframe repeats, it could happen in mid-September.
Nothing is guaranteed to repeat, of course, but it is a very interesting perspective.
Check out my previous thread to understand more!
First part (around January 2023)
Strong upside breakout with a gain of +23.32%.
This was followed by a correction of about –5.24% into the red TEM zone.
The last wick that clearly sat outside or at the edge of the red TEM band appeared after roughly two days. After that the price consolidated inside the TEM bands and continued the uptrend.
Final support on the 4H timeframe was found at the Ichimoku Cycle Engine / yellow TEM band.
Second part (current chart, August 2026)
Strong upside breakout with a gain of +23.58%.
This was followed by a correction of about –4-5% into the red TEM zone.
The last wick that clearly sat outside of the red TEM band appeared after roughly two days.
After that the price consolidated inside the TEM bands and continued the uptrend.
bitcoin:native
If Bitcoin loses the $78,500 level, the next support is at $76,500.
If this pattern repeats, Bitcoin should find support at $76,500 and resume its trend toward the $80k+ level.
First part (around January 2023)
Strong upside breakout with a gain of +23.32%.
This was followed by a correction of about –5.24% into the red TEM zone.
The last wick that clearly sat outside or at the edge of the red TEM band appeared after roughly two days.
After that the price consolidated inside the TEM bands and continued the uptrend.
Final support on the 4H timeframe was found at the Ichimoku Cycle Engine / yellow TEM band.
Second part (current chart, August 2026)
strong upside breakout with a gain of +23.58%.
This was followed by a correction of about –4-5% into the red TEM zone.
The last wick that clearly sat outside of the red TEM band appeared after roughly two days.
After that the price consolidated inside the TEM bands and continued the uptrend.
However, this does not mean the pattern is guaranteed to repeat.
bitcoin:native
5 days later, 300k later
everyone is talking about 80+ now
I told you at the perfect time, we pump to 69 and go straight to 80+
How are you doing, dear bears?
Sidelined because your favorite guru told you we’d see 30k?
When I post something, be sure I’m trading it.
I only post what I’m trading.
I trade the market I see, not the market I wish.
Thanks for playing 🎯
bitcoin:native
According to this outstanding setup, we could see the final bottom anytime between 3.8.2026 and a one-week delay.
My analysis claims that 112 days after we turned from red to green on the Bitcoin Journey Map, the absolute cycle bottom was formed.
This has happened in every cycle.
The bear journey is over soon.
We are about to see a bull run that will melt faces.
Many people will get front-run while they wait for sub $40k!
I’m not ruling out that it could happen, but a drop below $40k would need something similar to the COVID & FTX crash.
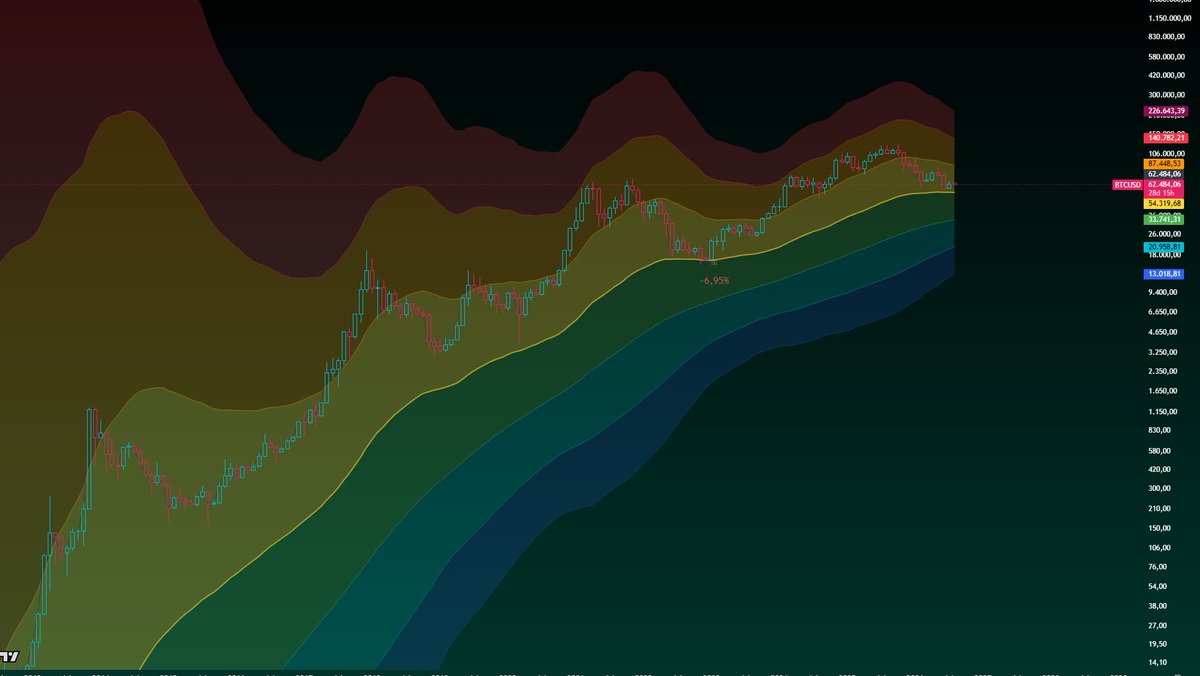
Check out the second picture!
“In the entire history of Bitcoin, the price has fallen below the yellow zone only once, and that was due to a historic event, the coronavirus pandemic & FTX crash.”
See you in 2027, when we hit a new all-time high.
I am starting a second giveaway!
As soon as I reach 20,000 followers, I will give away $250 to 10 different people.
To enter, you need to comment, like, and share this post, and Grok will select the winners!
The second giveaway ends on September 1, 2026.
FINAL COUNTDOWN FOR THE FIRST GIVEAWAY !
In 2 hours and 30 minutes the giveaway ends !
" Thank you for the incredible support, i didn't expect such strong support.
As I said, once I reach 1,000 followers, I’ll open an educational channel where I’ll take a closer look at other coins and answer your questions.
I originally planned a $250 giveaway, but I’m increasing it to $1,000 total, 5 winners will each receive $200. "
EDUCATION ONLY, NFA!
Welcome to XAPA's World!
https://t.co/dKGcrg8vw2
Thank you for the incredible support, i didn't expect such strong support.
As I said, once I reach 1,000 followers, I’ll open an educational channel where I’ll take a closer look at other coins and answer your questions.
You’ll also be able to watch live as I enter trades and explain the reasoning behind them.
I originally planned a $250 giveaway, but I’m increasing it to $1,000 total, 5 winners will each receive $200.
To enter the giveaway, just comment, like and repost this thread.
Grok will select the winners within the next 3 days.
There are people currently faking my name and sending Telegram links, that’s not me.
I hurried and finished the Discord server, it will be improved over time.
EDUCATION ONLY, NFA!
Welcome to XAPA's World!
https://t.co/dKGcrg8vw2
bitcoin:native