$BTC How to Spot Trapped Traders with Speed and Precision 🎯
To identify trapped traders accurately, we can use a powerful combination: the Delta Profile overlaid with Open Interest (OI) Created vs. Removed.
Let’s break down exactly how this works using a recent session Point of Control (POC) as an example 👇
1. The Context (Volume Profile)
Looking at the standard Volume Profile and candlesticks on the left, we can identify a High Volume Node (HVN/POC) neer the current lows, where price was ultimately rejected. However, traditional volume alone doesn't tell us whether buyers or sellers dominated the auction at that specific level.
2. The Aggression (Bid/Ask Profile)
To see who is initiating the trades, we look at the Bid x Ask Profile on the right. This splits the traded volume into aggressive selling (red) and aggressive buying (blue). A spike on the aggressive sell side tells us the HVN was created by market sellers dumping into the bids. Because price didn't drop further, we instantly know a passive buyer is absorbing the selling pressure.
3. The Intent (Delta Profile + Open Interest)
At this stage, we know there is aggressive selling, but we don't know if it's new shorts opening or existing longs closing. This distinction is critical: closing longs are simply exiting the market, but fresh shorts represent new capital that will eventually have to buy back to cover if they are wrong. To find out, we look at the Footprint chart:
- Delta Profile: Visualizes the net difference between Bid and Ask. A large negative (red) delta confirms market sellers dominated.
- Open Interest (OI) Text: Measures contracts closed vs. opened.
By overlaying OI text onto the Delta Profile, the full picture emerges. At the HVN we see a high negative delta paired with 9.5M new contracts opened.
Now have concrete proof: these aren't just exiting longs, these are fresh shorts getting trapped. They sold aggressively at the lows, got absorbed by passive buyers, and were not rewarded with lower prices.
When the market pushes these trapped shorts offside, they are forced to close their losing positions by buying at the market. This creates a highly predictable cascade of buying pressure that you can trade alongside.
Chart by @ExochartsC
Since I rarely talk about this side of trading, I want to add:
#Bitcoin bear markets aren’t for panic!
They’re where you make the money to accumulate more Bitcoin near the lows. And it’s exactly during those times, when your spot portfolio keeps "losing value", that precise trading execution becomes even more important.
🔸 My only goal: Outperform Bitcoin.
🔸 My only job: Stay disciplined, manage risk and execute based on structure, volume, and OrderFlow. Simply trade the chart. No narrative.
As a general approach, once the trading account reaches a certain size compared to my spot Bitcoin, I don’t keep scaling risk. I take capital off the table, move it aside or into spot Bitcoin, and start rebuilding a new account from the start. This keeps stress low and allows me to focus on execution and consistency.
At the end of the day, we’re all human. When the numbers go up, it can change how we approach risk. That’s why regularly resetting the account, instead of trying to shoot for the stars, is the best approach for me personally.
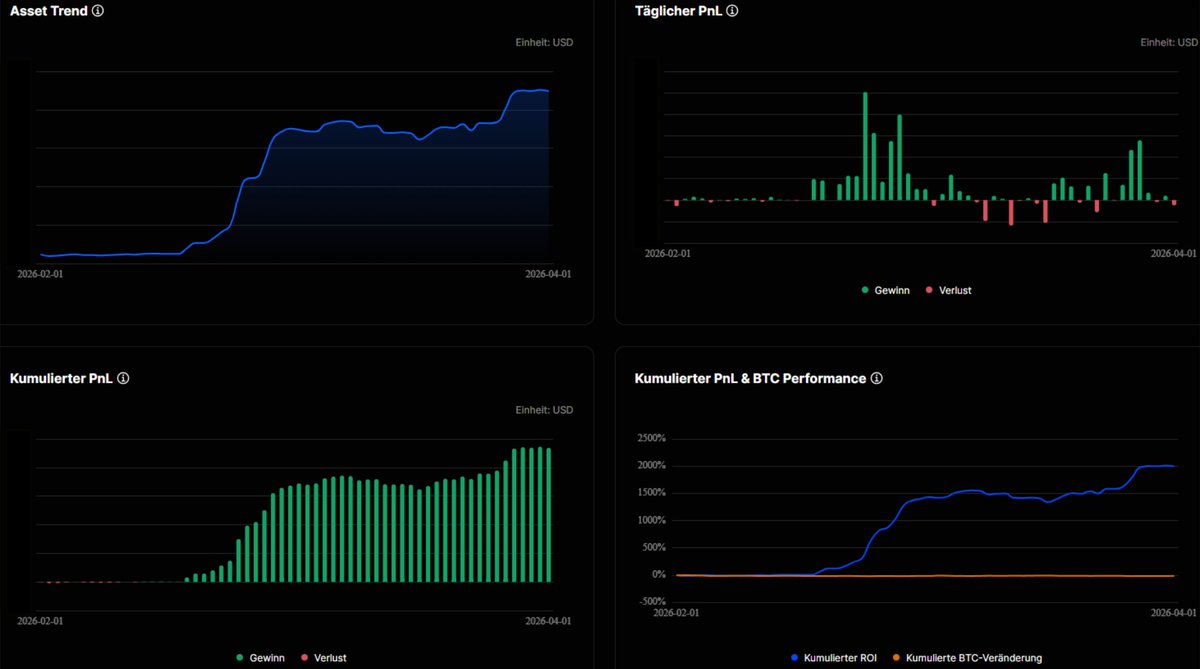
I’m not bragging here! I’m just providing some receipts, and another perspective on trading beyond pure execution.
Trading is not only entries and exits.
It’s also capital management, psychology, and knowing when to take risk off the table with a clear plan in mind!
I want to stress one thing: These are not long-term sustainable trading returns. It was simply a VERY clean bear-market environment for my style of trading, and I was able to ride the move all the way down toward 60K. I’ve shared my setups here over and over again, based on structure, volume, and OrderFlow. While many were still following narratives and expecting new ATHs, I was confidently calling for poor lows to be swept.
All of this was publicly posted, with educational content along the way, completely free of charge. Because we don’t need to sell a course to make money, when we make money trading.
We simply trade the chart! 🫡
https://t.co/loW5O3zbr5
I’m not a trader. I’m an investor.
I’ve spent years doing my research, and today #Bitcoin is one of my largest portfolio allocations. I understand the risks involved, but I also understand its potential.
That’s why I keep adding spot Bitcoin to my wallet whenever I can, and I don’t sell.
At the same time, Bitcoin is a high-volatility asset. Those swings create opportunities in both directions. I want to participate not only when Bitcoin goes up, but also manage and benefit from the downside moves along the way.
That’s what led me to trading.
But I only trade Bitcoin - I’ve never seen a professional athlete play pro basketball and pro football at the same time. Mastery requires focus. For me, that focus is Bitcoin. And I only trade with a small, clearly separated portion of my total Bitcoin holdings.
The goal is simple: Outperform Bitcoin, so I can accumulate more Bitcoin. It doesn’t matter if Bitcoin goes up or down. We trade just the chart with OrderFlow precision and aim to make money on both sides.
The spot stack stays untouched.
The trading account is there to sharpen execution, manage risk, and create more BTC over time.
That's how I approach the markets...
Most of you would be way more profitable if you just watched the 1D & 1W charts.
Less stress, less risk, & bigger moves.
You don’t need to take 1,000 trades to “make it”. $BTC has 10-15 big moves a year and if you catch half of them you’re out performing 99% of traders.
Want to take better trades and avoid the bad ones?👀
(Don't miss this!)
Let’s talk about how to use OrderFlow as trade confirmation at key levels; 👇
When price reaches a key support or resistance level, most traders already have a bias. OrderFlow shifts your focus away from prediction or hope and toward real-time validation.
Instead of assuming your level will hold, you observe what participants are actually doing the moment price interacts with it. Are aggressive traders able to push price through? Or are they being absorbed?
1) At resistance:
✅ We take the short if…
Aggressive buyers step in (market buys), but price doesn’t push higher → clear absorption by passive sellers (effort ≠ result).
Wait for sellers to respond and trap those longs.
When they exit, their market sells fuel the move down.
→ OrderFlow shows: rising CVD + rising OI while price stalls = bearish absorption
❌ We avoid the short if…
Aggressive sellers pile in at resistance, but price keeps grinding higher or holds strong.
Those shorts are getting absorbed by passive buyers → building fuel for continuation to the upside.
→ OrderFlow shows: falling CVD + rising OI while while price holds below resistance = bullish absorption
2) At support:
✅ We take the long if…
Aggressive sellers step in (market sells), but price doesn’t push lower → clear absorption by passive buyers (effort ≠ result).
Wait for buyers to respond and trap those shorts.
When they exit, their market buys fuel the move up.
→ OrderFlow shows: falling CVD + rising OI while price holds the level = bullish absorption
❌ We avoid the long if…
Aggressive buyers step in at support, but price keeps moving lower or fails to bounce.
Those longs are getting absorbed by passive sellers → building fuel for continuation to the downside.
→ OrderFlow shows: rising CVD + rising OI while price holds weak at support = bearish absorption.
The key principle: effort vs. result.
We don’t need to predict new buyers or sellers entering the market. We focus on what’s already happened -> traders stuck in losing positions 👀
Their exits are predictable market orders we can anticipate, and those market orders often drive the next move.
Using OrderFlow helps you take higher-quality trades at your key levels, and avoid the bad ones.
But always remember; profitability comes from discipline and risk management! Not from better entries.
There’s about 10-15 big moves in the market (20%+) per year on $BTC.
This means most of the time the market does nothing or moves sideways & this is where new traders lose lots of money.
Calculated patience can pay super well in this market. You don’t need to day trade.
(2/2) Possible solution 👇
Like we discussed above, the real problem isn’t risk management. It’s not skill either.
It’s capital. So?
@breakoutprop funds disciplined traders with up to $200K in trading capital, if you can prove you have a real edge and follow clear risk rules.
Instead of trying to grow a $1,000 account and feeling forced to oversize, you can allocate that capital toward an evaluation. For example, rather than trading the $1,000 yourself, you might use ~$750 to be evaluated on a $100,000 account.
If you pass, you get funded and keep up to 90% of the profits.
Now 2–4% per month isn’t $30.
It’s $2,000–$4,000.
Your risk remains controlled.
Your maximum downside is the evaluation fee, at all times!
And your edge finally works on meaningful size.
You’re able trading professionally, controlled risk, consistent execution, but now the results actually count!
Breakout is the only prop firm I personally use. Fast, on-demand payouts, a clean track record, and backed by Kraken.
I truly think this is a tool that can make all the difference.
If you’re ready to give this a go, use code “JDK” for the maximum discount when purchasing your evaluation.
🔗 https://t.co/4TL2fFW7Sa
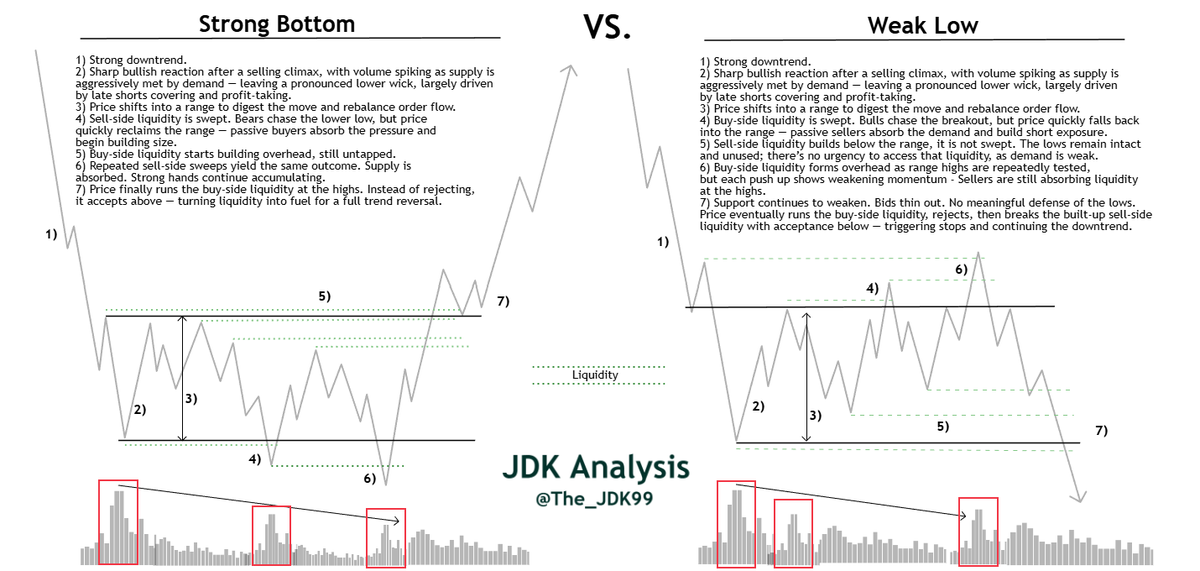
Strong Bottom vs. Weak Low 🥊
What’s the difference?
How do you spot it in real time? (See posts 2 & 3)
A lot to learn here! 👇
(If this kind of content adds value to you, I’d appreciate your feedback, leave a like and I’ll share more insights like this)
1/3 $BTC #Bitcoin
$BTC Important Update ⚠️
Here’s everything that matters right now, and what would flip me very bullish again👇
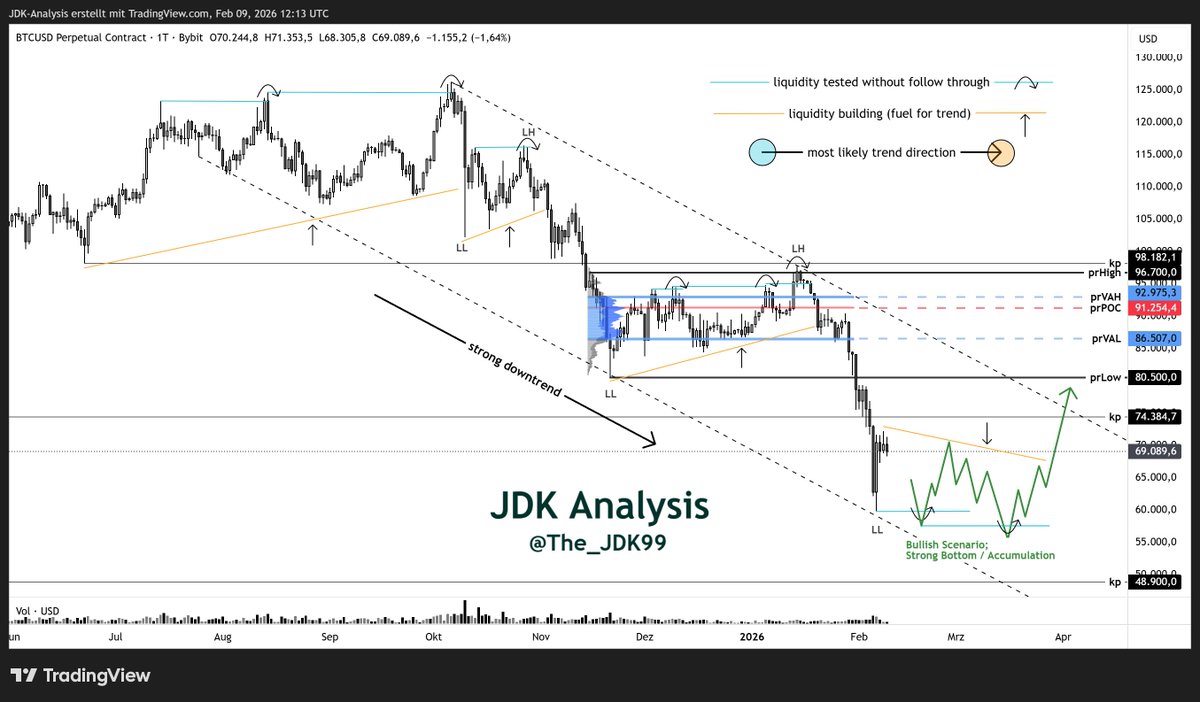
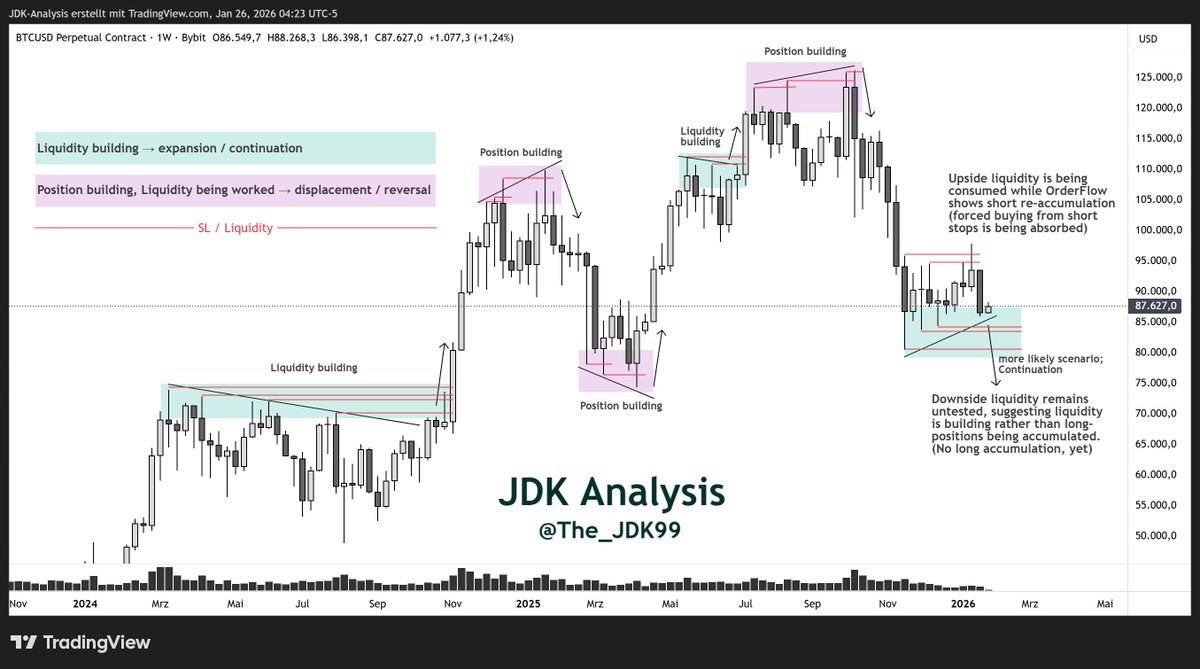
Current state: Price is in a clear HTF downtrend, and major reversals don’t happen without a strong bottom forming first.
So what’s the bullish scenario?
We test liquidity below the current low and fail to continue, followed by a swift reclaim back into the range. That would signal absorption: passive buyers using downside liquidity, absorb sellers and build long exposure at size. Repeated sweeps can occur during accumulation, with fresh liquidity forming below each low - liquidity that can later be accessed and absorbed to build further size. That's a strong bottom.
If instead liquidity builds at the lows, remains untested until a sweep leads to continuation (no one willing to use/absorb the available liquidity), that’s not accumulation and there’s no reason to flip bullish.
Important: I’m not predicting an accumulation or continuation. I’m saying we need to wait and my HTF bias only shifts bullish after downside liquidity is taken/used without follow-through → Accumulation → major HTF trend reversal likely.
Until then: Shorts stay open. HTF bias remains lower.
A LTF bounce into 80K–86K is possible, but a full trend reversal is highly unlikely without a proper bottom formation first.
👉Conclusion: There’s no reason to play HTF swing longs right now or expect a major trend reversal. We need to wait! Also "higher lows" on a HTF-Range, where liquidity builds but isn’t accessed and used to build long exposure, are not bullish in this context but indicate trend continuation.
(That’s not my opinion. That’s simply how this game works.)
(NFA!) #Bitcoin #BTC
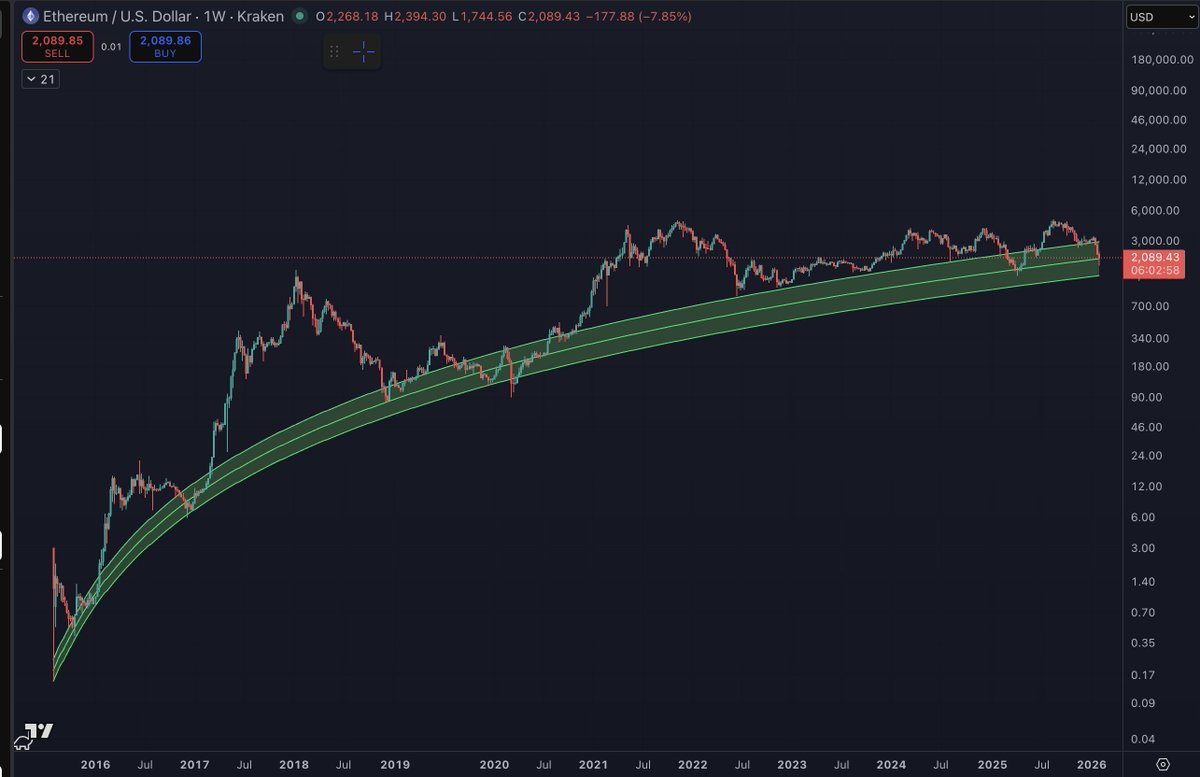
Welcome Back Home, Ethereum.
This time, I guess it stays a while, goes down to the basement to get a snack later this year, and then the next bull market begins
Could it be more obvious? 🤔
Ask yourself:
Has price spent enough time at the lows, and has sufficient downside liquidity been worked for large participants to meaningfully accumulate longs and drive a full reversal?
Or are we instead seeing downside liquidity build while upside liquidity is actively worked, with large players absorbing stop-driven buying and re-establishing short exposure?
Without downside liquidity extraction, the market lacks the conditions for a full trend reversal;
Large participants require sell-side liquidity, primarily stops and forced exits below price, to accumulate long positions at scale. As long as this liquidity remains untouched, supply has not been exhausted and no absorption regime can form. Instead of position building, current price action reflects liquidity building, which favors continuation over a structural reversal.
As a bull, you want to see downside liquidity taken and absorbed, followed by a swift reclaim of the range, a sequence consistent with classical accumulation behavior (e.g., Wyckoff-style accumulation).
Forced selling pressure should fail to produce continuation, price snaps back into the range, with Long-Accumulation in the OrderFlow.
Without this sequence, the bullish case remains incomplete.
⚠️ For now, the current low does not exhibit the characteristics of a strong bottom. This is simply a low waiting to be tested. What follows then will determine the outcome: either selling pressure is absorbed with price reclaiming the trading range/the low or continuation unfolds.
That’s where institutional traders reveal their hand to us.🃏
For me, that means sitting on my hands for now. Shorts initiated from higher levels remain fully open, as I wait for the market’s reaction when price tests the current low around $80K.
(NFA!) $BTC #Bitcoin #BTC
$BTC Target Achieved✅
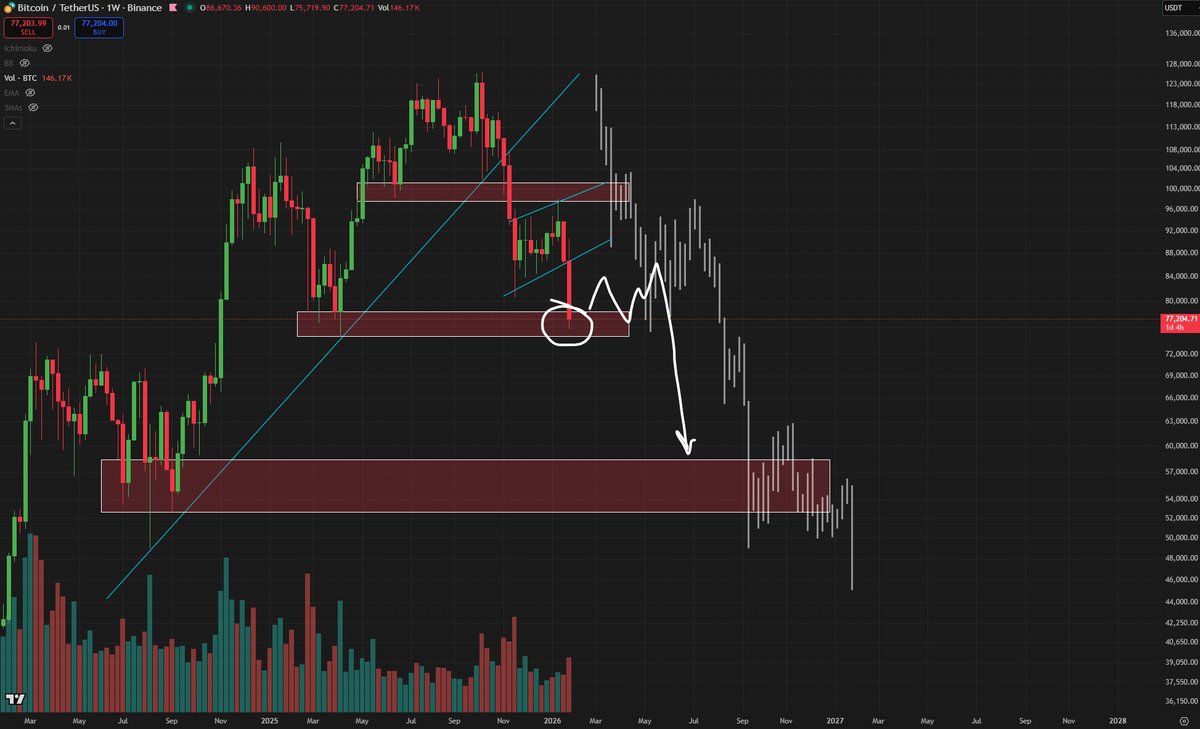
76k was reached just as predicted.
1. We may now see a slow down/bleed sideways for a few months
2. There's a chance we see some capitulation and straight dump to 60k.
Either way, I'm still targeting 50k for spot buys in the coming months.
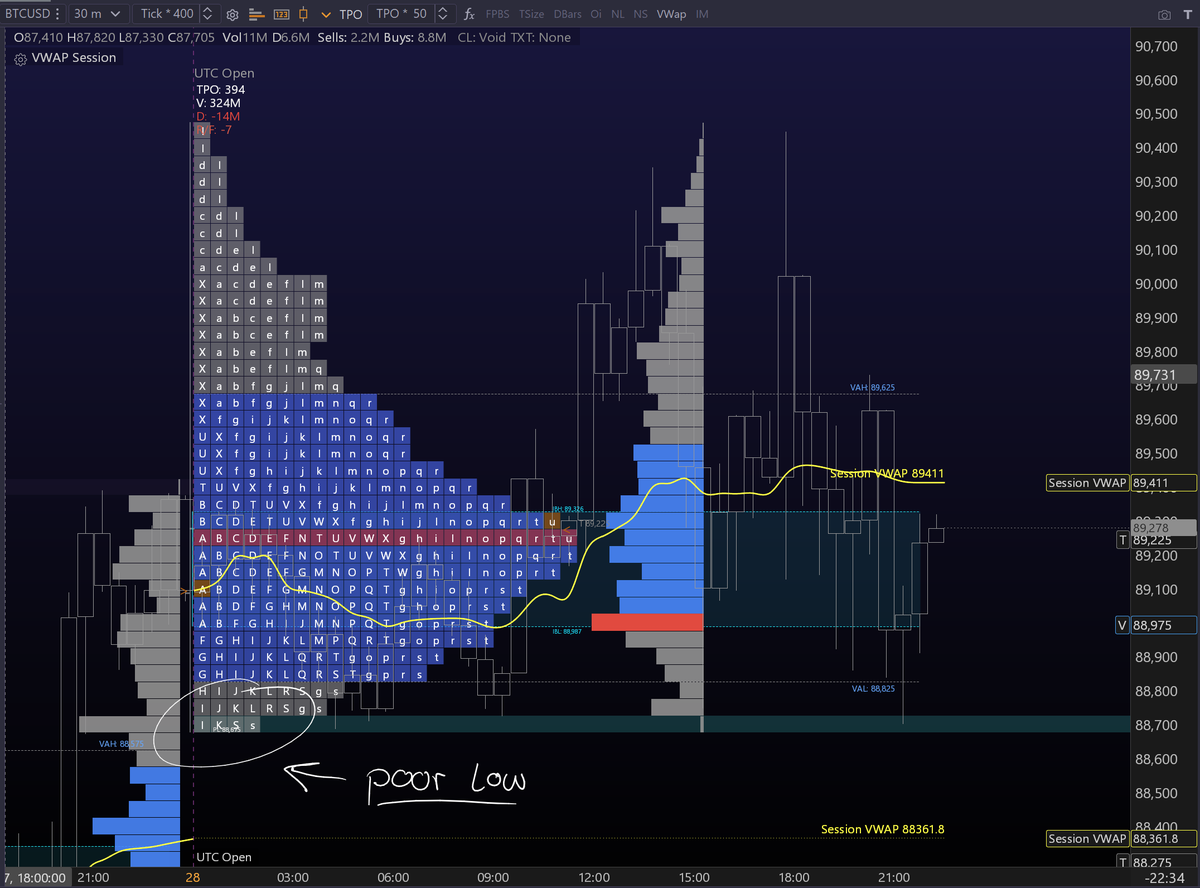
What are poor highs/ poor lows? 🤔
Poor highs and poor lows form when the auction fails to end properly 👇
In Market Profile, this happens when price spends more than one 30-minute time period at the extreme, instead of being sharply rejected.
A healthy auction ends with excess; price pushes into new territory, finds opposition, and is quickly rejected. That rejection shows conviction and tells us one side finished the job.
When multiple time periods print at the high or low, there is no excess. Price is accepted instead of rejected. This means the move was driven by weak participation, with neither buyers nor sellers showing real initiative.
Because the auction didn’t complete, the market leaves "unfinished business". Liquidity above a poor high or below a poor low is not fully tested, and stronger participants have not yet stepped in. As a result, these levels represent weak structure!
Markets dislike weak structure. Over time, they often revisit poor highs and lows to "clean them up" 🧹
Either through a fast liquidation or by finally printing proper excess.
Poor highs and lows don’t predict direction, but they highlight areas of vulnerability. If price returns, the move is often faster and more decisive than the grind that created them.
$BTC #Bitcoin #BTC