Our very own @ArdiNSC with the first Apollo Trading Education Livestream on X 🎓
Breaking down the markets, trading concepts and the thinking behind the setups.
Go check it out 👇
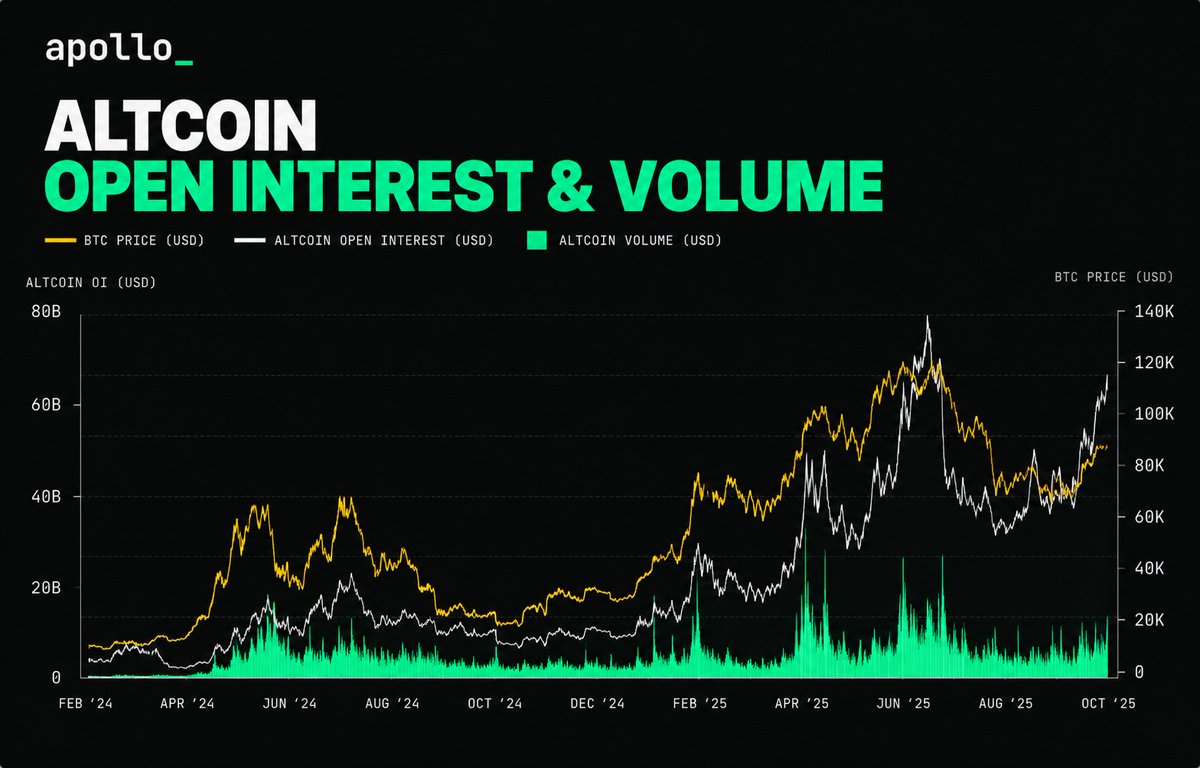
ALTCOIN LEVERAGE IS REACHING EXTREME LEVELS 👀
Altcoin Open Interest has surged back above $60B, approaching levels last seen when Bitcoin was trading near ATH's.
But BTC is currently only around $86K.
There is no doubt, the altcoin market is increasingly leveraged and vulnerable to large drawdowns if $BTC was to go through a significant correction in Q4.
More leverage = more fuel in both directions.
MONDAY MARKET NEWS 🗞️
🇺🇸 FOMC MINUTES — WEDNESDAY, 2PM ET
The minutes will give a deeper look into the Fed’s thinking at its latest meeting, with markets watching for info around:
→ The path for interest rates
→ The Fed’s inflation outlook
→ Labour market concerns
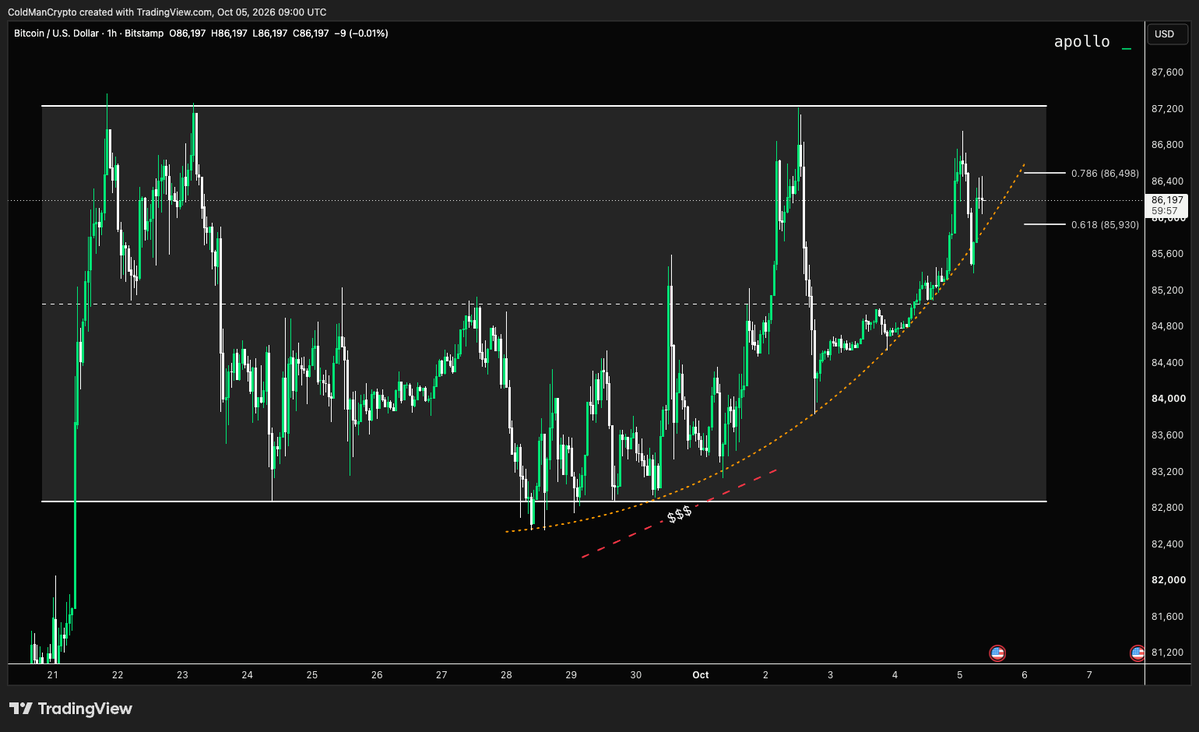
$BTC remains stuck between $82K–$87K.
Since the lows around $82K, price has maintained an uptrend with higher lows defended each time. As long as that structure holds, another push towards $87K remains in play.
Reclaim $87K and that opens the door to the $90k's.
However, significant liquidity remains around $82K. Another rejection from the range highs could open the door to a sweep of those lows.
Sometimes it’s better to react to price rather than predict it:
Long the breakout.
Short the rejection.
Simple.
$BTC has pushed back above $85K over the weekend, but the order flow doesn't add up.
The rally has been accompanied by increasing leverage, while aggressive spot demand has failed to support the move.
Now look at the liquidation map. A significant pool of liquidity has built below price around $82–83.5K.
This doesn't guarantee a move lower, but with spot demand weakening and leverage driving the move, that liquidity below becomes increasingly important.
$BTC bulls want to see spot demand step in, otheriwse next week likely sees a clear of the liquidity below.
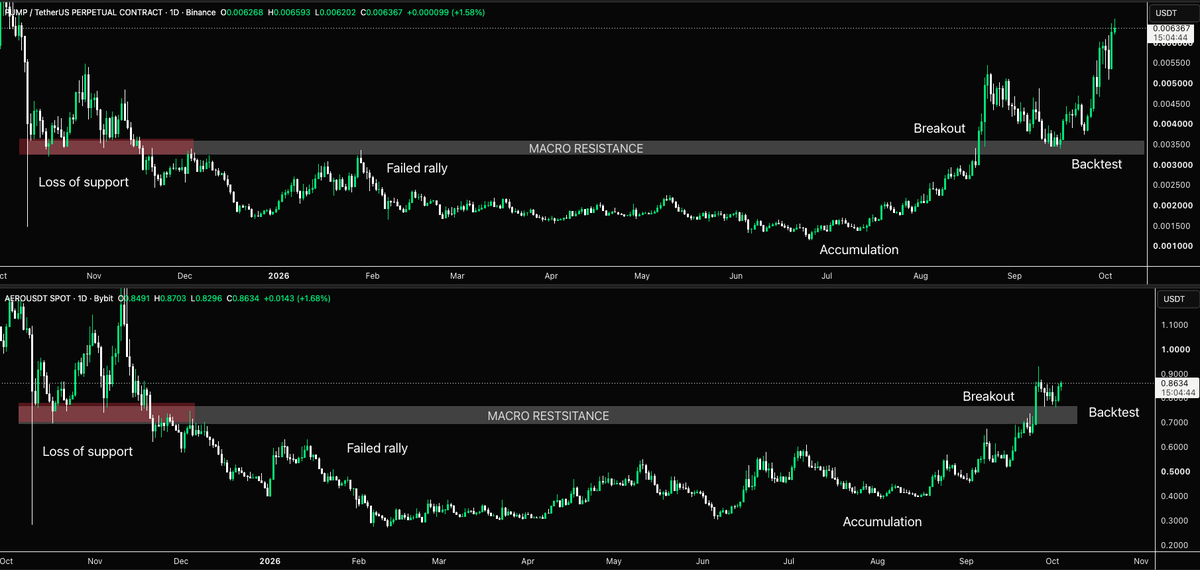
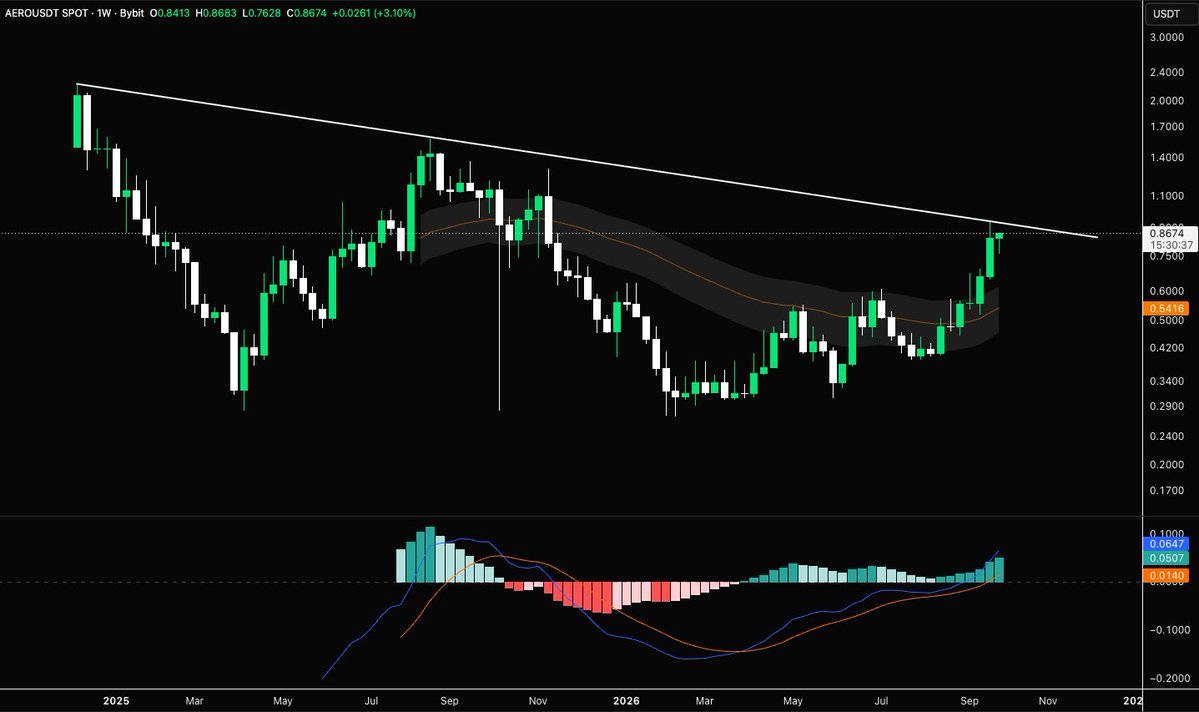
$AERO APPROACHING A MACRO BREAKOUT 👀
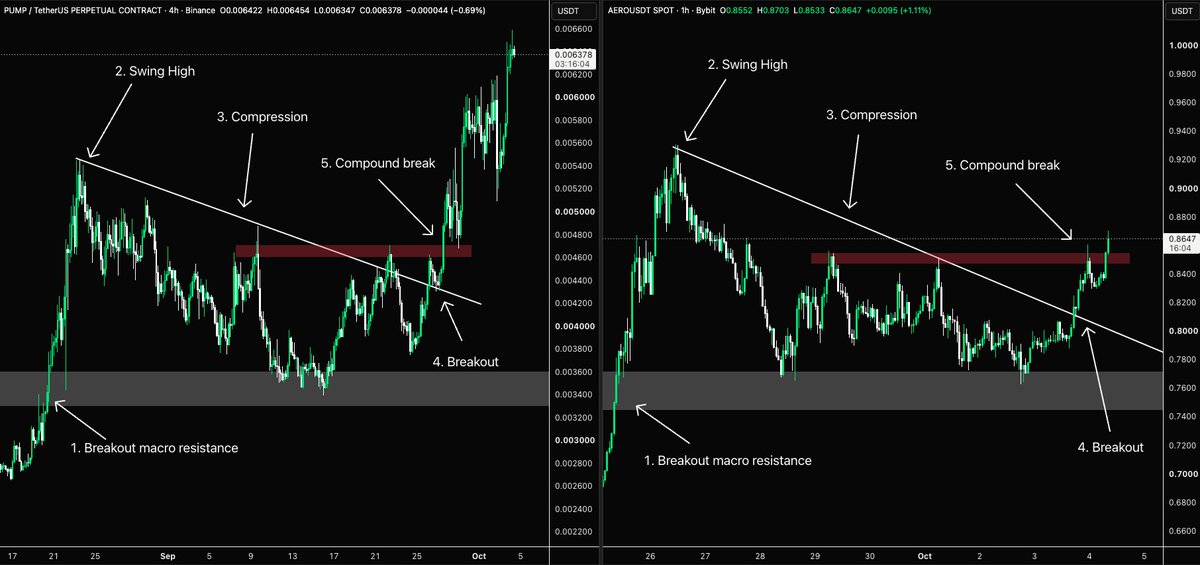
$AERO is now testing the macro downtrend that has capped price since the 2024 highs. MACD gaining momentum, whilst price compresses in to resistance on the lower time frames.
And the timing is interesting...
Aerodrome is preparing to merge with Velodrome to become Aero, a unified liquidity layer for Ethereum.
Technicals & fundamentals aligning 🤝 makes $AERO one to watch.
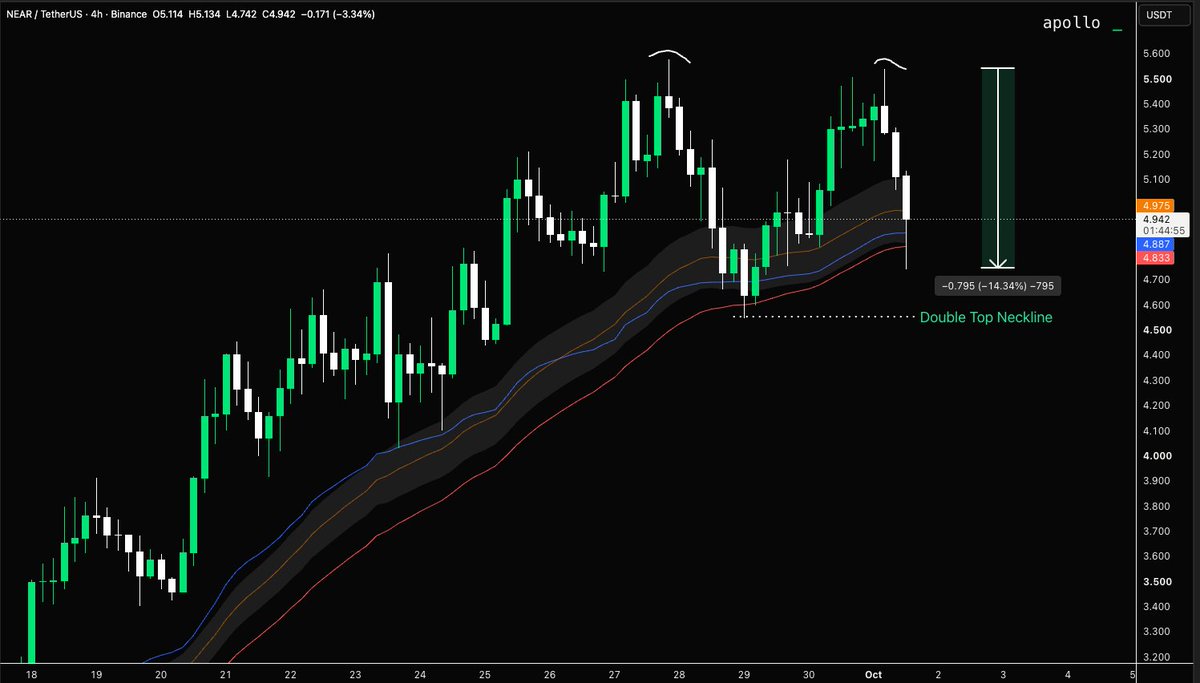
Bulls are protecting the Double Bottom neckline on $NEAR... for now 👀
Any rally that fails to reclaim $5.58 would print a lower high, putting near:native at risk of a broader shift in market structure.
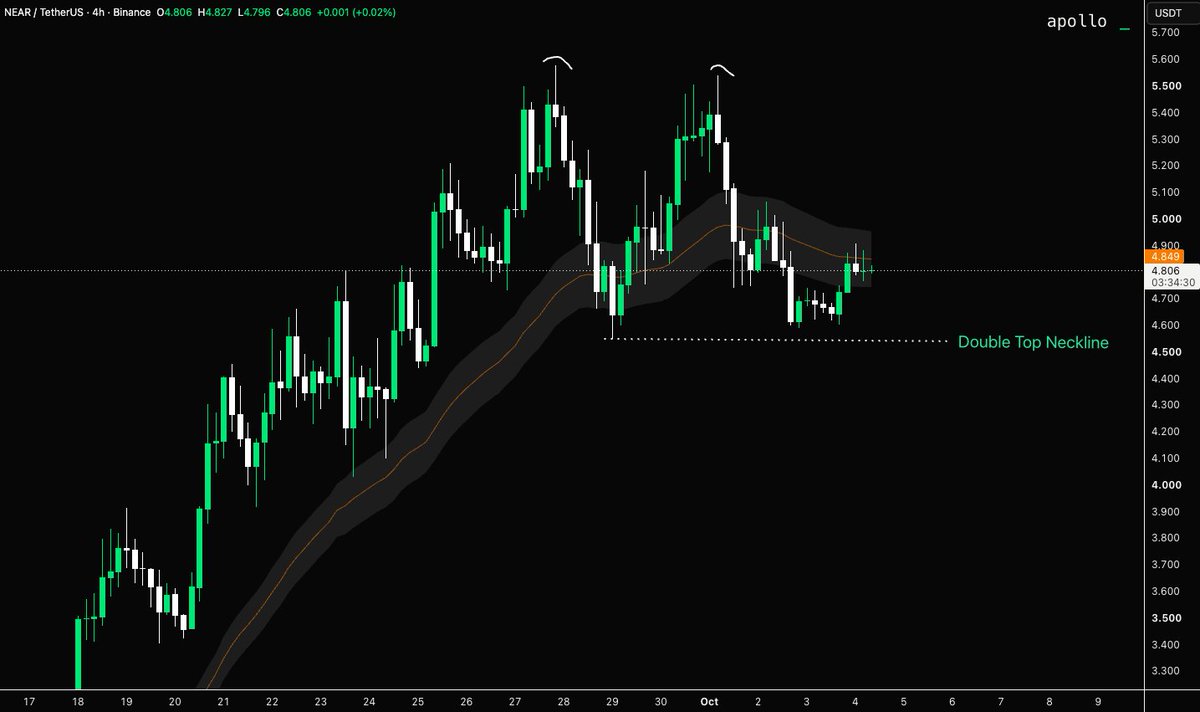
$NEAR AT RISK OF A DOUBLE TOP ⚠️
$NEAR dropped sharply following reports of an exploit involving NEAR hot wallets, with $3.8M reportedly stolen.
The news triggered a 15% sell-off, leaving price at risk of forming a double top.
The neckline is now the key level.
A confirmed loss of the neckline would complete the double-top structure and increase the risk of a deeper correction.
Going live on X this Monday, October 5, at 10 AM ET.
I'll be covering BTC, ETH, ZEC, ASTER and the broader altcoin market.
Bring your charts and questions. See you Monday.
https://t.co/MXLRgHJyP1
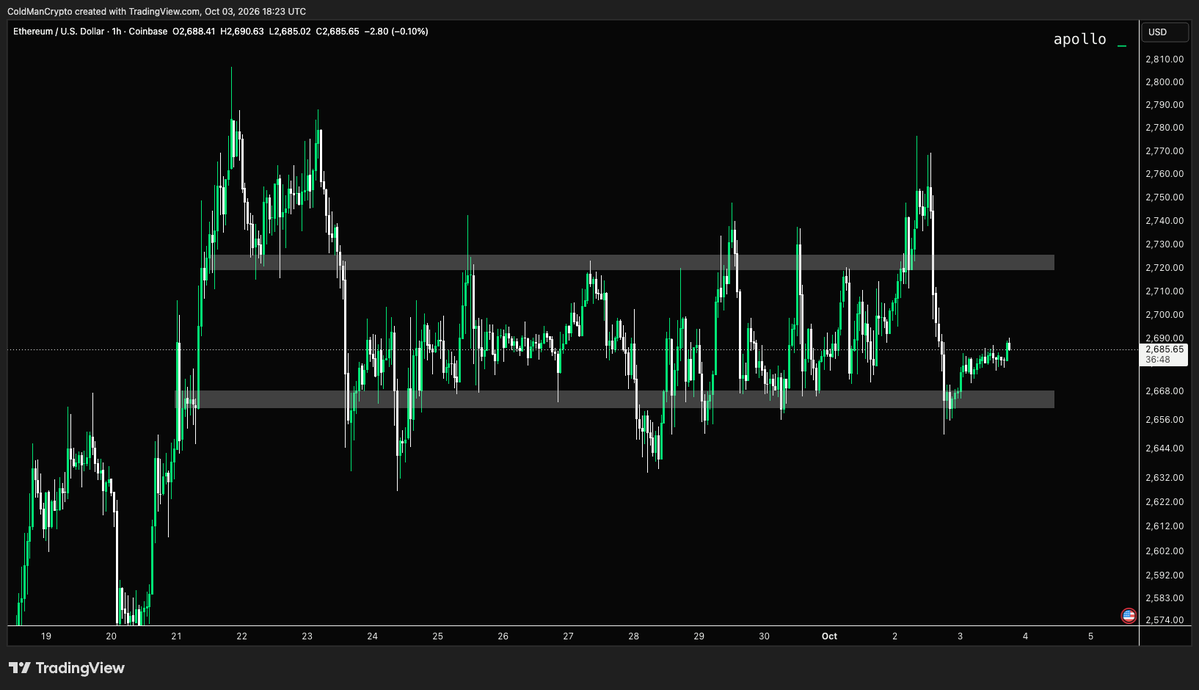
$ETH proving why no position is sometimes the best position.
Every breakout or breakdown attempt during the past 2 weeks has resulted with a sharp rejection.
Ranges are difficult to trade by design. They bait traders into chasing moves at the extremes, only to rotate back in the opposite direction.
Yesterday, $BTC pushed into the $87K highs, while Open Interest also made new highs.
But Spot CVD was doing the opposite, and printing clear lower highs.
→ Price ↑
→ Open Interest ↑
→ Spot CVD ↓
Price was being driven higher alongside increasing leverage, while aggressive spot buying failed to confirm the move.
Shortly after, OI unwound which caused the large cascade.
A good example of why looking beyond price alone can give important context on the strength of a move.
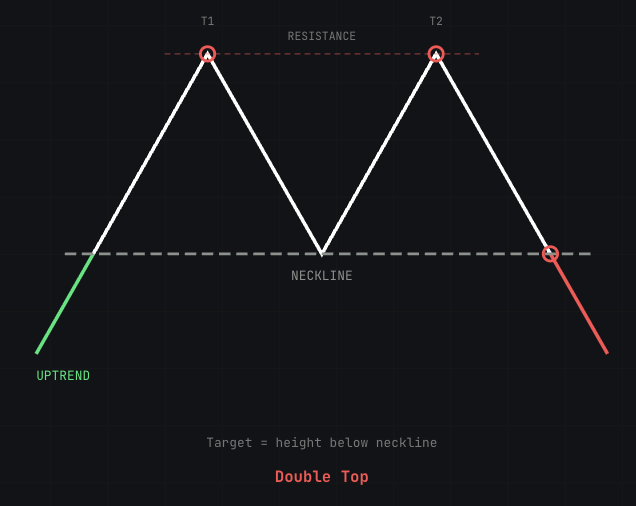
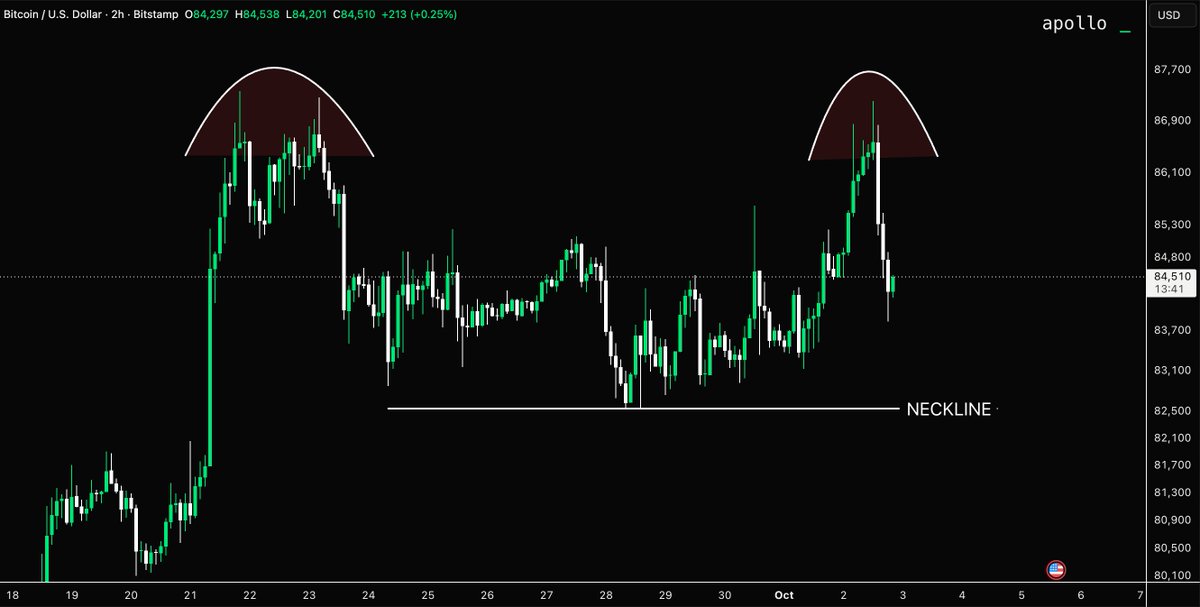
HOW TO SPOT A DOUBLE TOP 📚
A Double Top is a bearish reversal pattern that forms when price makes two attempts to break the same resistance and fails.
$BTC is currently giving us a live example of what the EARLY stages can look like.
→ Two rejections around $87K
→ $82.5K acting as the neckline
But here's the important part:
Two equal highs ≠ a confirmed Double Top.
The pattern only confirms if the neckline breaks and price gains acceptance below it.
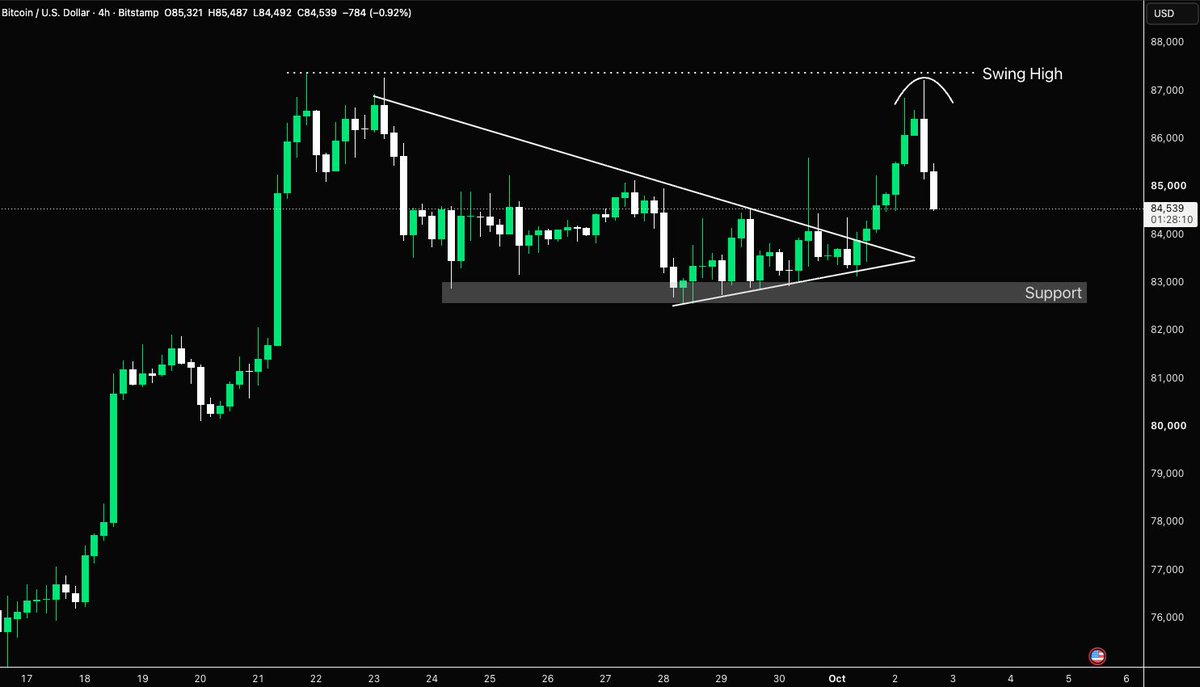
$BTC failed to reclaim the $87K local swing high, rejecting from the level and printing a lower high.
After yesterday’s breakout, this isn’t the reaction bulls wanted to see.
Attention now turns back towards the $82–83K support region. If the current weakness continues, a sweep of that liquidity becomes increasingly likely.
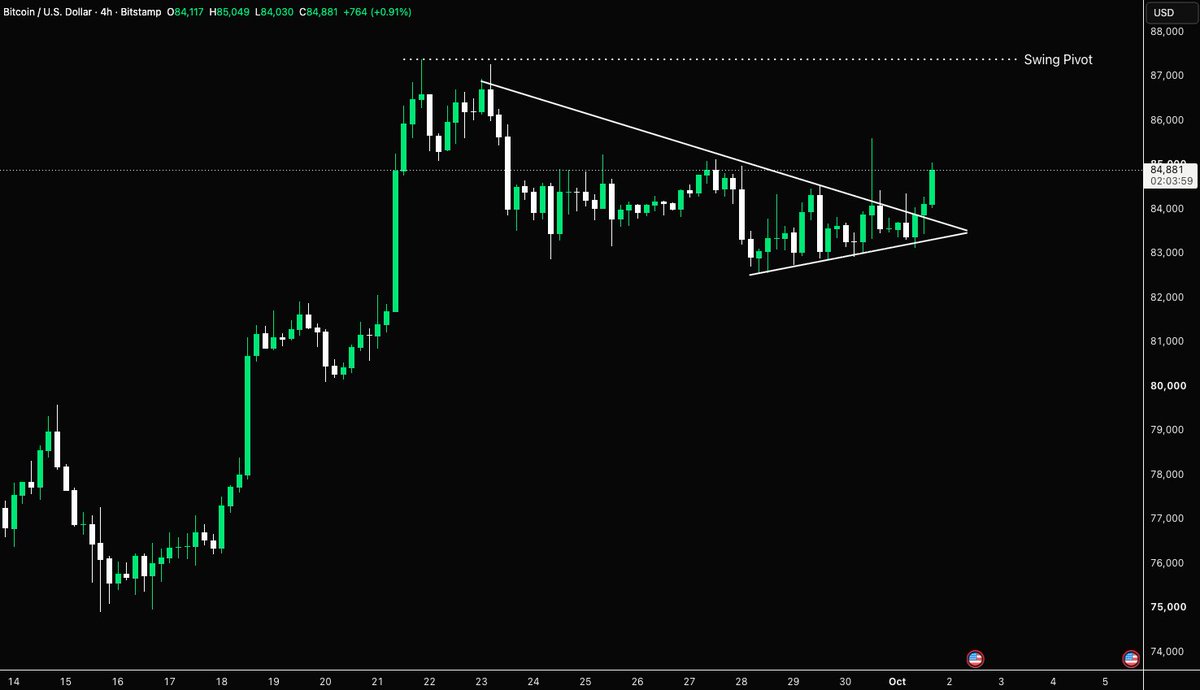
COMPRESSION → EXPANSION
$BTC’s 4H chart has been showing clear compression over the past week, and today we finally got the breakout.
Now attention turns to the $87.3K swing high. That’s the key level BTC needs to reclaim. Failure to do so risks this breakout simply forming a lower high.
For now though, continuation is the focus.
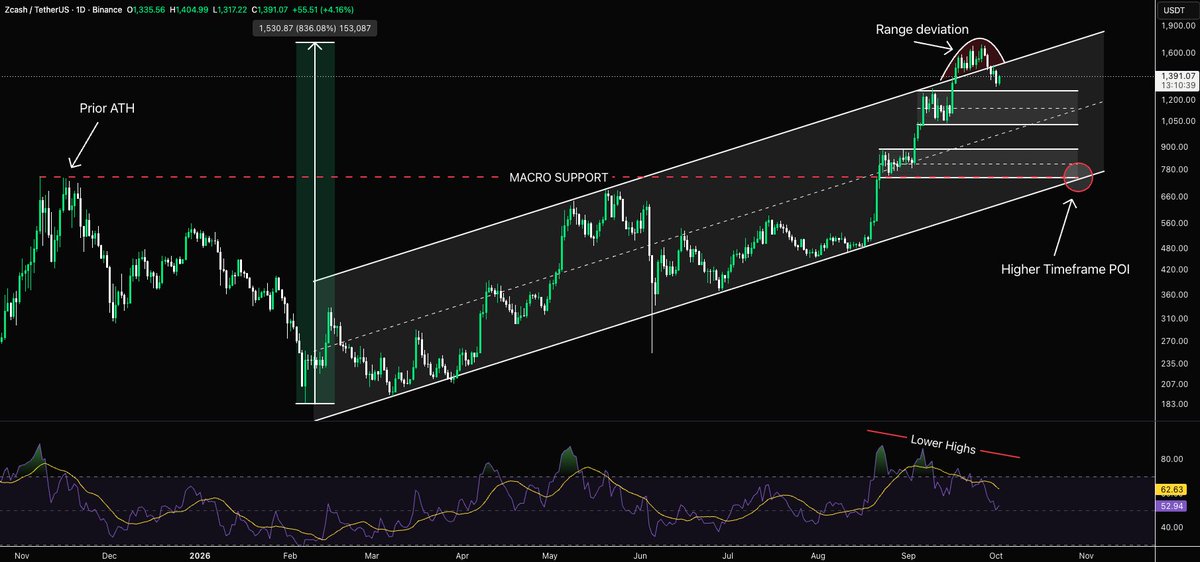
$ZEC LOGARITHMIC CHART❗️
$ZEC has rallied over 800% from its February lows, while respecting an ascending channel throughout the move.
The recent rally briefly pushed price above the channel, but has since deviated and fallen back within the structure.
Acceptance back inside the channel opens the door to a deeper rotation. Not a certainty, but a possibility to be aware of.
If we do see a larger correction, $750–800 stands out as a major HTF POI
→ Prior ATH
→ Macro channel support
→ August LTF range support
All three could converge around the same area.
800% gains in 8 months... probably not a chart you want to be top blasting.
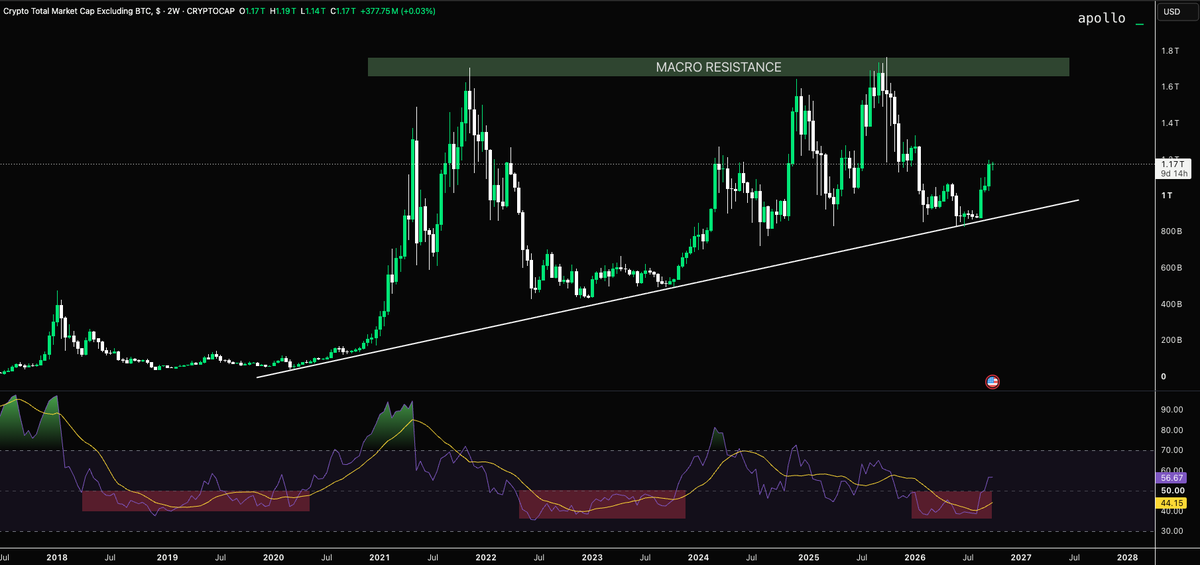
TOTAL2 ASCENDING TRIANGLE
$TOTAL2 bounced from its long-term rising trendline, while the 2W RSI recently reset into an area historically associated with major market lows.
Similar RSI resets appeared around the 2018/19 and 2022/23 bottoms. This was the time to accumulate altcoins.
The bigger test still sits above, $1.7T remains the macro resistance altcoins have repeatedly failed to break.
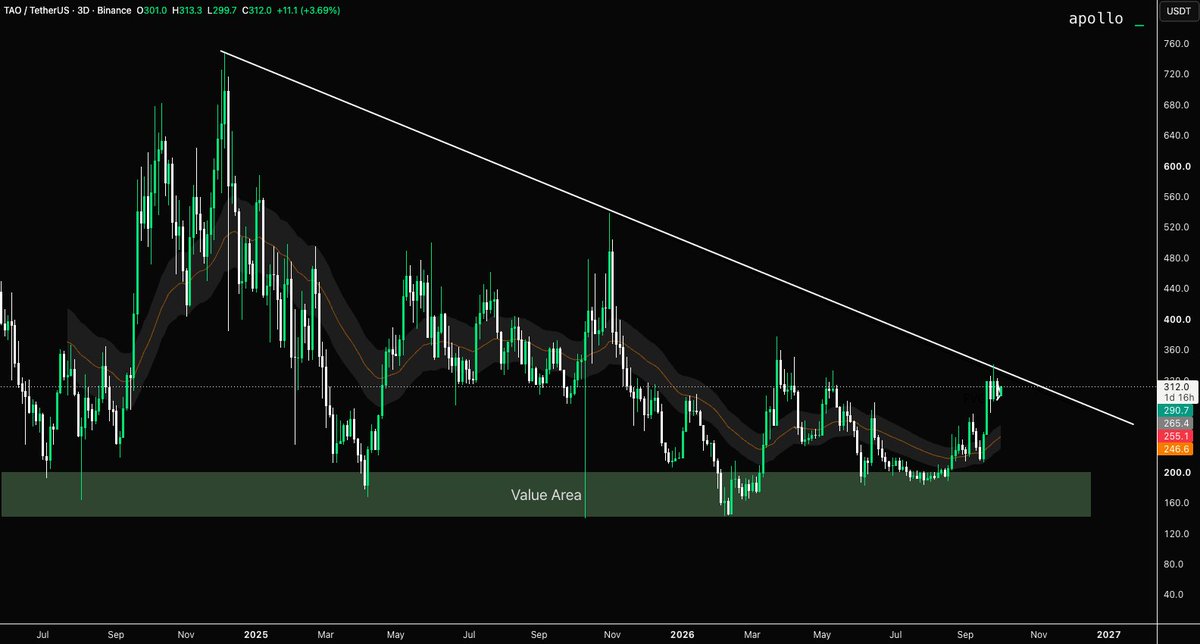
IS $TAO NEXT? 👀
AI has been one of the strongest narratives in the market recently, but $TAO is still lagging behind the pack.
While other AI names have already started moving, TAO is consolidating beneath a multi year trend line.
If the AI trade continues, we expect $TAO to eventually play catch up. Add $TAO to your watchlist.
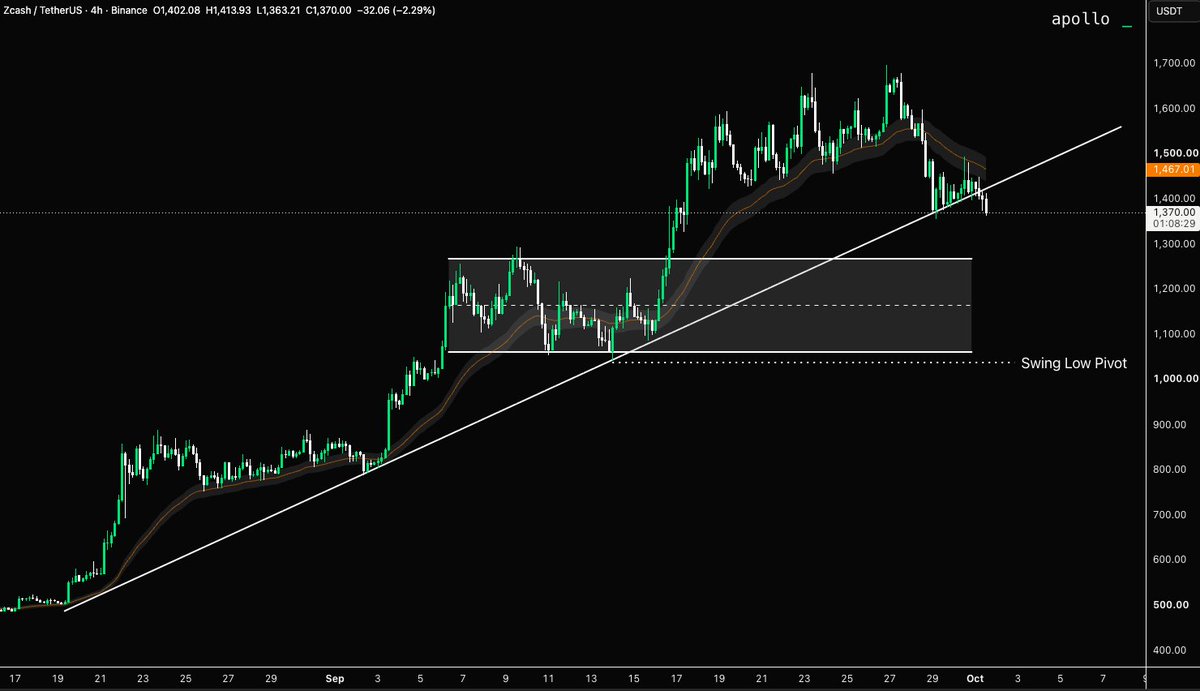
“ ZCASH IS THE NEW BITCOIN ”
That was the narrative as $ZEC went vertical. But while the narrative was getting louder, the structure was getting weaker.
→ Weakening momentum at the highs
→ Loss of key support
→ Failure to hold the trendline
→ Flush
→ Price now likely moving back towards the previous range highs
Narratives create the attention to drive liquidity. But it's the structure that tells you when the trade is changing.
Trade the chart, not the story.
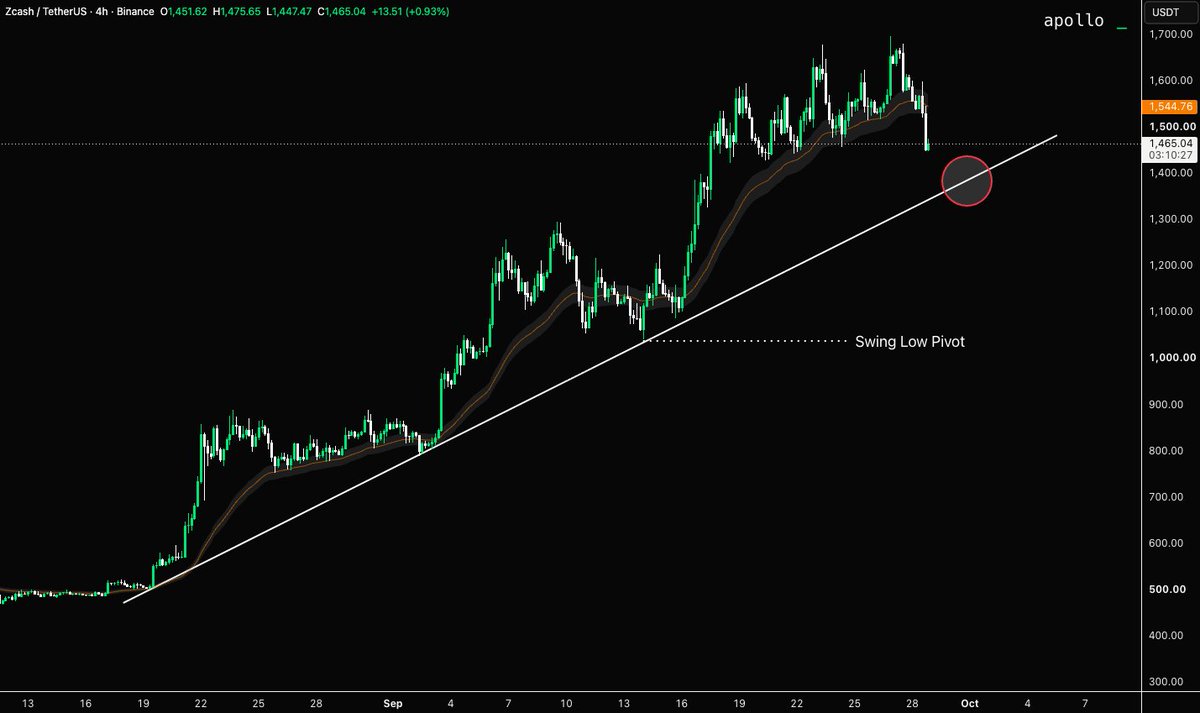
After a relentless run, $ZEC is starting to cool off again.
A test of the rising trendline around $1.4K looks increasingly likely.
If the trend line is lost, a deeper pullback is on the way. The $1,030 swing pivot needs to hold for the broader uptrend to remain intact.
COMPRESSION → EXPANSION
$BTC’s 4H chart has been showing clear compression over the past week, and today we finally got the breakout.
Now attention turns to the $87.3K swing high. That’s the key level BTC needs to reclaim. Failure to do so risks this breakout simply forming a lower high.
For now though, continuation is the focus.
If there is any further downside in $BTC, it likely drags $ZEC down from its trend line.
The first major POI bulls want to see held, is the previous range highs around $1,270.
If not, price likely re enters the range where we can look to play the range game.
$1,270 is the level to watch.