Finding the ghost in the machine & the signal in the market noise. Coder, trader, philosopher. From stocks to crypto, I play the whole board. My philosophy? Win
Pointers to analyze a chart without using any indicators (using current example of Nifty):
1. Analysis should always start from Monthly Time frame.
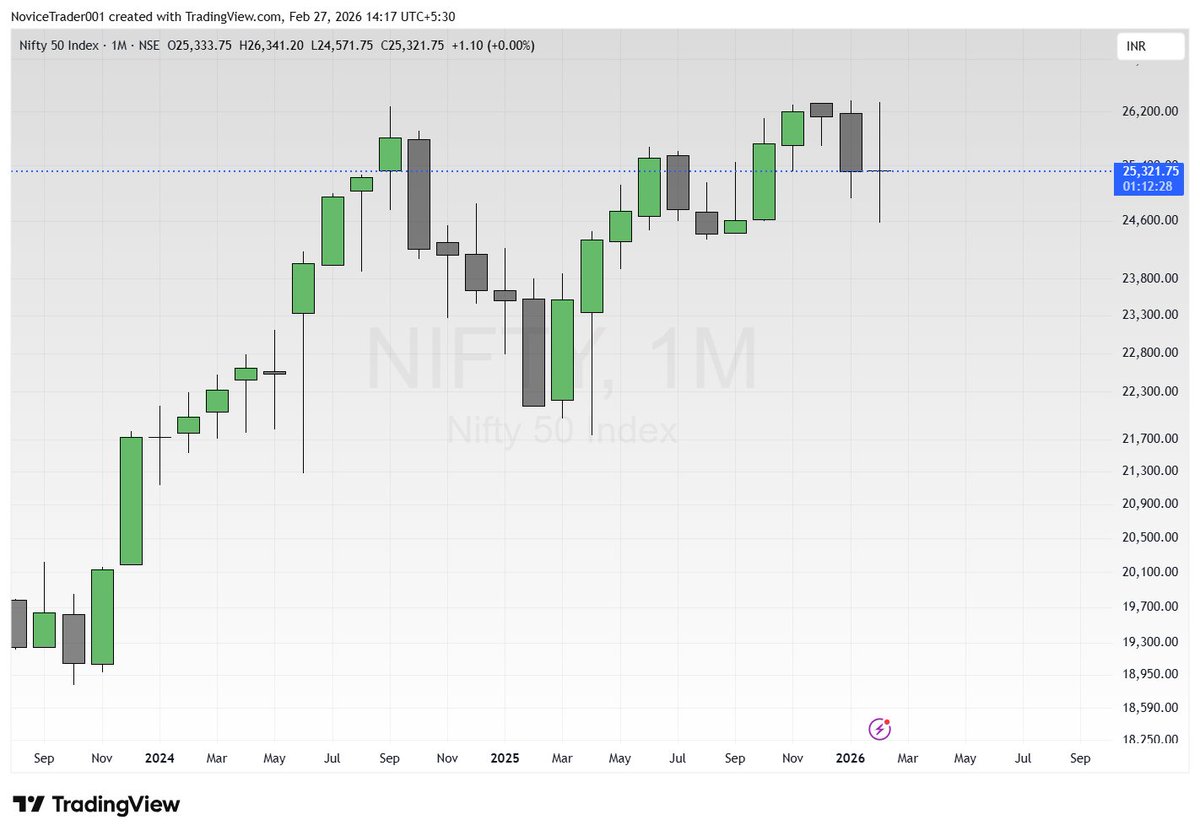
a. Current Monthly candle in Nifty is indecisive (I call it sideways) as there is extreme range but opening and closing is somewhere in the middle.
b. Candle analysis should always be accompanied by previous trend. In the instant case, Nifty is in downtrend from Dec (forming lower high lower low and lower close).
c. Now combine analysis carried out in point a and b above. In the instant case, it can be said that Nifty after being in a downtrend since Dec, has entered into sideways in Feb.
d. Now there are three possibilities - Trend remaining sideways, Trend continuation (i.e. downward trend since Dec), Trend reversal (i.e. halting of downward trend since Dec and entering into an uptrend).
e. Based on the point d above, Nifty will trend only when it breaks either range of Feb month. Trend direction will depend on which range is getting violated (upside or downside). Until this happens, trend will remain sideways.
Verdict - Nifty is sideways on Monthly basis. One needs to watch for the break of the Feb range formed by Nifty in order to catch the trending moves.
2. Now switch your chart to Weekly time frame and analyze in the same manner.
a. Nifty was in a downtrend since Jan 2026 and there is a strong reversal candle in the 1st week of Feb.
b. After the strong reversal candle formation in the 1st week of Feb, Nifty is making lower high lower lows and lower close in the subsequent candles (though low of Feb 02 candle has not been tested), which suggests the trend is downward after a strong upside reversal.
c. It brings us to point that the intermediate trend is downward after a strong upside. The lower range of upside candle becomes critical for the major trend to shift towards downward.
d. For the intermediate trend reversal, one needs to see a test of current weekly candle high and a higher close.
Verdict - Nifty is in downtrend after a strong upside reversal in the first week of Feb.
3. Now switch your chart to Daily time frame and analyze in the same manner.
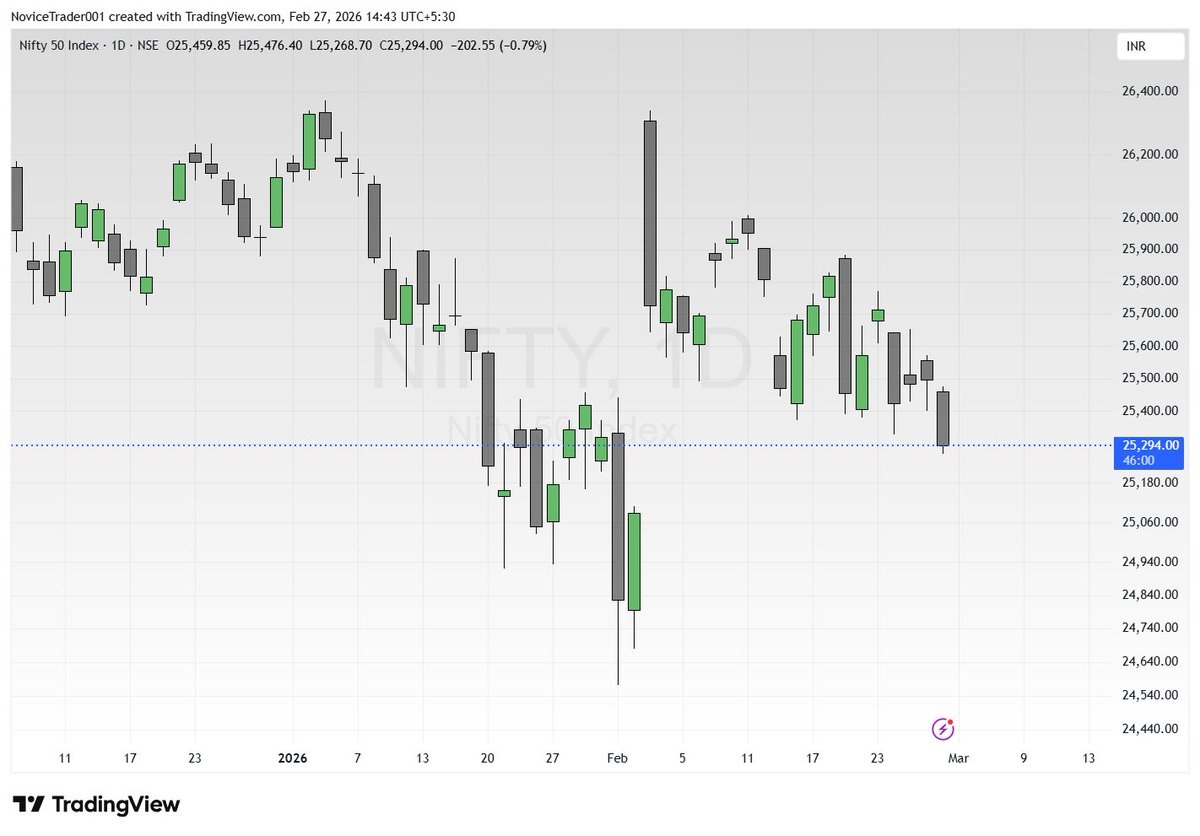
a. After opening gap-up on and forming a range high on Feb 03, Nifty was in a sideways with downward bias.
b. However, in the current candle, Nifty has broken the range low and has formed lower high and lower low.
c. Based on this, it can be said that Nifty has entered into downward trending market and can go for filling the gap made on Feb 03.
Verdict - Downward trending.
Now combine all the timeframe analysis -
i. On Monthly - Nifty is in sideways after a downtrend. Need to break the either range of Feb month for trending.
ii. On Weekly, it is in downtrend after a strong upside reversal in the first week of Feb. Low of Feb 03 candle is an important level as its violation will translate into trending market on monthly basis as well.
iii. On Daily, it is downward trending. Gap created on Feb 03 can be filled and even the lower range of Feb 02 candle is open.
Overall Verdict - Getting into shorts is the obvious conclusion based on the entire analysis.
#TechnicalAnalysis #chart_sab_kuch_bolta_hai #CHART #Chartanalysis #Nifty #Nifty50
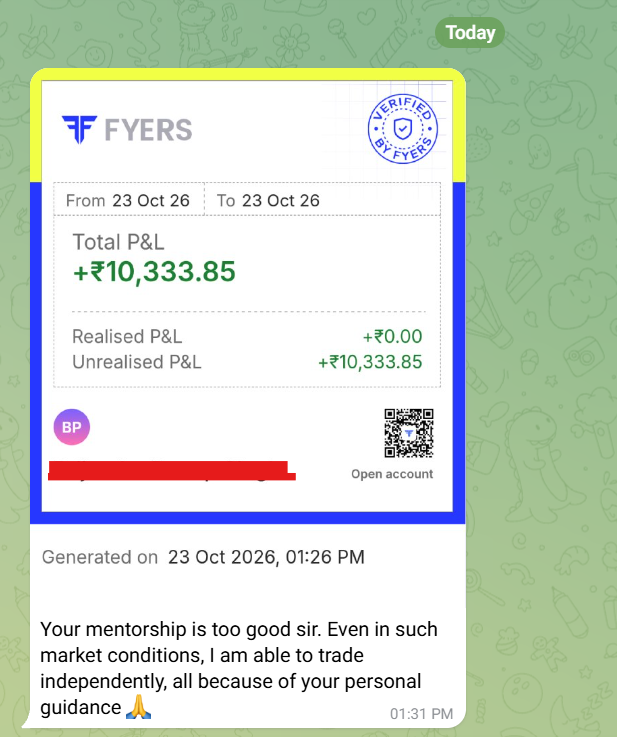
🚀 +708.9% returns in one month!
A trader’s message that means a lot to me. 🙏
My focus: Market understanding, disciplined execution & risk management.
Want to learn my approach to trading?
👇 Comment “MENTORSHIP”
Past performance doesn't guarantee future returns. Trading involves risk.
🎯 The goal of my Mentorship Program is simple:
Learn to analyse and navigate multiple asset classes instead of depending on just one market.
📈 Indian Stock Market
🥇 Commodities
₿ Crypto
🌍 Other market opportunities
Different markets. Different cycles. One systematic approach to analysing opportunities.
The goal is to build your skills, confidence, and independence as a trader not dependence on someone else’s calls.
#TradingEducation #SmartMoney #FinancialMarkets
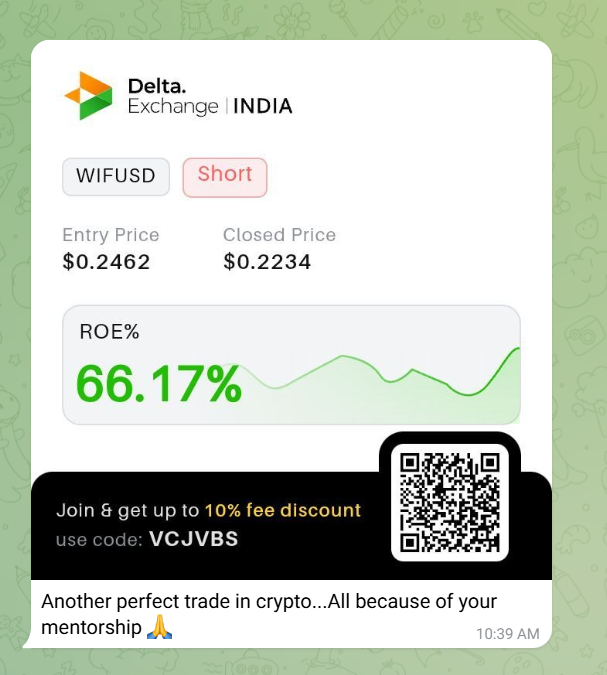
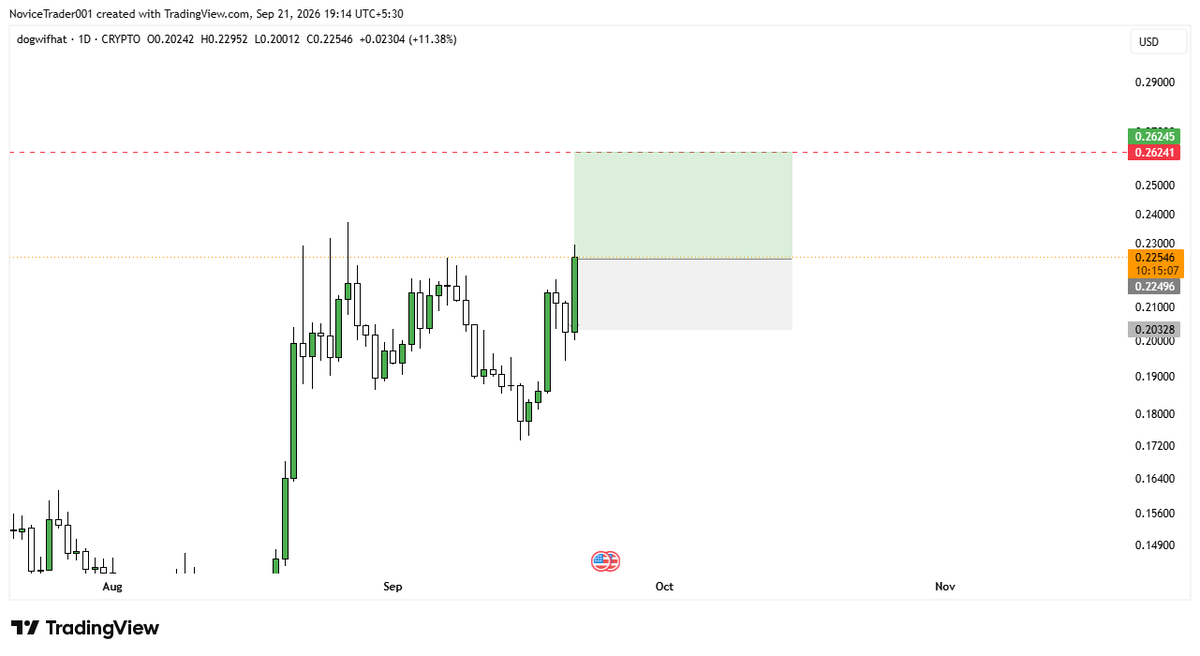
$WIF update — original target of 0.262 hit ✅
Structure still looks strong, so I'm letting this one run. Revised target: 0.32. SL still at 0.203.
Will update when it closes either way.
Most traders think "trend" means "price went up recently."
That's not how trend actually works.
Here's how to read market structure properly — the same logic every serious price action trader uses, across any asset. 🧵
Thrilled to announce I just passed Phase 1 of my trading challenge with @FundedNext! 🏆
What makes trading with them so unique? It’s definitely the user-friendly interface and the massive list of trading instruments! Having a smooth platform makes all the difference. One step closer to being fully funded!
To all the traders out there on the grind: trust your system, manage your risk, and keep showing up. Let's go crush Phase 2! 📉📈
#FundedNext #PropFirm #TradingSuccess #ForexTrader