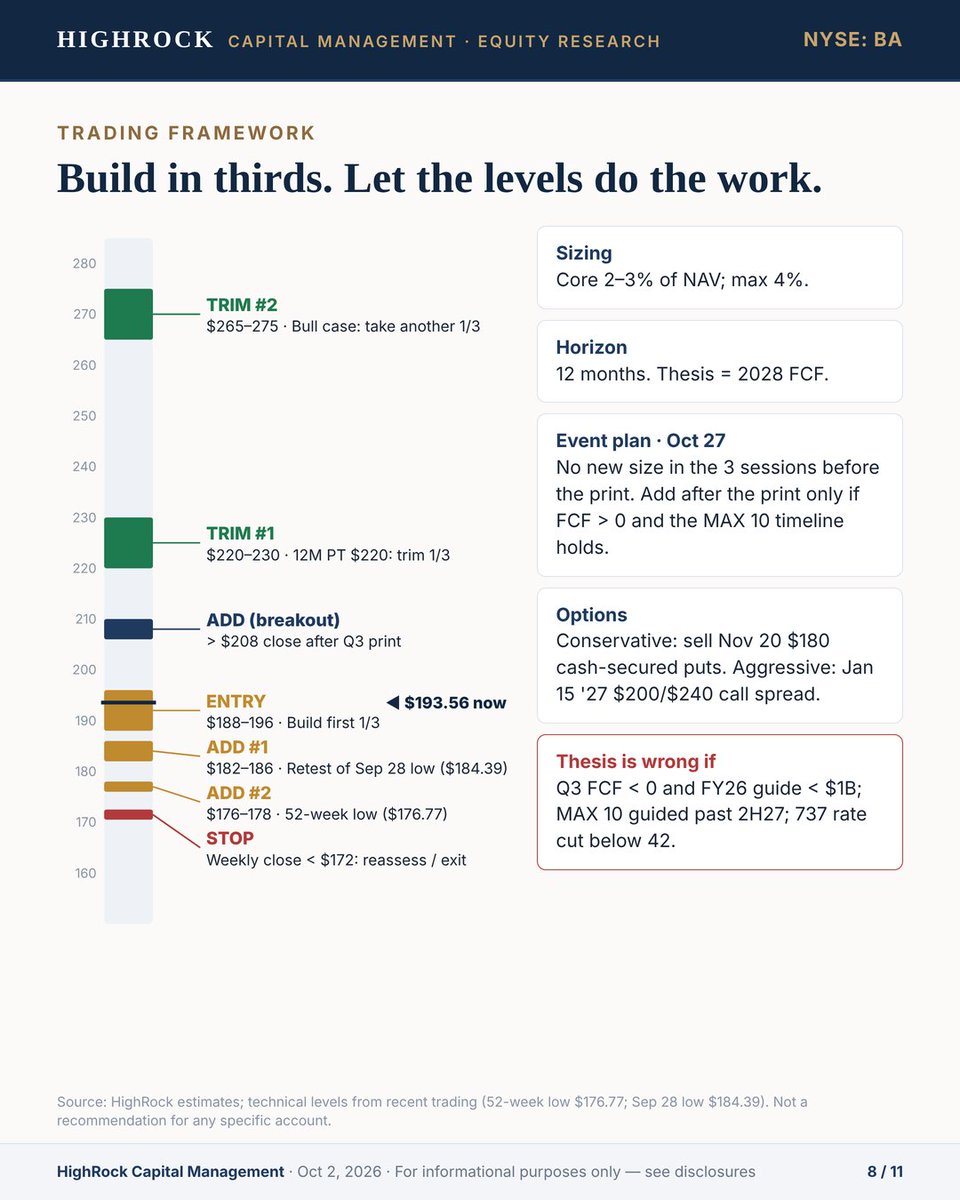
$BA cleared three overhangs in four days. It still trades at 15.6x 2028E FCF.
HighRock view: BUY | 12M PT $220 (+14%) | Prob-weighted $218
What changed:
• Oct 2: The FAA review board says the 737 MAX go-around software issue is "not a flight-safety concern." No grounding.
• Oct 1: SPEEA ratified a 4-year deal. The Oct 7 strike is averted.
• Sep 29: Navy F/A-XX win, the 2nd 6th-gen fighter after the F-47.
What hasn't: MAX 10 certification still waits on the patch. The tail risk is gone; the timing risk is not.
Scenarios (12M):
Bear $158 (−18%) · 25%
Base $220 (+14%) · 50%
Bull $275 (+42%) · 25%
Why it works: At $193.56, BA prices ~$7.6B of 2028 FCF at 20x, about 22% below the $9.8B consensus. FCF path: −$14.3B (2024) → $1–3B (2026 guide) → $6.0B / $9.8B (2027E / 2028E).
Valuation: 1.90x TTM EV/Revenue, 1.59x 2027E EV/Sales, 47x 2027E P/E, 31x NTM EV/EBITDA. Expensive on trough earnings, reasonable on 2028 cash.
Levels:
Entry $188–196 (1/3)
Add $182–186
Trim $220–230
Reassess: weekly close < $172
Oct 27 scorecard: Q3 FCF > $1B, 737 deliveries ≥ 135, MAX 10 timeline intact, BCA margin > −1%.
Risks: MAX 10 slip (40%), 737 stuck at 47/mo (30%), 787 engine supply, 777X charge, a 5% 10Y.
Full 11-page report on request: [email protected]
September payrolls: +29K vs. ~90K expected. July and August revised down 60K combined. Unemployment 4.2%.
But initial jobless claims are 197K. This is a hiring freeze, not a layoff cycle.
Key numbers (BLS):
• Private +46K, government -17K
• 3-month avg ~51K/month
• Avg hourly earnings +0.1% m/m, 3.0% y/y
• Health care +17K, half its 12-month avg
• Financial activities -7K, down 129K since May 2025
What it means:
1) October Fed hike: fading. 3.0% wage growth is not a wage-price spiral. Pause is now the base case.
2) Real labor income is flat: ~+3.3% nominal vs. 3.4% headline PCE. Energy +17% y/y hits consumers first.
3) 2Y at 4.71% is still ~85bp above fed funds mid. The front end prices more tightening than this labor market supports.
4) Recession signal? Not yet. Watch whether 4-week claims move sustainably above ~240K.
Next: Sept CPI, weekly claims, Oct 27–28 FOMC.
Soft landing in slow motion, or stagflation squeeze?
#NFP #JobsReport #Fed #Macro
September: Dow ‑4.3%. Russell 2000 ‑5.4%. S&P 500 only ‑0.45%.
History says October usually pays that back, with one big exception. And 2026 looks a lot like the exception.
HighRock Capital Management | Macro Strategy | Oct 2, 2026
▌What actually happened
Dow: lowest close since June (9/30), ‑6.9% from its 52‑week high
Russell 2000: ‑8.1% from its 8/13 record of 3,053, testing the 200‑day (2,780), RSI ~31
10 of 11 S&P sectors fell. Only Tech rose (+5%); semis +9%
Nasdaq‑100 beat small caps by 8.6 pts in one month
The cause was rates, not earnings:
2Y and 10Y both up ~50bp in September
10Y hit 5.29%, highest since 2002
Fed hiked to 3.75–4.00% on 9/16; dots show one more in 2026
Small caps feel this first: ~40% of Russell 2000 companies are unprofitable, and far more of their debt is floating‑rate than at large caps.
▌History: Dow after a >4% September drop, midterm years
1962: Sep ‑5.0% → Oct +1.9%
1974: ‑10.4% → +9.5% (bear market low 10/3)
1986: ‑6.9% → +6.2%
1990: ‑6.2% → ‑0.4% (oil shock)
2002: ‑12.4% → +10.6% (bear market low 10/9)
2022: ‑8.8% → +14.0% (best month since 1976)
Average October: +7.0%. Up 5 of 6.
▌History: Russell 2000, midterm Octobers
2002: +3.1% (10Y falling)
2006: +5.7%
2010: +4.0% (QE2)
2014: Sep ‑6.2% → Oct +6.5% (10/15 yield flash crash)
2018: Sep ‑2.5% → Oct ‑10.9% (10Y breaking out, Fed hiking)
2022: Sep ‑9.7% → Oct +10.9% (yields peaked late Oct)
Average: +3.2%. Up 5 of 6.
▌The pattern
The deeper the September selloff, the bigger the October rebound.
The one exception, 2018, had the 10Y breaking out and a Fed still hiking.
That is the 2026 backdrop. Seasonality alone is not a buy signal this year.
▌The analog we're watching: late 2023
Oct 2023: the 10Y touched 5.0% and the Russell bottomed on 10/27.
Nov 3: a soft jobs report, and yields rolled over.
Russell 2000: +8.8% in November, +12% in December.
Today: payrolls +29k vs. 84k expected, unemployment 4.2%, October hike odds near zero, 10Y back to ~5.24%.
Same type of signal. It still needs confirmation.
▌October scenarios
Russell 2000 (from 2,806):
Bull 35%: 3,000–3,050 (+7–9%). 10Y below 5.0%, benign CPI, Fed on hold
Base 35%: 2,750–2,880 (‑2% to +3%). Chop around the 200‑day into the election
Bear 30%: 2,550–2,600 (‑8–9%). 2018 replay: hot CPI, 10Y above 5.5%, oil above $110
Probability of a positive October: ~55%
Dow (from 50,927):
Bull 35%: ~53,500 (+5%)
Base 40%: ~51,400 (+1%)
Bear 25%: ~48,400 (‑5%)
Probability of a positive October: ~60%
▌Valuation cushion
Russell 2000 near 18x vs. ~29x for the Russell 1000, a 35–40% discount.
Q3 small‑cap EPS +19.5% YoY; FCF per share +11.2%.
The earnings are there. The multiple is waiting on rates.
▌What we're watching
10Y: below 5.10% confirms; above 5.50% means 2018 risk
Russell 2000: hold 2,780 (200‑day), reclaim 2,900
WTI: below $85 helps; above $110 hurts
CPI 10/14 · FOMC 10/27–28 · Mega‑cap earnings late Oct · Election 11/3
▌Bottom line
September already absorbed much of the rate shock, and midterm history favors October. But this rebound runs on the 10Y peaking, not on the calendar.
Below 5.25%: the 2022 playbook.
Above 5.5%: the 2018 playbook.
2018 or 2022, which do you see?
$IWM $DIA $SPY $QQQ #SmallCaps #Russell2000 #Macro #MidtermElections
2/7 Fiscal Q1 (reported Sept. 10): revenue +30% to $19.3B, cloud infrastructure +121%, operating cash flow a record ~$23B. Capex: $28.5B.
On forward P/E the stock screens at roughly 16-18x. But P/E sees earnings, not the capex bill.
1/7 $ORCL has $664B of contracted backlog (RPO). Last quarter it still burned $5.4B of free cash flow.
Both numbers are true. That is why I never value a build-out story on backlog or P/E alone. A short thread on what I check instead.
7/7 My next checkpoint: whether FQ1 gross margin holds as the "floor" management called it.
Is 7x run-rate EPS pricing in a peak, or missing a regime change? #Semiconductors
Not investment advice. HighRock and its clients may hold positions in securities mentioned.
1/7 $MU just guided to $38 of EPS for a single quarter. The stock slipped ~1% after hours.
That reaction is the whole debate: is an 87% gross margin a new floor, or a peak?
A short thread on how I frame it.
6/7 The counterpoint is real: annualizing a peak quarter is how cycle investors get hurt.
Capex is ~$25B in 1H FY27 and rising, price ceilings cap upside, and these contracts have never been tested in a downturn.
5/7 Management also says it has "no line of sight" to when supply and demand return to balance.
At ~$1,066 (Sept. 30 close), $MU trades near 7x the FQ1 EPS guide annualized. The market is not paying for durability.
4/7 What management says is different this time:
- 26 Strategic Customer Agreements, $32B of customer commitments, covering 35%+ of revenue through 2030
- 75%+ of 2027 output already committed
- Most SCA pricing has floors and ceilings
3/7 History is the bear case.
Micron's GAAP gross margin peaked at 61% in FQ4 2018 and fell to 28.6% four quarters later. FY22 net income of $8.7B became a $5.8B loss in FY23.
7/7 The job is to know which phase you are paying for.
Which do you trust most: fwd P/E, EV/(EBITDA - capex), or FCF yield? #Valuation
Not investment advice. HighRock and its clients may hold positions in securities mentioned.
6/7 The counterpoint is real: capex comes before revenue. If utilization holds and contracts convert on schedule, FCF can inflect sharply once the build slows.
Negative FCF in a build phase is not automatically a red flag, but it has to be underwritten, not assumed.
5/7 Check 3: Who is the backlog with?
In July, S&P estimated OpenAI at roughly half of Oracle's then-$638B RPO and cut Oracle to BBB-. Counterparty concentration is the risk I weigh most here.
4/7 Check 2: Gross vs. net capex.
FY27 guide: $90-95B capex, net cash capex capped at $70B after "alternative financing." The gap does not disappear; it shows up as leases or partner obligations. I add it back for EV and leverage.
4/7 Check 2: Gross vs. net capex.
FY27 guide: $90-95B capex, net cash capex capped at $70B after "alternative financing." The gap does not disappear; it shows up as leases or partner obligations. I add it back for EV and leverage.