BTC Price Analysis
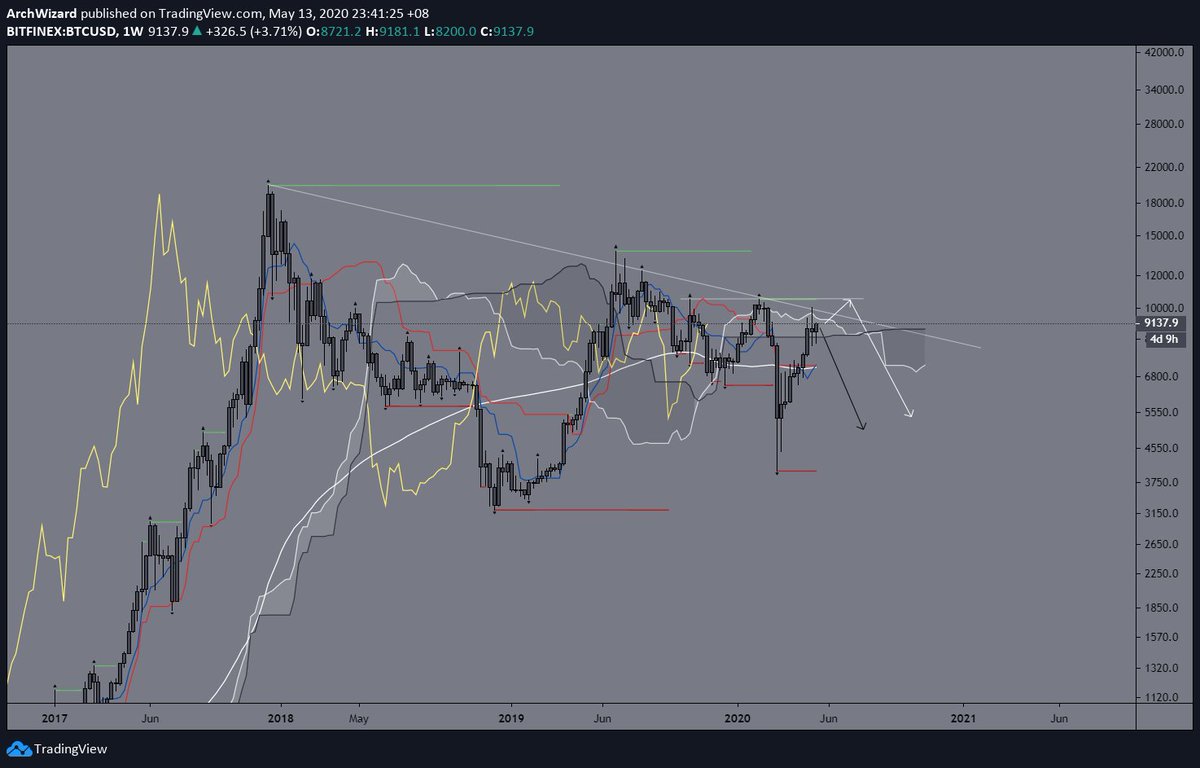
Rejected the descending trend line and we have 2 options:
a) Price consolidates and make a final push to around $10.5k before going down (white arrow)
b) Price goes down from here
(Lower timeframe analysis in a moment)
#btc#bitcoin#crypto
USD/CAD Short
Descending triangle, looking for a short at the top of the trend line. Bottom of the triangle has been tested 3 times and should be broken at the 4th try.
#forex#usdcad#TA
Crypto twitter is pretty brutal, people want only clear "up or down" calls, even when the market is unclear and trendless
And god forbid you miss 1/10 calls, you are a "charlatan"
LOL 🤣
Trading should be a mundane routine, not something you're excited about when you wake up every morning. This is a common pitfall for a lot of traders, even the experienced ones.
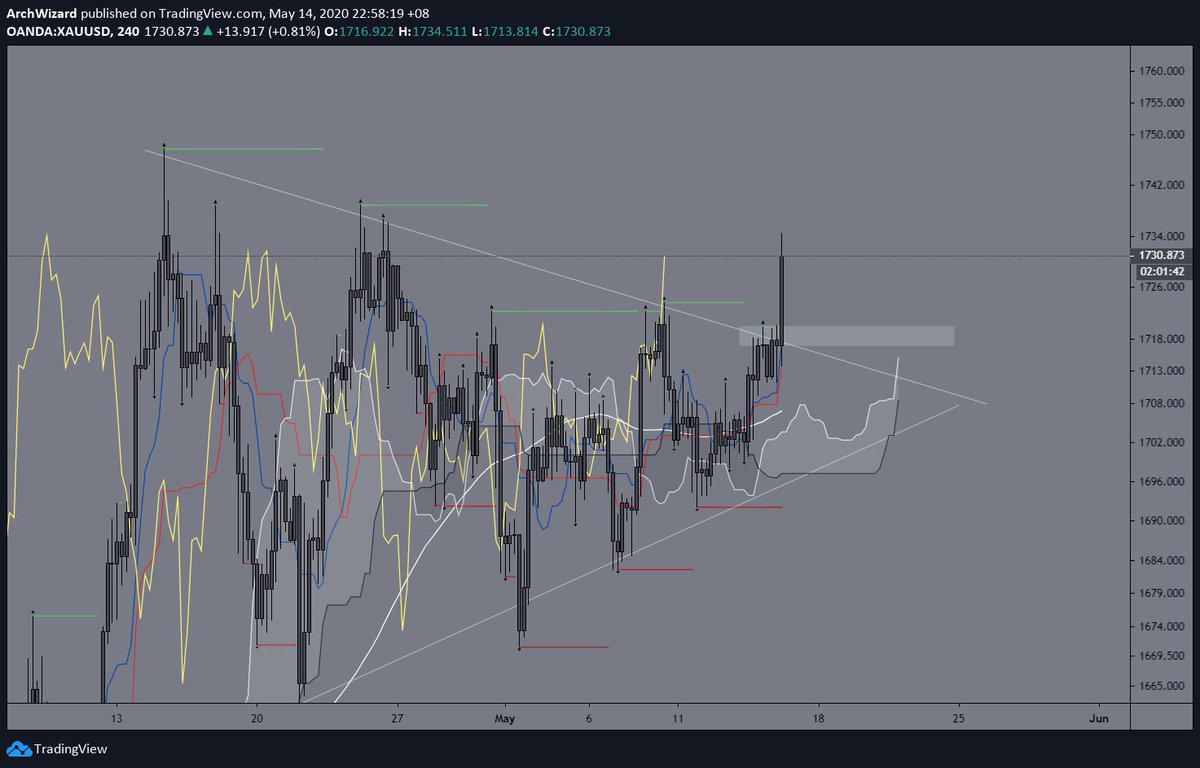
$XAU Gold just broke out from a triangle pattern. Breakout traders would long at breakout and should see some nice gains by now. Still plenty of opportunities to enter later as it will retrace. Grey box will be where I look for a buy.
#gold#xau
Update:
Price broke the triangle pattern downwards, would've been a decent short when it retested but personally I didn't get in as I was busy with something else. Might still see some short term upwards push but shouldn't be much.
Another possibility is that it just breaks down from here and if that happens I will just wait for price to retest the broken lower trend line before shorting.
On the 1D chart, price is still relatively bullish despite heavy resistance above. Price broke down but it never violate the bear fractal. Would only consider shorting if price closes below the grey box.
BTC Price Analysis
Rejected the descending trend line and we have 2 options:
a) Price consolidates and make a final push to around $10.5k before going down (white arrow)
b) Price goes down from here
(Lower timeframe analysis in a moment)
#btc#bitcoin#crypto
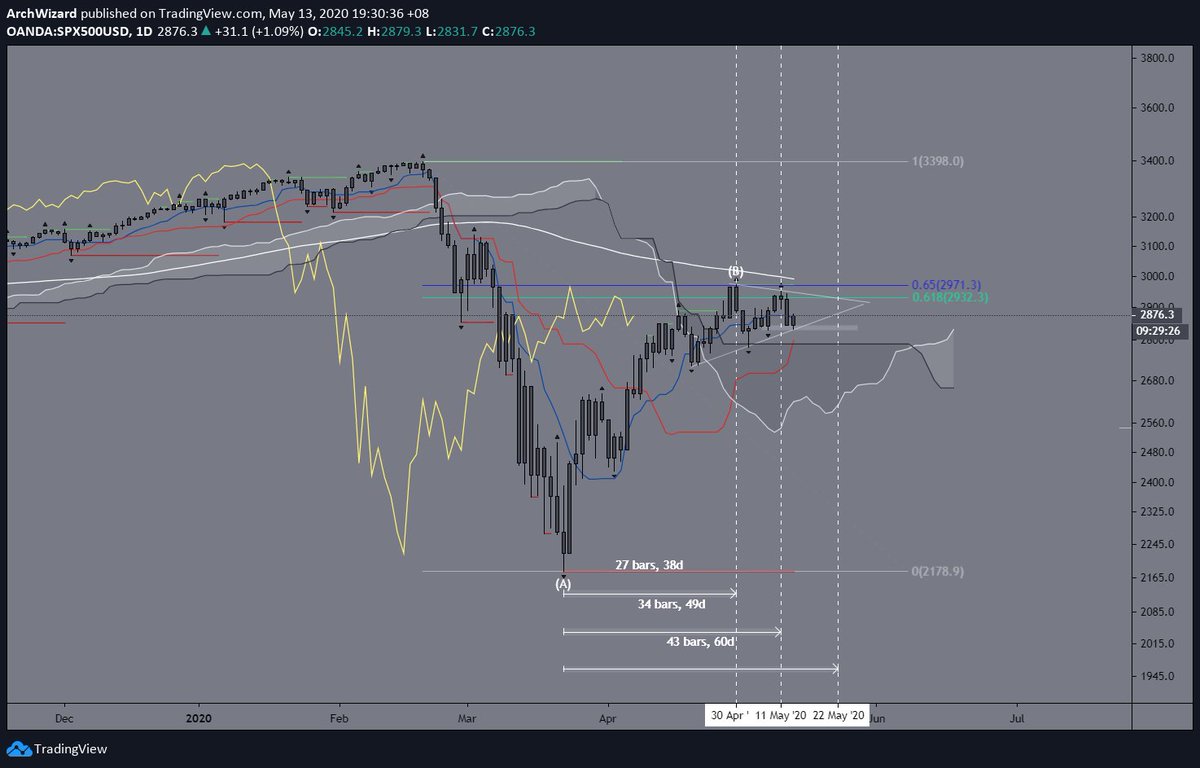
Using Ichimoku time cycles, each lower highs made within the triangle corresponds with the cycle numbers which are 26, 33, and 42 ( a +/- 1 margin of error is assumed).
After the crash from March, the S&P 500 has experienced a corrective rally upwards, retracing to the 0.618 Fibonacci level but failed to break it. Since then, price has been moving in a contracting triangle pattern.
Based on this, we should be seeing the third lower high on the 22th of May, and that can be a critical point where price either break upwards, suggesting the end of a corrective rally. However, price can also break downwards, starting a new wave to the downtrend.