ETF flows are +$121b in Jan so far. That's bonkers. The avg January is around $40b and the all time record is $88b (set last yr) and we still have a a week to go. Also $VOO at $19b is also nuts. $VOO's avg daily inflow is what all ETFs' daily avg was 10yrs ago. New normal.
According to the US government, US Consumer Prices rose 37% over the past 10 years. The actual number is likely much higher than this. There's no "deflation" in the US because we are constantly printing money and running deficits - don't believe anyone telling you otherwise.
This is insane..
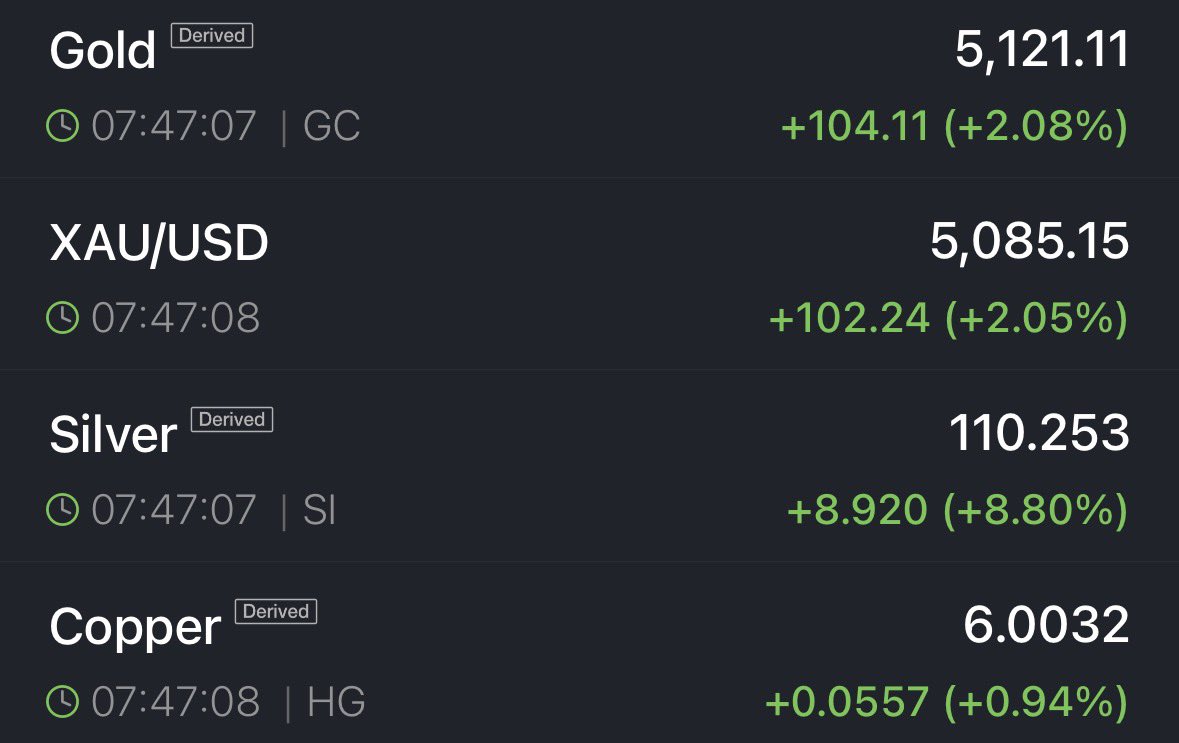
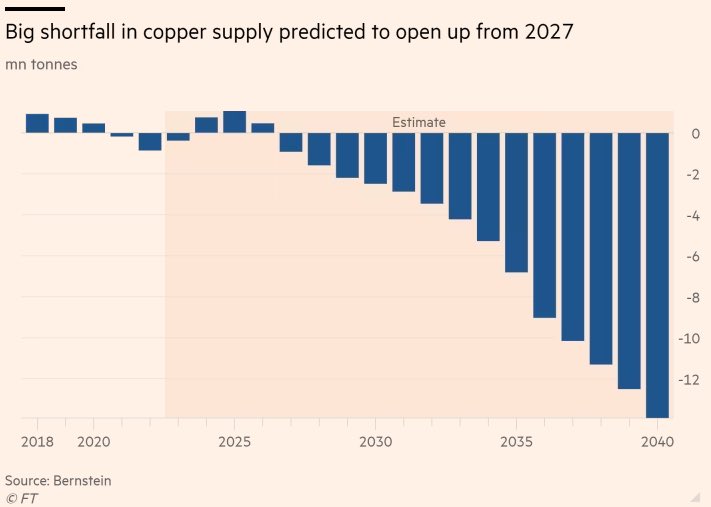
Bernstein predicts that copper shortage will start in 2027 and progressively deepen by 2050.
Demand will explode but supply will be limited as the operating mines are being depleted and getting permits for new ones is very hard.
Copper supercycle is coming.
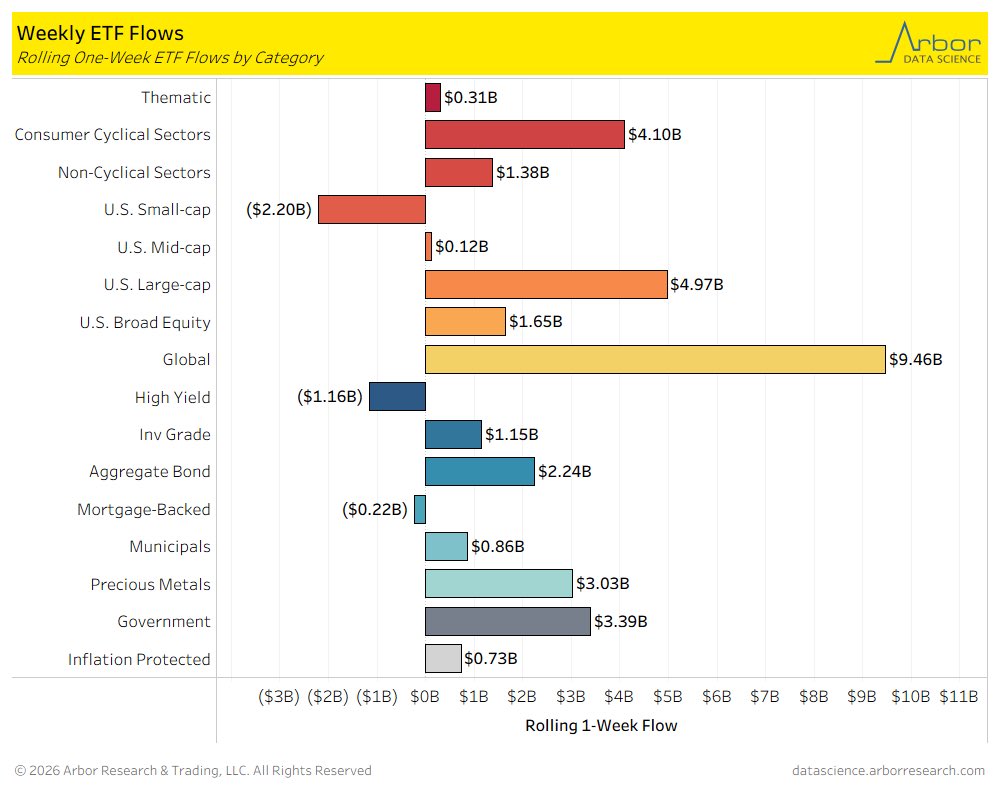
Of 16 ETF categories charted below, 13 had net inflows for week ending 01/16/2026; 3 categories with largest inflows were Global at +$9.5B, U.S. Large-Caps at +$5B, and Consumer Cyclical Sectors at +$4.1B; category with largest outflow was U.S. Small-cap at -$2.2B
@DataArbor
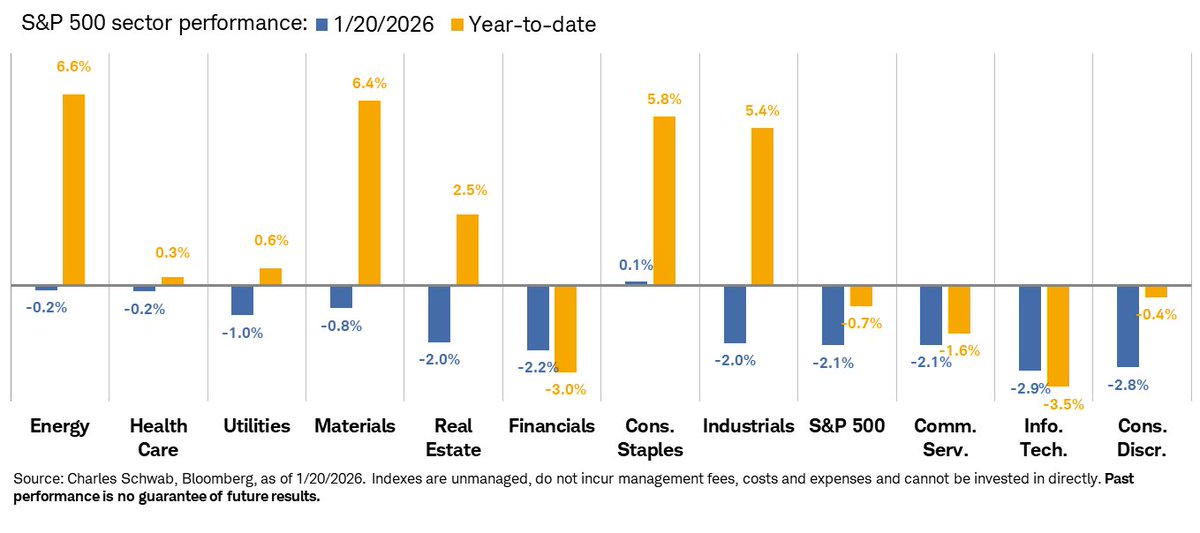
2026 YTD:
-Small Caps > Large Caps
-International Stocks > US Stocks
-Value Stocks > Growth Stocks
-Mag 7 in the red
The reversal of everything....
Video: https://t.co/qOK4Z0AFtP
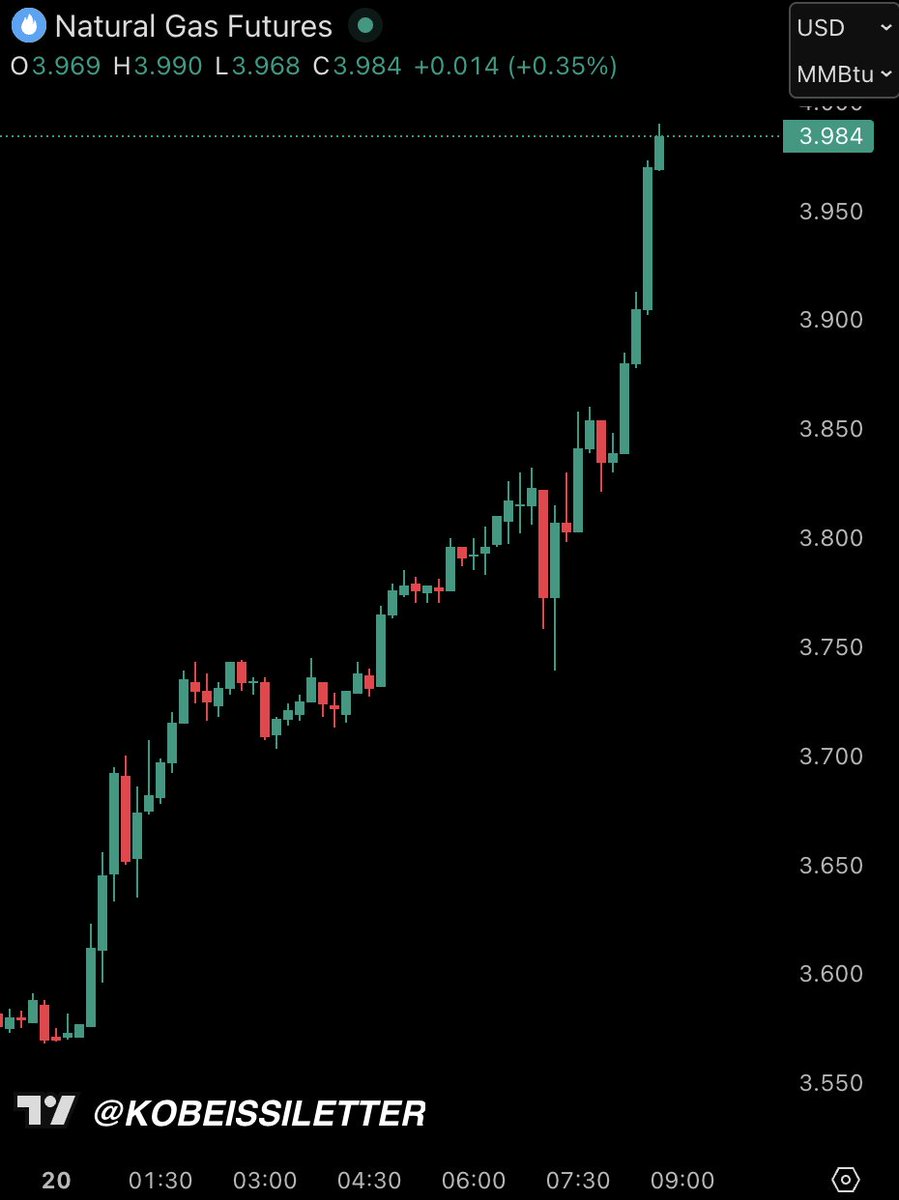
BREAKING: Natural gas prices surge +28% as an "Arctic airmass" approaches the US, now on track for the 3rd largest daily gain in history.
Temperatures will be up to 25 degrees Fahrenheit below average in the Northeast and Midwest US.
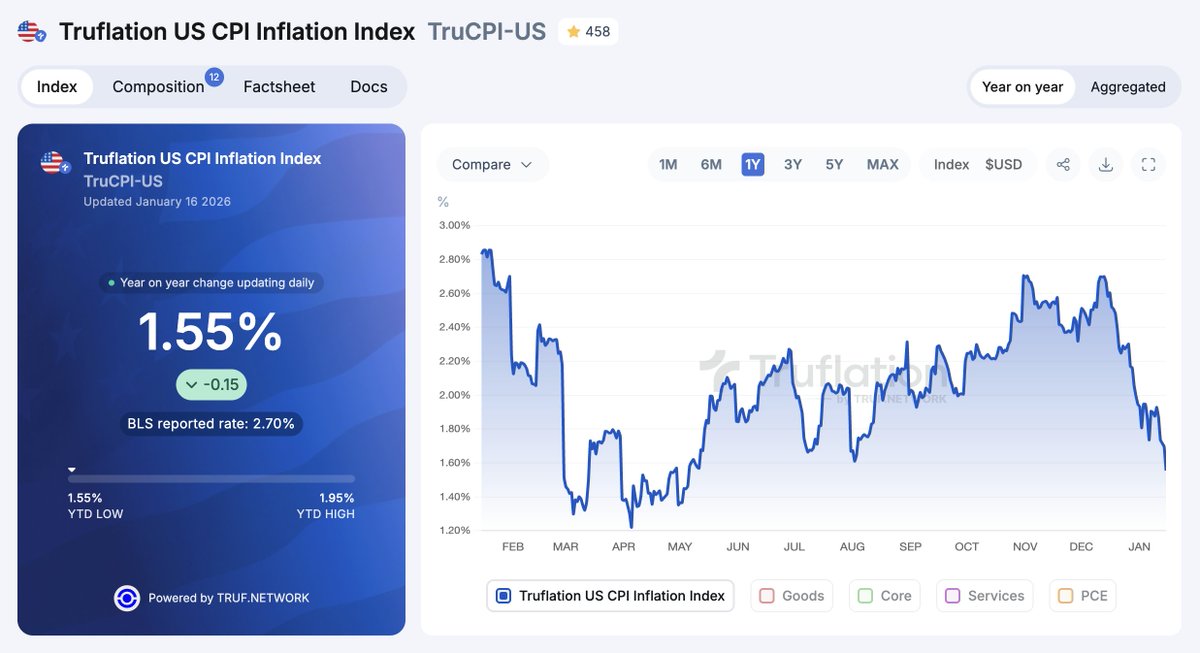
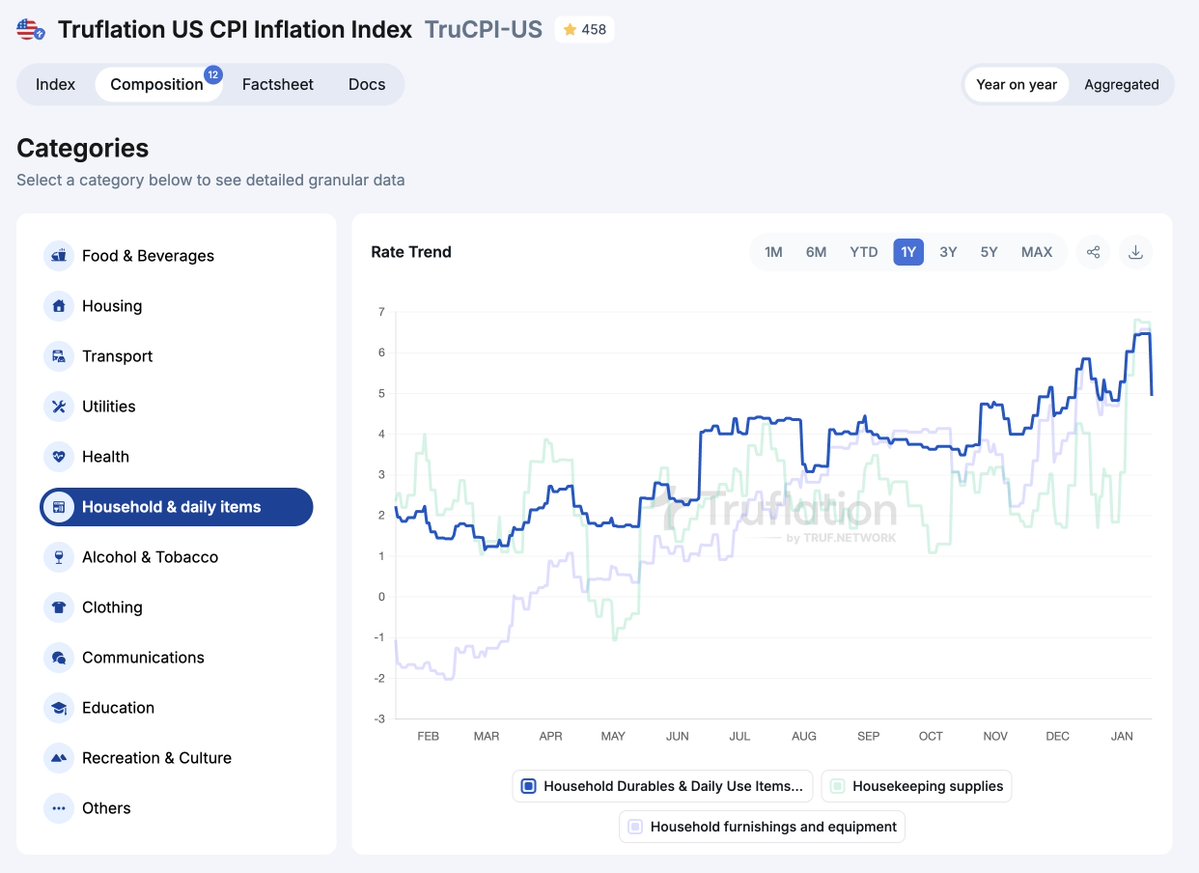
US CPI Inflation today: 1.55%
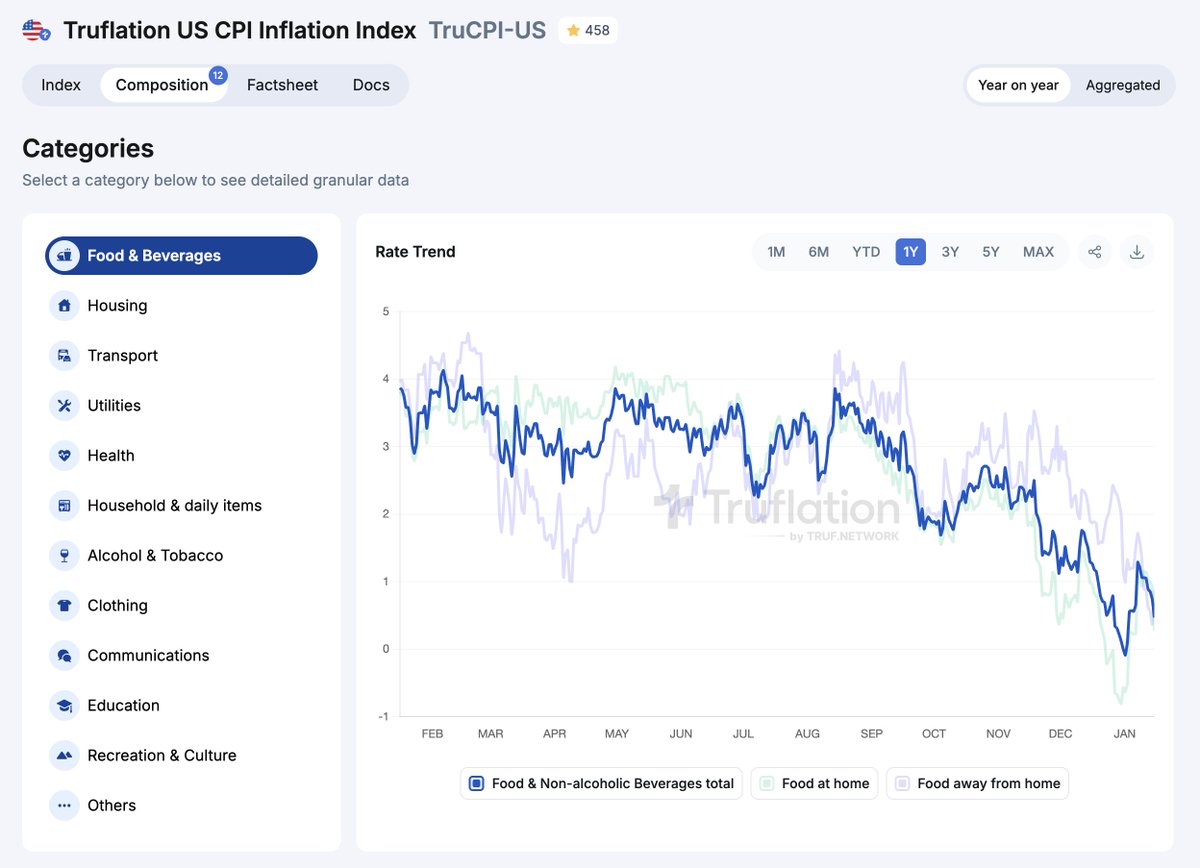
Our inflation index dropped further today, from 1.70% to 1.55%, as cooling spread across multiple categories.
The main drivers included the Housing, Food, and Household items categories.