🚀 Big milestone for @Tap_Fintech!
Today marks the launch of Stabld, Tap's own family of fully reserved stablecoins:
💵 stUSD
💶 stEUR
💷 stGBP
A major step toward building a global payments infrastructure and expanding the Tap ecosystem. Exciting times ahead! 🔥
$xtp 🚀
Strong update from @TapGlobal. 📈
Tap Earn AUM has exceeded $5M (+43%) despite the recent crypto market drawdown.
✅ Deposit growth continues
✅ Revenue is becoming less dependent on trading activity
✅ Customer yields increased to up to 8%
RNS here:
https://t.co/bu8UdNqwAp
Other than everyone crying it’s all over….. does anyone objectively understand what’s happening in the crypto markets? Help a bro out @JamesEastonUK@RaoulGMI@BittelJulien
@Tap_Fintech
Regulated
Insured
Publicly listed
Fully “by the book”
First crypto fintech approved by Mastercard in EU
Personal & business accounts
Real banking + crypto in one place
Tap Earn up to 7% yield
Up to 8% cashback
$XTP solid utility
Strong community & dedicated CEO
@Tap_Fintech
Regulated
Insured
Publicly listed
Fully “by the book”
First crypto fintech approved by Mastercard in EU
Personal & business accounts
Real banking + crypto in one place
Tap Earn up to 7% yield
Up to 8% cashback
$XTP solid utility
Strong community & dedicated CEO
$XTP just unlocked a massive catalyst 🇬🇧🔥
Tap Earn is now LIVE in the UK — one of the most important crypto fintech markets in Europe
Up to 7% yield on supported stablecoins
Up to 3.5% on BTC & ETH
No lockups
More users
More Earn adoption
Stronger XTP ecosystem
Still early👀
Excellent video on @Tap_Fintech’s vision and future growth. Great topics covered regarding the company’s progress, roadmap, and the long-term potential of the business and the $XTP token. Really appreciate the initiative and the quality of the discussion.
https://t.co/I9wzIxDiVI
Really excited for Tuesday’s video release with Arsen, CEO of @Tap_Fintech. 🔥
The preview already looks very promising with strong topics being discussed around the future of Tap and $xtp token. 💎
Huge thanks to @SaveWithCrypto for the amazing work.👏
https://t.co/v6RVbAa5bT
I can see how despondent everyone is about crypto and the pure chartists are telling you it's all over, but I don't agree...
Global Liquidity is the most dominant macro factor in history with a 90% correlation to BTC and 97% to NDX since 2012. It is growing at around 10% a year and is not slowing.
GMI financial conditions lead it by 6 months. They are still easing.
The air pocket was US Total Liquidty which was curtailed by the shut down. It leads crypto by 3 months and is accelerating from its low 3 months ago.
The business cycle is the key driver of earning and thus risk. It is accelerating.
The eSLR is the mechanism by which banks can increase liquidity via credit and absorbing treasury issuance. This liquidity is rising too and will accelerate.
Tax refunds land on bank balance sheets and add to propensity of credit creation and thus liquidity.
China is accelerating expanding its balance sheet.
More rate cuts are coming in the US and will add to disposable income and thus risk taking.
CLARITY Act will likely get agreed and adds to flows. The wall of banks and asset managers wanting to use this technology is enormous and this bill sorts that out.
Stablecoins are accelerating and issuance grew 50% last year and is accelerating. Volumes are in the trillions of $'s and are accelerating.
We have the most supportive government for crypto ever in the US.
Finally the agents are coming and will hyper accelerate. They are an entirely new TAM
The crypto market is still in fear and by most measures the most oversold in history.
Weekly DeMark indicators would give a very solid base in 2 weeks (you can now get them officially on Trading View).
Daily DeMark's are stack up too. Any weakness from here will complete the dailies and the weeklies indicating full trend reversal potential.
The risk factor is how long oil prices stay up.
The next 2 weeks are the key focus.
I think this all resolves positively.
Higher.
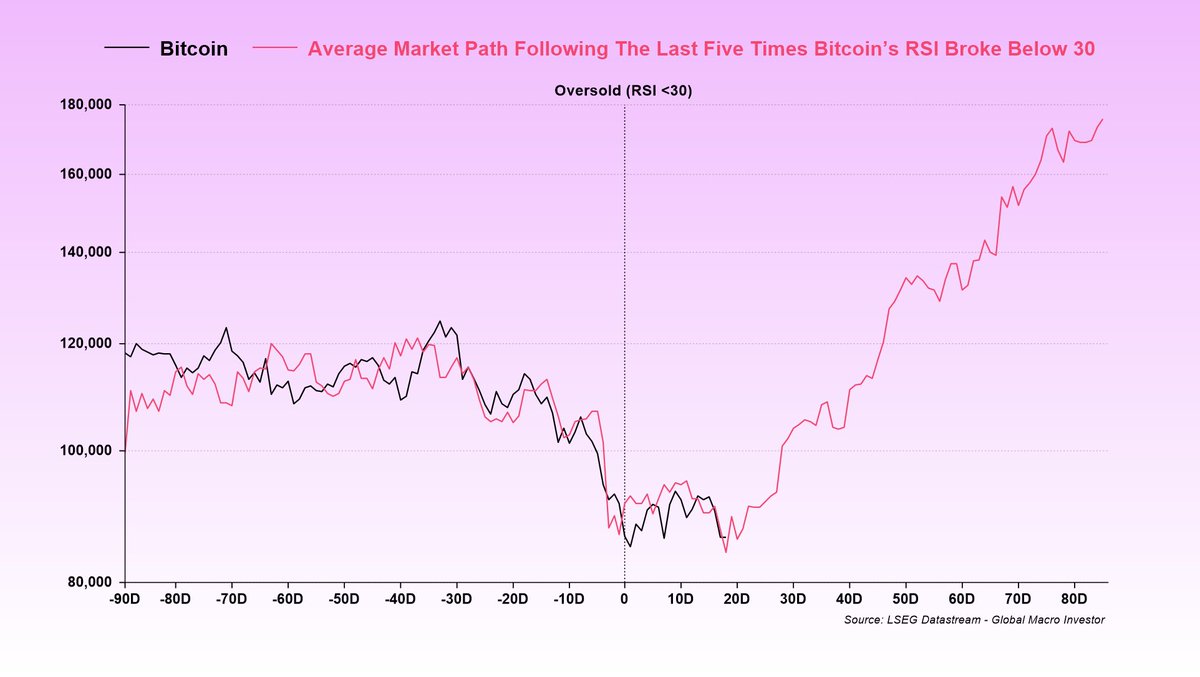
A lot of people have been asking for an update on this chart, so I’ll just leave this here for anyone who needs to see it.
This shows the average BTC trajectory following an oversold RSI reading, with RSI falling below 30 at t=0.
So far, it’s been pretty bang on.
Unless you believe the 4-year cycle is still in play, which we don’t, this chart should hold up contextually over time.
No, it won’t be perfect, but assuming the bull market isn’t already over, it’s a useful chart to keep in mind.
As we’ve outlined many times, based on our work on the business cycle, the current path of financial conditions, and our expectations for overall liquidity, the balance of probabilities is that this cycle extends well into 2026.
In that world, the 4-year cycle is dead.
Remember, the 4-year cycle was never about the halving, despite widespread belief that it is, but instead has always been driven by the public debt refinancing cycle, as outlined in our work at GMI, which post-COVID was pushed out by one year.
In our view, the 4-year cycle is now officially broken because the weighted average maturity of the debt term structure has increased.
And the bigger picture is that there is still a vast amount of interest expense that needs to be monetized, which has far exceeded GDP growth.
Another thing to keep in mind is that bases can take time to form and usually come with plenty of chop before the bigger up-move kicks in.
Finally, let me repeat what I said when I first posted this chart last month.
If you think the bull market is over and we are now facing twelve months of pain, this chart is not for you. Move along...