New YouTube video out now!
Trading was hard for me until I learned these 2 simple concepts.
You need to watch this video before you trade this week.
Watch here - https://t.co/f0WjDbZHaj
🚨 BREAKING: Gov. Ron DeSantis has just signed a law BANNING Sharia Law from being enforced anywhere in the state of Florida
Sharia Law and Islamism are INCOMPATIBLE with America.
This should be a FEDERAL law.
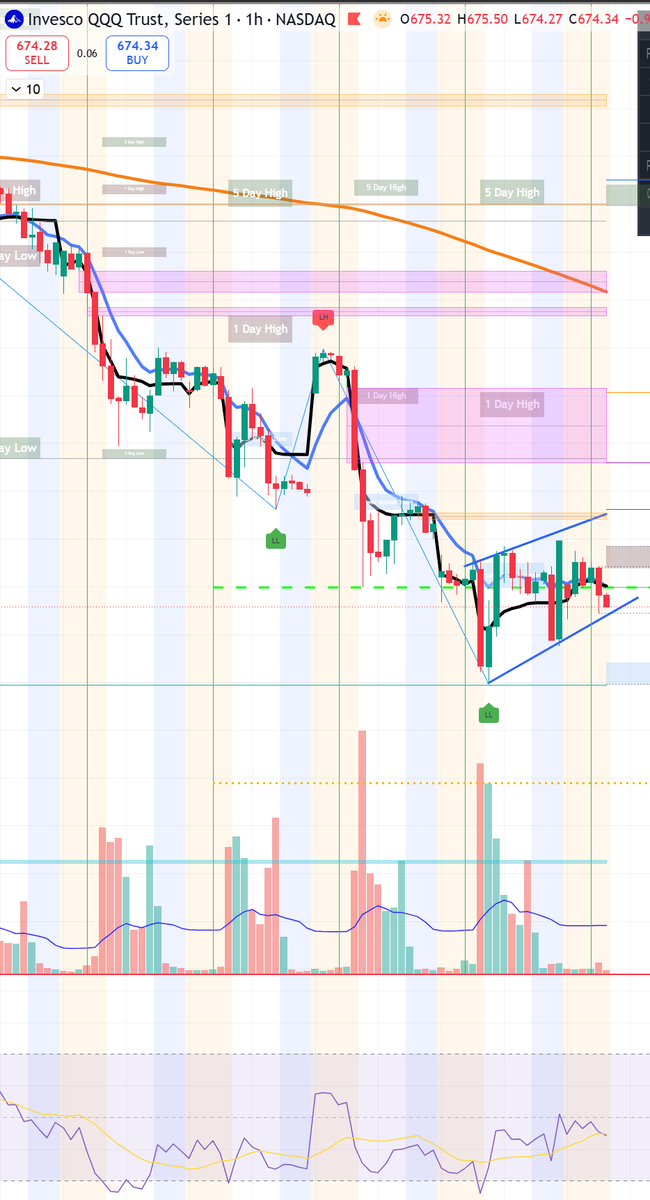
not financial advise, just sharing what I see :
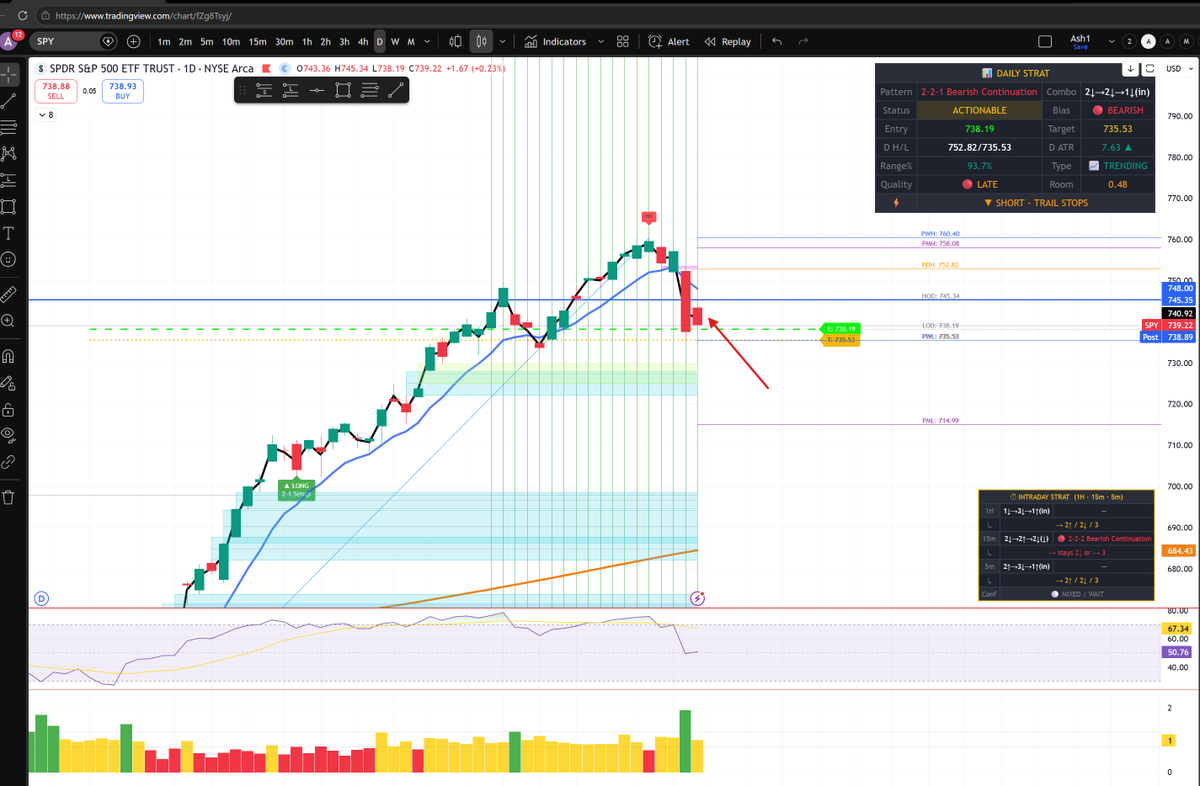
This chart shows the exact breakout execution of that Inside Bar pattern on the S&P 500 Daily chart.
The market has given a clear directional signal by breaking down below the Inside Bar's low, shifting the short-term bias to the bearish side.
Here is the technical breakdown of the price action shown in the image and how to manage the trade setup:
1. The Pattern Breakdown
The Mother Bar (Friday): This is the large red candle on the left that established the broad trading range.
The Inside Bar (Monday): This is the smaller green candle fully contained within Friday's high and low. As we noted, it represented compressed volatility and market indecision right before the CPI inflation data release.
The Trigger Bar (Today): The current active candle has completely broken out of Monday's range to the downside. It broke below the Inside Bar low of 7,395.13, signaling that sellers have taken back control of the immediate narrative.
2. Market Bias: Bearish Continuation
Because the breakout happened to the downside, the inside bar acts as a Bear Flag continuation pattern. The market paused for one day to digest Friday's drop, coiled its springs, and is now continuing the downward momentum.
Immediate Target: The sellers are currently targeting a retest of the 50-day Moving Average (the blue line rising from the bottom left) or the psychological support handle near 7,300.
Macro Context: While the long-term trend remains structurally bullish (higher highs and higher lows on the macro frame), the short-term frame is in a healthy, necessary corrective phase to shake out weak-handed leverage.
3. How to Trade This Setup (The Playbook)
If you are managing positions or looking to trade this specific price action structure, institutional traders typically look at it like this:
The Short Entry: The moment the price crossed below 7,395, the short trigger became active.
Stop Loss Placement: If you take a short ride on this breakdown, your structural invalidation point (Stop Loss) goes right above the top of the Inside Bar at 7,467. If the price reverses and climbs back over that level, the bearish breakdown is completely invalidated.
Managing Long Positions: If you are holding long-term equity or ITM LEAPs, this breakdown suggests holding off on adding new capital just yet. Let the market find its true floor near the 50-day moving average or major horizontal support before buying the dip.
The "coiled spring" has uncoiled to the downside. Keep a close eye on whether the daily close stays below that 7,395 level to confirm the sellers have fully locked it in!