🚨 COVID HISTORY IS ABOUT TO REPEAT...
Look at this yourself:
COVID-19 ( 2020-2021 ):
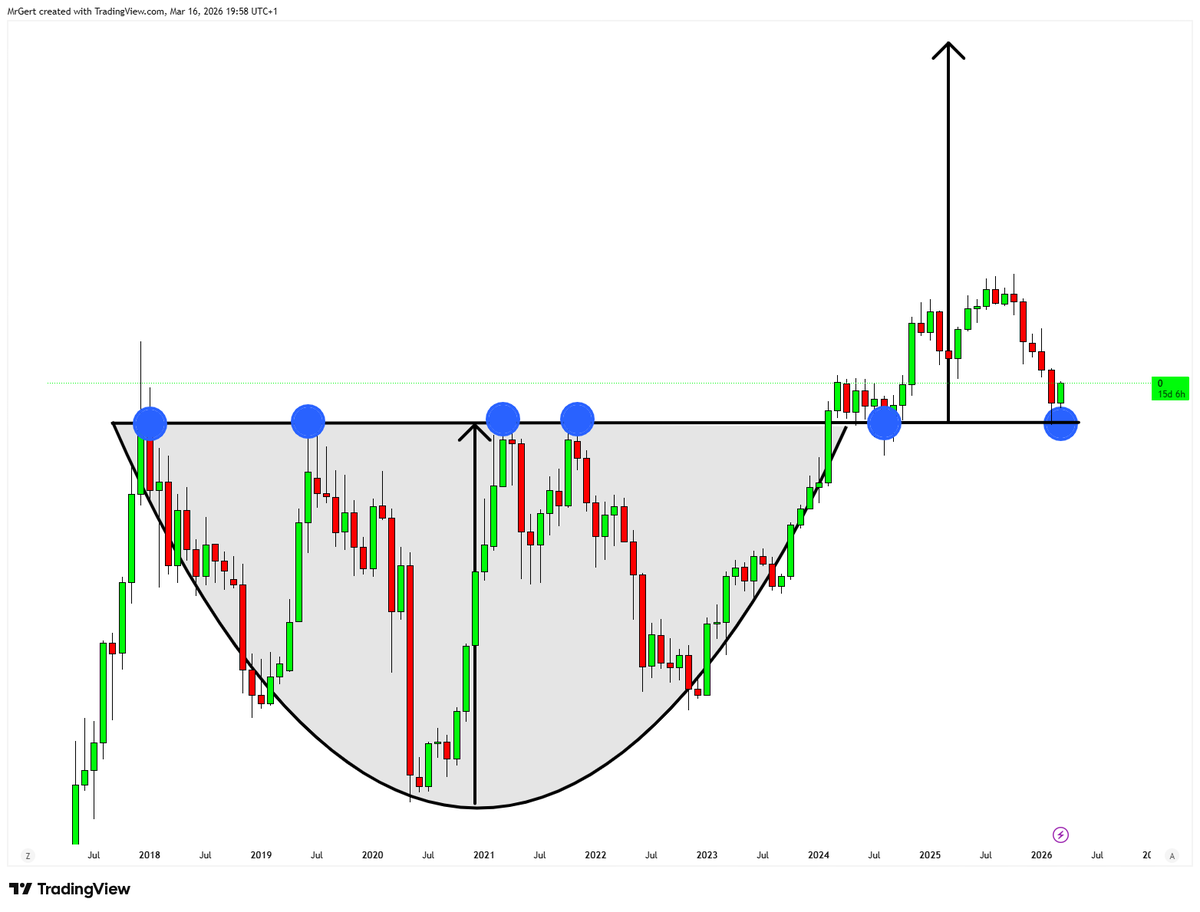
Starting from 2018, market formed an “Expanding Triangle” structure built in 6 stages
Stage #5 - market top, pure euphoria right before the global crash
Stage #6 - local bottom, ~-36% drop in just 2 weeks...
HANTAVIRUS ( 2026-???? ):
Now index is forming exact same “Expanding Triangle” again - same 6-stage structure
We’re currently at Stage #5 - new ATH printed, with full-blown euphoria and “infinite growth” narrative spreading
Next is Stage #6 - implying a potential -30%+ move, with 4,600-4,800 zone as first downside target
This same structure previously signaled one of the biggest crashes... and now history may be repeating
When the market is literally “screaming” a collapse is coming - I exit risk
Don’t make a major mistake - turn on notifs, I’ll update
Starting with the most observable part of the chart, which is obviously the next move—as people always want to know what’s going to happen next. This chart is purely about psychology, and we are at a point where market participants are no longer taking political statements at face value. The market has been pricing in a soft landing since 2022.
You can see that every time political figures come out trying to disrupt the normal functioning of the market, it reacts in the short term. However, in the long term, the market maintains its vision of a soft landing. The last part is the most explosive: the market will realize that there is nothing that can stop it from fully pricing in a soft landing. Each market disruption is being instantly absorbed, while political figures simply cannot trigger a recession—not in 2022, not with the tariff wars, not with the new conflicts affecting the oil situation.
The market will effectively say: “Oh, so they can’t trigger a recession—which means more rate cuts, more cheap money to buy stocks, and no more traditional 4-year cycle.” This will build confidence, and sentiment will instantly flip from extreme fear to extreme greed in a short period of time.
Now, let’s talk about timelines. There is the typical 4-year cycle with a low expected around October this year. That timeline is only valid if we get a recession this year. If a recession does occur, it will completely invalidate the scenario I’ve outlined here, as it would trigger another wave of QE and resume a full market cycle.
But if that does not happen, and by the midterms we are trading back up to near all-time highs (or even new ATH), there is more than an 80% chance of entering a blow-off top phase until February–March 2027. All markets would skyrocket, completely ignoring the 4-year cycle low fueling even higher momentum as investors and retail traders realize they are missing the train. Then, overnight, everything would look good—until the long-delayed recession finally hits, bringing a reality check to everyone. By mid to end of 2027, we could be trading back at roughly the same levels we have today.
Shortly after, complacency would set in as we stay flat for 1 to 1.5 years without making a new ATH. This would lead us into the next Shmita year, printing a normal correction—but this time it would be doubled down, taking us back to around COVID levels -70/80% (the initial spark of the entire move we see today).
Now that we’ve covered a good part of what’s going to happen (possibly), I also want to add a few psychological signs, particularly the big IPOs. The biggest IPO ever was Saudi Aramco in December 2019, right before the COVID crash. The second biggest was Alibaba at only about $170 billion. That huge gap between the top one and the rest should tell you something.
Today, we have SpaceX at $1.5T–$1.75T early IPO valuation, followed by OpenAI at around $850B–$1T, and Anthropic at around $380B-$600B. When big companies reach such enormous valuations to raise capital, pullbacks tend to follow (maybe not instantly, but shortly after). Why? Because to deliver even a 2x or 3x return from those levels the entire world will become broke as every single human would need to put a penny into it, just like they did with gold.. That’s why these mega-IPOs tend to come when the cycle has either fully topped out or is in the process of topping out.
The small euphoria generated by these IPOs especially the SpaceX one will hype investors into believing the economy will expand (further than Earth) creating a new paradigm right before the long-awaited recession hits. From there, markets will only make lower lows and lower highs.
As for low-cap stocks and crypto, they will benefit from both the soft-landing blow-off top narrative and the fact that the broader stock market can’t make new ATHs as we approach 2028/2029 because the capital will shift back into speculation. While the SPX makes a lower high, these small assets will blow out even more aggressively, making new highs and catching up with what has been leading for years generating hundreds of billions in market cap for names that are currently under $10 billion.
To end clearly: the invalidation of this plan would be if the 4-year cycle plays out exactly as in the past, meaning we are already in a recession, with the top already in, and we head down into October—after which we would start another full market cycle, very simple.
A few key tools to watch to determine whether we are in a recession or successfully avoid one:
-The bond market (yields above 4.4% signal recession risk, under 4.4% with controlled inflation and further cuts supports a soft landing).
-The DXY (key levels: 100.8 to 102).
-Gold returning to all-time high (recession risk)
-The current conflicts and oil prices (oil falling back into the 60s going into summer would support the soft-landing narrative).
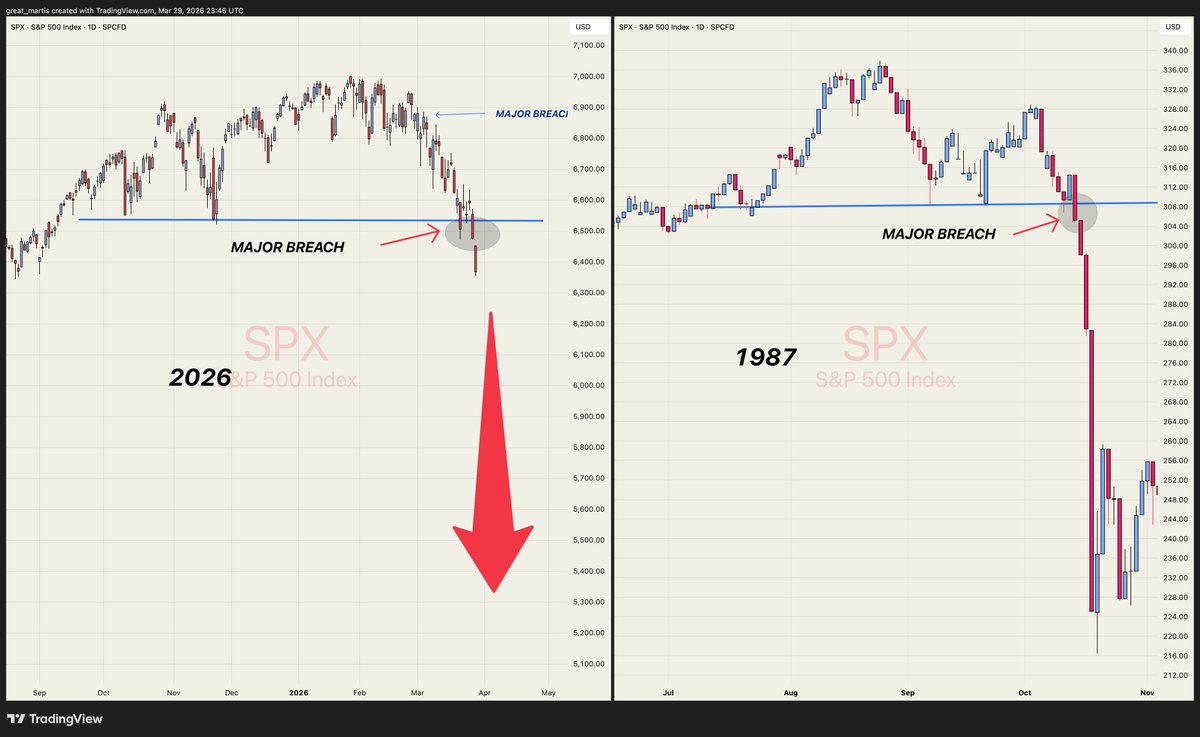
🚨MARKET CRASH 🚨
1987 vs 2026
I was recently asked if we might be nearing a 1987 style market crash.
The short answer is NO.
Markets today have the PPT (Plunge Protection Team) and circuit breakers in place. BUT we can definitely witness a sharp "tear drop" event, as shown in the chart.(Below)
In 1987, the crash was triggered when a major multi month distribution support level was breached from all time highs. That led to a mind bending 30% drop in just a few days (with the infamous Black Monday single day plunge of over 22%).
Today, we have a similar technical setup. Unless something changes, we might see a tear drop event.
This rare but majestic candle is not only a possibility ... it’s a high probability if panic and fear kick in.
It doesn’t take much for the “throw the baby out with the bathwater” scenario to unfold.
This week is extremely important.
I wish you all good luck, safety, and health.
Stay vigilant, Remain diligent and most importantly Remain informed.
Yours truly,
The Great Martis✨
Jag gick igenom hela världskartan och tittade nu.
Sverige 🇸🇪 har lägst kolintensitet i hela världen med 21g/kWh.
Tyskland 🇩🇪 som snart satsat 10 000 miljarder på Sol och Vindsnurror ligger exempelvis på 202g/kWh.
Hur kan det komma sig att Klimathoaxen ens är en fråga i 🇸🇪? 🤔
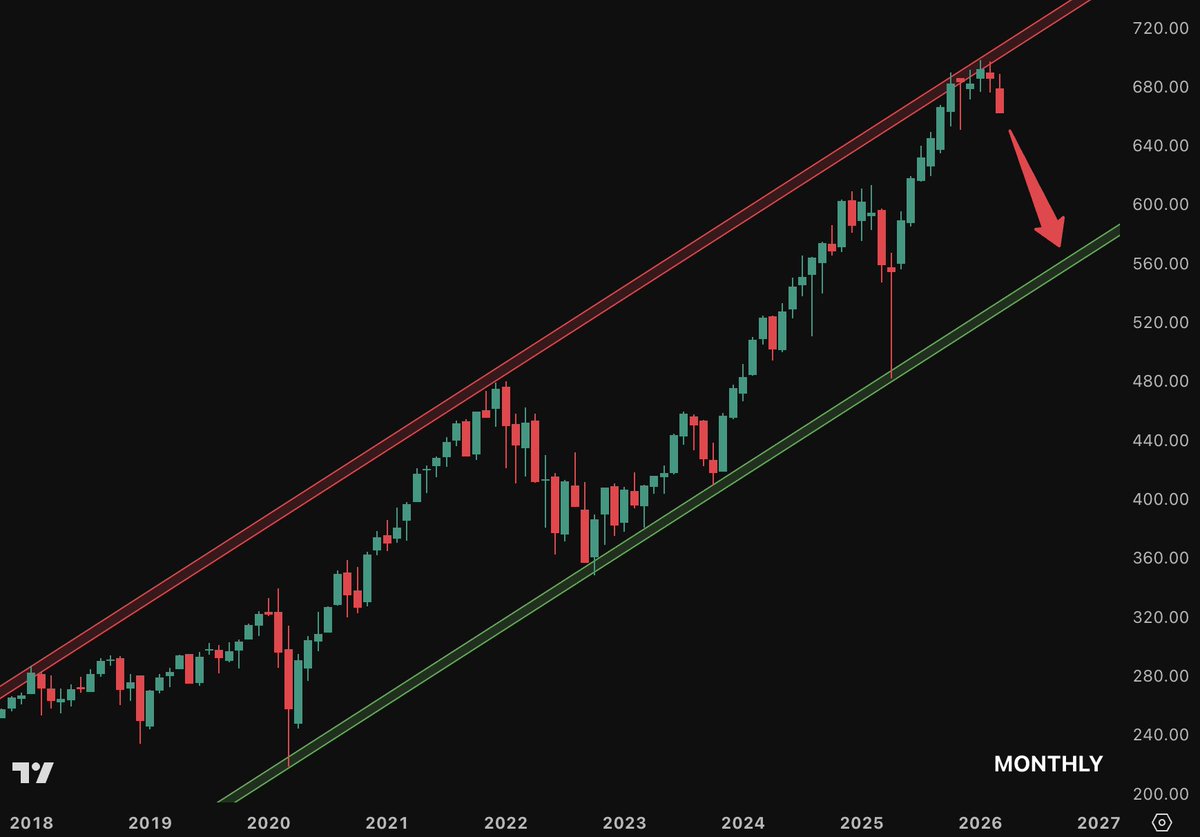
#Bitcoin is echoing GOOGL’s pre–blow-off ’07: same Bollinger Bandwidth squeeze, same Elliott Wave rhythm.
When everyone is fixated on “diminishing returns,” this kind of tightening often precedes the opposite: a final expansion before bear market.
Ultra-bullish setup 🚀
#Bitcoin has rebounded from the lower trend line of the channel on the weekly close.
From here, my primary scenario remains a move toward the upper boundary of the channel, completing wave (5) of ⑤....
...completing the bull market which started in 2009.
$BTC / M1 looks ready to abolutely melt faces, like it did in 2017.
7-year rounded bottom has broken out, got successfully retested both on LTF and HTF now.
2026 downtrend broken → confirmed with a clean LTF retest and higher high.
Now looking for a HTF throwback into the trendline around ~$68.3K.
Key level to determine continuation.