Act as a senior data analyst and dataset engineer.
Generate a realistic, clean, analysis-ready dataset for [sector]
Dataset requirements:
- Number of rows: [e.g. 500, 1,000, 10,000]
- Columns needed: [list all columns]
- Data type for each column: [text, number, date, category, etc.]
- Realistic distributions and patterns (no random assumptions)
- Include real-world inconsistencies where necessary (missing values, duplicates, typos, outliers) if relevant.
- Make it suitable for: [Excel practice / SQL analysis / Power BI dashboard / Portfolio project / ML, etc.]
Output format:
- Present as a clean table
- Make column names clear and professional
- Ensure the data is realistic and logically consistent
Extra:
- Briefly explain the business context behind the data
- Suggest 5–10 analysis questions that can be answered from the dataset
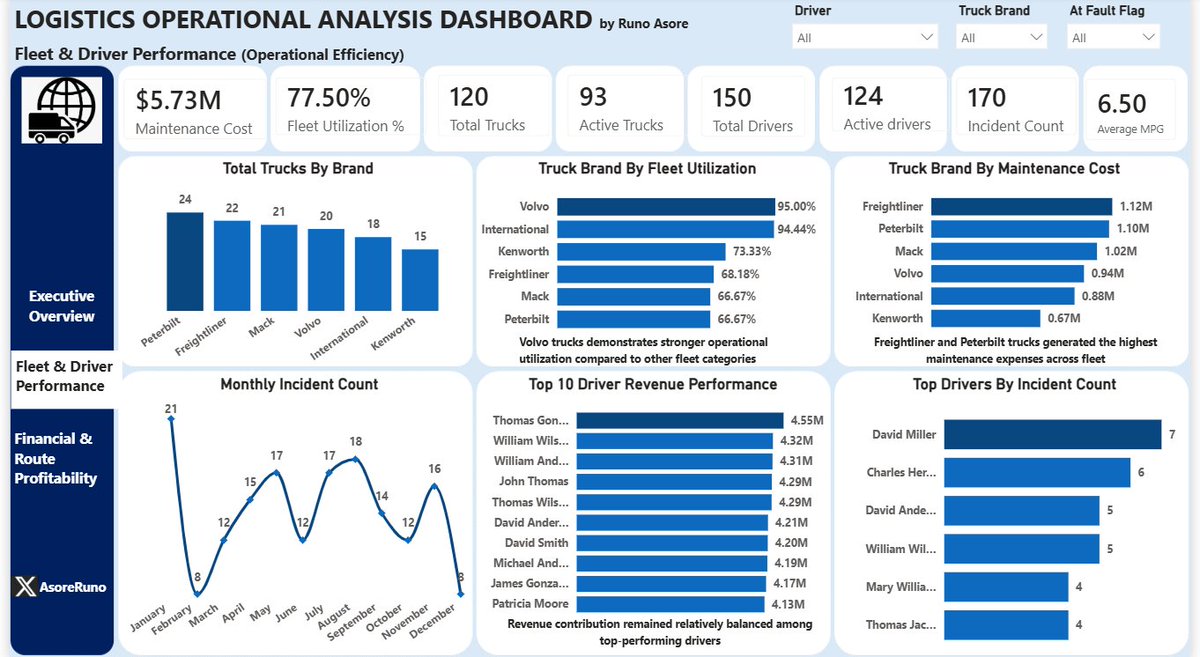
Just completed my Capstone Project using Power BI 📊🚛
Special shoutout to @ezekiel_aleke for the guidance and mentorship throughout this learning journey 🙌
And big appreciation to @TechSphereAcad for providing a practical, industry-standard learning experience.
#DataAnalytics
🔹 Fleet utilization and incident trends revealed areas for operational optimization.
This project helped strengthen my skills in: 📌 Data Cleaning
📌 Data Modeling
📌 DAX Calculations
📌 KPI Development
📌 Dashboard Design & Storytelling
📌 Business Insight Generation
✅ Total Profit — $158.55M
✅ Operational Cost — $103.98M
✅ 85K Total Trips & Loads
✅ 77.5% Fleet Utilization
✅ 56% On-time Delivery Rate
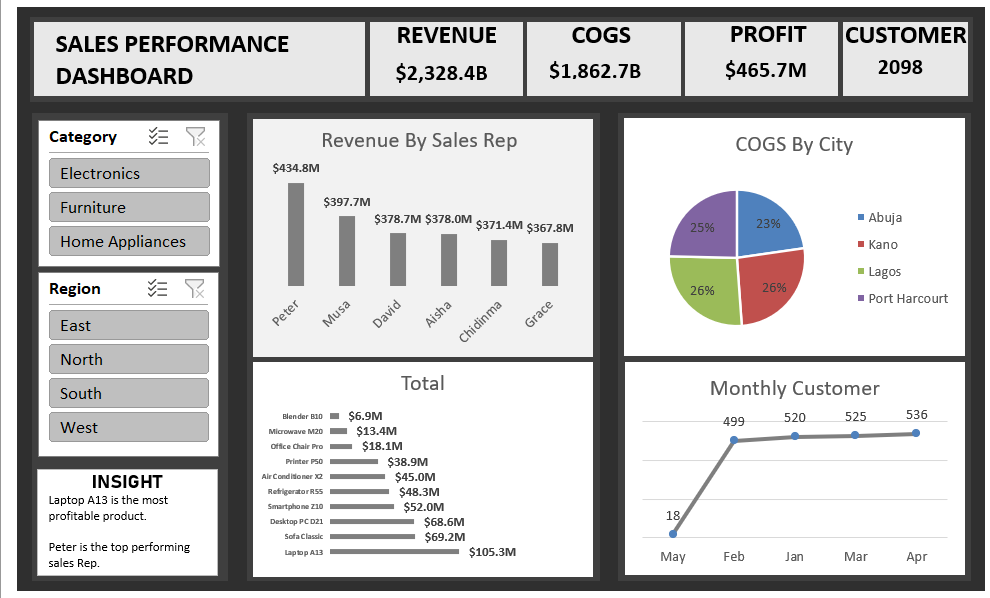
Some key insights discovered: 🔹 Revenue remained relatively stable across the year despite fluctuations in load volume.
This project focused on transforming raw logistics datasets into interactive dashboards that provide insights into:
• Executive business performance
• Fleet & driver efficiency
• Financial and route profitability
Key KPIs analyzed: ✅ Total Revenue — $262.53M