📌 How to read weekly liquidity like a macro desk
TGA → Pulls or injects cash into markets
RRP → Risk capital parked vs. deployed
Fed balance sheet → Liquidity floor
How gold, crypto, and stocks price liquidity differently
Follow AssetPulse
Frameworks over narratives.
Signal over noise.
Gamma wall. Vanna flow. Gamma squeeze.
Everyone uses these terms. Few can explain them.
Built a step-by-step guide so you never have to guess what a GEX/VEX heatmap is telling you again.
https://t.co/C60P0TgNjx
#OptionsFlow#GEX#SPY
📊 Since 2020, U.S. M1 jumped from ~$4T to over ~$18T.
That means a massive share of the dollar supply was created in just a few years.
Inflation isn’t a mystery. It’s what happens when money grows faster than goods, labor, and energy.
“Everyone’s freaking out, so let me add some context:
Yes, EU Parliament passed this Jan 22. Yes, there’s a Cloud & AI Act coming Q1 2026. And yes, US companies hold 70-80% of Europe’s ~$100-120B cloud market right now.
But contracts don’t just evaporate. This plays out over 3-5 years as procurement policies change and deals renew.
Is it a risk? Absolutely. Is AWS dying next quarter? No.
This is a structural shift, not a black swan event. Position for the trend, not the headline.”
💧 U.S. Liquidity Check (Jan 14 → Jan 21)
🏦 Fed balance sheet
$6,581.7B → $6,584.6B
Up $2.9B — basically flat. More maintenance than stimulus.
🏛 Treasury General Account (TGA)
$779.2B → $869.3B
Up $90.1B — that’s cash being pulled into the government’s account.
💵 RRP
$3.223B → $3.344B
Up $0.1B — small move, but still a drain.
🔁 Net liquidity:
+2.9 − 90.1 − 0.1 = −$87.3B
In plain terms, money left the market.
🏦 Bank reserves (WRESBAL)
$3,049.6B → $2,954.9B
Down $94.7B — less cash parked at the Fed for banks.
A lot of people are saying “the Fed is injecting liquidity.”
But this week, the flow actually ran the other way.
Fiscal moves overwhelmed monetary support.
Cash shifted out of the private system and into the Treasury.
Follow for the real plumbing behind the headlines.
@cryptorover “Everyone’s yelling ‘shutdown.’ The real danger is the cash drain. Last week alone (Jan 14–21) the Treasury parked ~$90B into the TGA — that’s $90B quietly pulled out of markets. Crypto doesn’t care about politics. It cares about liquidity. And that tank is already running low.”
Geopolitics in 2026 isn’t about flags. It’s about leverage. The U.S. anchors Taiwan for advanced chips, China deepens ties in Canada for energy and critical minerals.
China refines ~60% of rare earths, the U.S. still takes ~75% of Canada’s exports, and Canada supplies ~60% of U.S. crude.
Everyone’s playing the same game — control the inputs, shape the outcome. That’s the real battleground.
A stock trading at about 1.07× book value with a $5B market cap isn’t being treated like a business. It’s being treated like a balance sheet.
Every once in a while, that’s where the opportunity shows up.
This isn’t about chasing fast growth or a flashy story. It’s about owning a platform with permanent capital that can keep reinvesting, making smart deals, and compounding quietly in the background — and doing it when the market is basically pricing the assets, not the future.
When it works, you get paid two ways:
1. Book value keeps growing.
2. Market eventually decides the business deserves a higher multiple.
That’s private-equity logic, just playing out in public.
Example: $WTM (White Mountains Insurance Group)
Trading around 1.07× book on a $5.1B market cap. Insurance-backed holding company, real operating businesses, long-term capital, and a model built around compounding book value rather than chasing quarterly EPS.
You’re paying roughly what the assets are worth — and keeping the upside if management keeps doing their job and the market eventually gives it more credit.
@KobeissiLetter “7 major policy shifts in 4 days. Every single one favors asset holders over wage earners. Coincidence? If you’re not positioned in hard assets right now, you’re on the wrong side of the largest wealth transfer in modern history.”
@KobeissiLetter 🇨🇦 If the U.S. is threatening 100% tariffs and China escalates risk, that’s a lose-lose.
Why not follow the EU playbook — diversify into India (energy, minerals, agri) while keeping U.S. ties stable?
Trade is leverage, not loyalty.
Copper isn’t a metal anymore.
It’s the wiring of the global economy.
By the numbers:
• Demand (Bloomberg est.): ~40 million tons by 2040
• Today: ~26–27 million tons/year
➡️ That’s a +50% jump in less than 15 years
Energy transition math:
• EV uses 3–4x more copper than a gas car (~80 kg vs 20–25 kg)
• A single offshore wind farm = 5,000–8,000 tons of copper
• Grid expansion (global): $20+ TRILLION capex by 2050
AI & data centers:
• 1 hyperscale data center = 2,000–5,000 tons of copper
• Global AI DC buildout (2030 est): $3–5 TRILLION
Copper = power + cooling + racks + transformers
Supply reality:
• New copper mine lead time: 10–20 years
• Top 10 mines supply ~40% of global output
• Ore grades have fallen ~30–40% since the 1990s (more rock, same metal)
Shortage math:
• Even a 1–2M ton annual deficit can move prices 30–50% historically
• Inventories today = weeks, not months, of global consumption
Big picture:
Gold protects wealth.
Silver tracks money.
Copper measures civilization.
If demand hits 40M tons, the world isn’t “buying copper.”
It’s building a new industrial system. ⚡🤖🌍
“China will eat them up.” Let’s put real numbers on that claim.
By the math:
• China–Canada trade: ~$100B/year
• U.S.–Canada trade: ~$900B+/year (Canada’s #1 partner by a mile)
Global leverage:
• China share of world manufacturing: ~31%
• U.S. share: ~16%
• EU share: ~14%
Greenland angle:
• Rare earth & critical minerals market (2030 est): $400B+/year
• China controls ~60–70% of global rare earth processing
• NATO/US control most Arctic military infrastructure
Capital & security math:
• NATO defense spending: $1.3T+/year
• China defense budget: ~$300B/year
Poll for X 👇
If you’re Canada, what matters more long-term?
🇺🇸 Security + NATO trade ($900B+)
🇨🇳 Manufacturing + China market ($100B)
This isn’t politics.
It’s a balance-sheet decision at a national scale. 🌍📊
If BlackRock’s Rick Rieder becomes Fed Chair, this isn’t a personnel change. It’s a market structure shift.
By the numbers:
• BlackRock AUM: $9+ TRILLION — larger than the GDP of every country except the U.S. & China
• Treasury market: $27–28T outstanding
• U.S. debt: $34T+ with ~$1.2T/year interest expense run-rate
Policy leverage math:
• A 50 bp (0.50%) move in yields = ~$170B/year change in federal interest costs
• Fed balance sheet: ~$7T+ — even a $500B QE/QT swing can move long-end rates by 10–30 bps
Capital flows:
• Global bond market: $130T+
• If just 1% reallocates on a policy signal → $1.3T in flows
What makes this different:
• Most Fed Chairs come from academia or banking.
• This would be direct capital-markets DNA at the helm of monetary policy.
Big picture:
The next cycle won’t just be about rates.
It will be about how trillions in global capital are steered. 🌍📉💼
Zoom out. Bitcoin isn’t trading in a “zone.” It’s repricing against the world’s balance sheet.
• Global M2: ~$105 TRILLION
• Sovereign debt: $300+ TRILLION
• U.S. interest expense run-rate: $1.2T/year
Now the math:
• Bitcoin market cap: ~$2T
• If BTC just absorbs 1% of global liquidity flows → $1T inflow
That alone implies a ~50%+ repricing from here.
In the last cycle:
• Gold +$3.9T in market cap
• Silver +$1.3T
• BTC is still smaller than one year of U.S. deficits
This isn’t about “expensive vs cheap.”
It’s about how much of a $100T+ monetary system Bitcoin is allowed to become. 🌍📈
This isn’t an “energy trade.”
It’s a CPI + bond market shock in the making.
By the numbers:
• Natural Gas: +25–40% in weeks = +$0.2–0.4pp to headline CPI (energy passes through fast)
• Crude Oil: Every $10 move in oil adds ~0.2–0.3pp to CPI within 3–6 months
• Dollar: A 5% DXY drop historically lifts global commodity prices 10–15%
Now connect it to bonds:
• U.S. debt: $34T+
• A 0.50% jump in Treasury yields = ~$170B/year in added interest expense
• Rising CPI = higher-for-longer rates = heavier debt spiral math
Global transmission:
• Energy imports = $3T+/year globally
• Europe & EM feel it first → FX stress → more USD selling → commodity feedback loop
Big picture:
Energy isn’t inflating.
It’s re-pricing the cost of money, trade, and sovereign debt — all at once.
This is how a commodity move becomes a macro event. ⚡📈🌍
Amazon cutting up to 16,000 jobs sounds big — but here’s the scale:
• Amazon global workforce: ~1.5 million employees
• 16,000 jobs = ~1.1% of total headcount
Cost math:
• Avg fully-loaded cost per employee (tech + ops blend): $120K–$150K/year
• 16,000 cuts = $1.9–$2.4B/year in potential cost savings
But look at the revenue machine:
• Amazon revenue (TTM): ~$600B+
• That savings = ~0.3–0.4% of annual revenue
Where the leverage really is:
• AWS operating margin: ~30%+
• North America retail margin: low single digits
➡️ A 1% improvement in AWS margin can move more profit than thousands of job cuts in retail/HR/ops
Big picture:
This isn’t about survival.
It’s about re-allocating capital from people to compute, AI, and data centers.
Amazon isn’t shrinking.
It’s shifting from labor-heavy growth to capital-heavy dominance. ⚙️📡
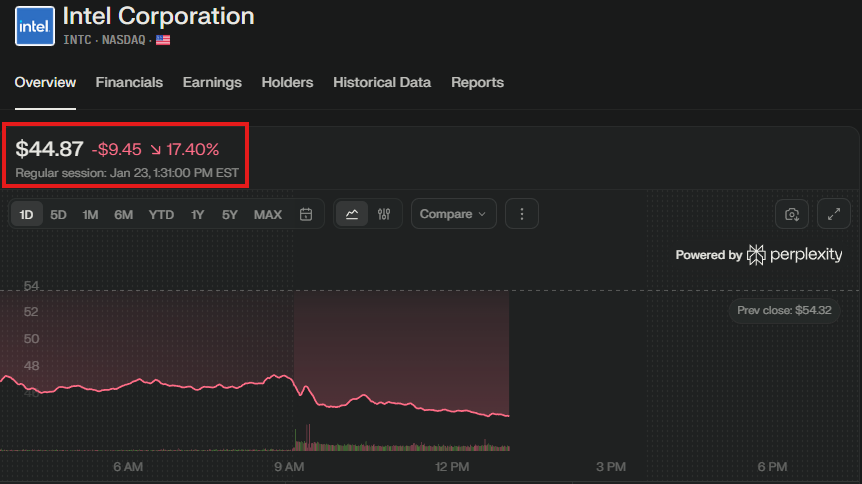
Why $INTC is really selling off — by the numbers:
1) Capex vs. Cash Reality
• Intel’s foundry + fab buildout is $25–30B/year in capital spending
• Last year, Intel generated ~$9–10B in operating cash flow
➡️ That’s a $15B+ annual funding gap before subsidies or debt
2) Government Bet Underwater
• U.S. support (CHIPS + incentives + direct exposure) is tied to tens of billions in domestic fabs
• A -$4B mark-to-market hit in one session implies ~$25B+ wiped from Intel’s equity value today
3) Market Share Math (AI Era)
• Data center GPU share: NVIDIA ~80%+
• Intel accelerator share: low single digits
• Every 10% of the AI compute market = ~$50–70B/year in revenue opportunity
➡️ Intel is missing a trillion-dollar decade TAM
4) Margin Compression
• Intel gross margin (2024): ~43%
• NVIDIA gross margin: ~75%
• That spread means NVIDIA makes ~$0.75 per dollar of sales while Intel keeps ~$0.43
5) Debt & Subsidy Dependence
• Intel debt: ~$50B+
• Interest expense rising into a 5%+ rate world
• CHIPS subsidies cover ~10–20% of fab costs, not the full bill
Big Picture:
This isn’t just a stock drop. It’s the market questioning whether Intel can fund a $100B manufacturing comeback while losing the most profitable computing cycle in history (AI).
BREAKING: Intel, $INTC, extends its decline to -17% on the day, now on track for its biggest daily drop in nearly 3 years.
The US government's position in Intel is down -$4 billion today.
📍 Iran’s oil exports remain globally relevant — even after Trump’s sanctions threat.
📊 Current flow:
• Iran is exporting roughly ~1.6–2.1 million barrels per day (bpd) of crude, condensate & fuel oil in 2025. That’s about 4.0–4.5% of global crude oil trade.
🌍 Global impact:
• A ~4% share of the global oil market is significant — it can move prices if disrupted and affects supply balances.
🤝 Who’s still buying?
🇨🇳 China — ~80–90% of Iran’s exports go to China, making it by far the biggest buyer.
🇦🇪 UAE, Syria, Venezuela take much smaller shares of the remainder.
📌 How it survives sanctions:
• Iran uses ship-to-ship transfers and a “shadow fleet” to keep oil flowing despite sanctions. These hidden vessels handle a noticeable share of global crude flows.
🔍 Bottom line:
Even after threats and tariffs, Iran still:
✅ Moves millions of barrels daily
✅ Supplies a meaningful % of global oil
✅ Counts China as its primary trading partner