@KillaXBT Volume doesn't lie.
Distribution = volume at the highs.
Accumulation = volume at the lows.
$64K POC. Volume building quietly.
The chart is telling you exactly what's happening.
Most just don't know how to listen. ₿
How to Identify Smart Money Before a Token Pump
Smart money is not just big wallets. It is wallets that buy early, win consistently, and accumulate while the chart still looks dead. The goal is to spot their positioning before the crowd arrives.
What smart money actually means
In on-chain terms, smart money means addresses that:
- Enter tokens before major moves
- Keep win rates above 60% and profit-to-loss ratios of at least 2:1 across many trades
- Stay profitable across different market cycles, not just one lucky pump
- Often interact early with new or thin contracts
You must filter out exchange hot wallets and market makers. Their size is liquidity, not a directional bet.
Core signals before the pump
Watch for these patterns:
- Quiet accumulation: price is flat, volume is low, but holder count and quality wallets slowly rise
- Multi-wallet convergence: several proven profitable wallets buy the same low-cap token within hours or days
- Exchange flow shifts: net withdrawals by labeled smart wallets often signal accumulation; large deposits after a rise often signal distribution
- Early LP, staking, or bridge activity before any hype
Avoid chasing sudden volume spikes with no prior accumulation. That is usually retail FOMO or a manufactured move.
Practical step-by-step workflow
1. Screen for accumulation
Use DexScreener or similar. Look for low-cap tokens with sideways price and light “dripping” volume over 24–72 hours. Prefer steady early buying over one explosive candle.
2. Identify candidate smart wallets
On Nansen, Arkham, or Lookonchain, pull the token’s top buyers. Keep wallets with meaningful size that are not exchanges or market makers. Check their history: high win rate, strong risk-reward, and activity across multiple tokens. Drop one-hit wonders.
3. Validate the accumulation
On the block explorer, review the last 24–72 hours. Look for steady buys, transfers to colder wallets, and clustered small purchases. Use BubbleMaps or TokenSniffer to confirm no single cluster controls a dangerous share of supply.
4. Cross-check across tokens
If the same wallets keep appearing before pumps, add them to a long-term watchlist. Then watch what those wallets are buying next. This “basket fingerprinting” surfaces future opportunities.
5. Time entry and manage risk
Enter during the flat accumulation phase, not after the vertical candle. Size small. Take partial profits at 2–3x and use trail stops. Early entries can reverse quickly.
Useful tools
- Nansen, Arkham, Lookonchain, DeBank, Dune — labeled wallets and flow analytics
- DexScreener / DexScan — early DEX activity
- Block explorers — raw transaction truth
- BubbleMaps / TokenSniffer — holder concentration and contract risk
Two or three solid tools are enough.
Red flags
- Market-maker or exchange wallets moving large size
- One huge win followed by many losses
- Sudden volume + heavy social hype with no prior accumulation
- Highly concentrated ownership or suspicious contract functions
The real edge
Most people only notice the pump after it starts. Smart money leaves a trail earlier: quiet buys, converging quality wallets, and clean accumulation while attention is still low. Track the wallets with real track records, confirm the pattern on-chain, and enter while the chart still looks boring. That is how you stop chasing and start positioning next to informed capital.
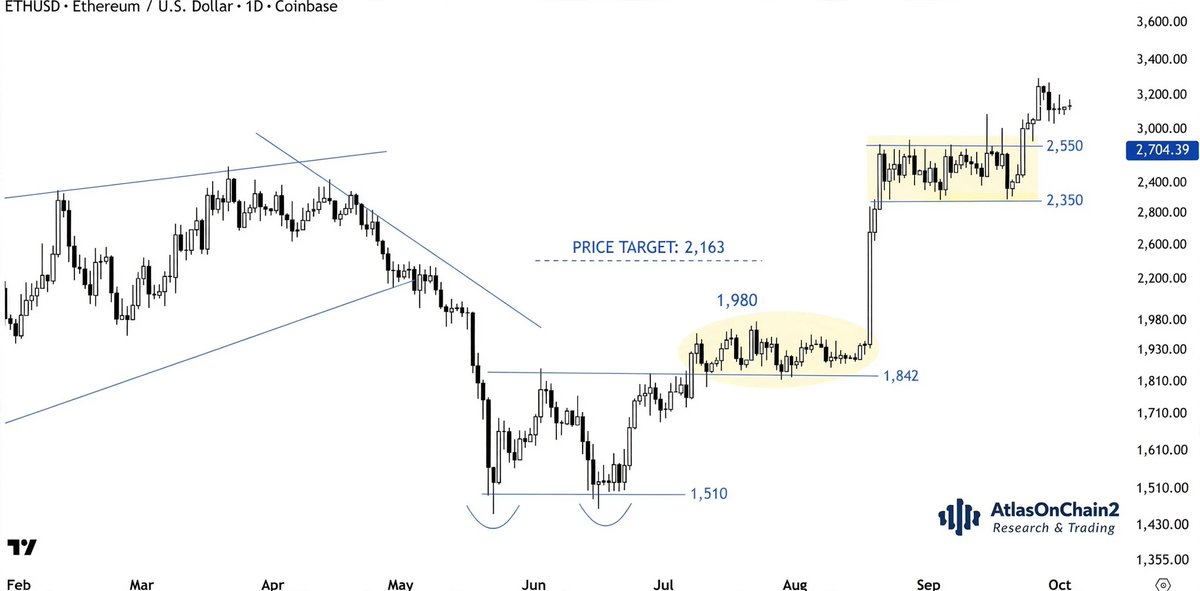
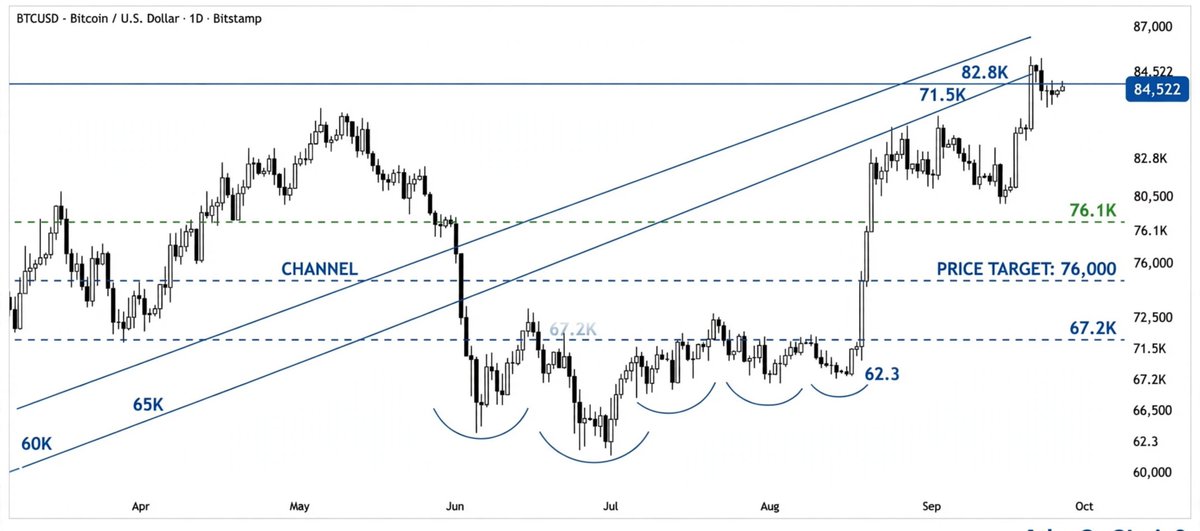
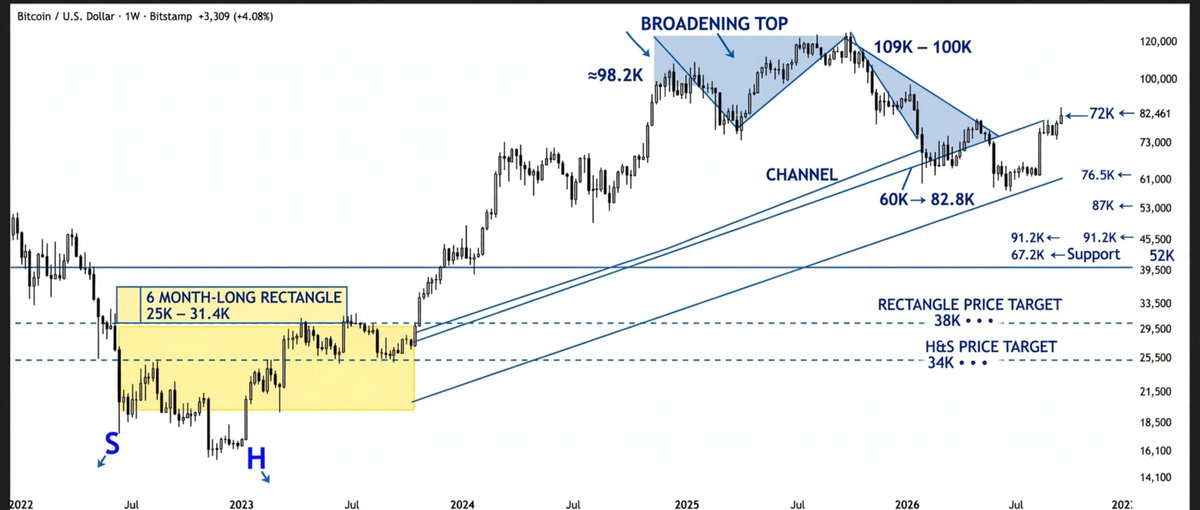
If these are short pullbacks to broken resistance levels, price needs to quickly move away from current levels, resulting in strong weekly closes. $ETH $BTC
Important note on $BTC: as we approach the weekly close, the current candle still lacks the decisive long white body that typically confirms a clean breakout from a major hurdle. Earlier range breakouts and breakdowns on this chart formed strong weekly candles — this one looks hesitant.
8 Phases of Market Cycle 🚨
You Must have heard about the 4 Phases of Market Cycle 👇
< Accumulation, Uptrend, Distribution & Downtrend >
But let me breakdown these 4 Phases into 8 for better understanding of Market Cycle.
[𝘉𝘰𝘰𝘬𝘮𝘢𝘳𝘬 𝘵𝘩𝘪𝘴 𝘱𝘰𝘴𝘵 𝘧𝘰𝘳 𝘧𝘶𝘵𝘶𝘳𝘦]
1) Accumulation Phase :
During this phase, prices are relatively low and stable after a downtrend. Price is boring and keeps ranging for weeks and month.
Experienced investors and smart money start accumulating gradually to avoid price spikes, Retail investors are less involved due uninteresting market and due to Fear of market falling further.
This phase can be recognized if price is Trading Inside a range or forming any reversal patterns like Double Bottoms.
Technical indicators are often Oversold in this area & Negative news have little to no impact on the prices as sell pressure is absorbed by the smart money.
2) Bullish Transition Phase: This phase is a transition from Accumulation to an Uptrend.
Prices start moving up slowly, after breaking the downwards Market structure & starts slowly heading upwards but it's typically a slow and unexciting phase.
This is also the best time to look for buying opportunities.
3) Uptrend or Markup Phase
: During the uptrend, prices consistently climbs up , forming higher highs and higher lows.
As the market attracts more participants, Positive sentiment starts increasing with bullish news having a good impact on the price.
4) Bullish Acceleration Phase: In this phase price moves too quick in a very short period of time, often driven by extreme excitement and greed.
This phase price enters parabola. 'Dips are eaten up quickly' and Technical indicators start entering the OverBought zone.
5) Distribution Phase: In this phase, Initial investors who bought during accumulation phase - start selling to secure profits.
Prices become unstable, choppy or range-bound , and even positive news has minimal impact on the price. Retails are actively involved in this area.
Reversal patterns like Inverse Head and Shoulders, double top, breakdown of 200 MA might indicate a potential trend shift.
6) Bearish Transition Phase: This is a transition phase where New Buyers (Mostly Retails) fail to absorb the selling pressure from the early investors/ smart money who bought during the accumulation phase.
Price transitions from Uptrend to a Downtrend by breaking the bullish market structure.
This is also the best time to sell & take profits.
7) Downtrend or MarkDown Phase:
In this phase, prices consistently decrease, and fear dominates the market. Selling becomes more frequent, leading to Lower Highs and Lower Lows. There are very few new buyers Left to absorb the increased selling pressure.
8) Bearish Acceleration Phase: In this Phase - Prices drop rapidly in a short period, driven by extreme fear and negativity with bad news. Market sentiment becomes very negative, and technical indicators show a strongly oversold signal.
In this Phase there are little to No Postive news left in the market, while negative news have bigger impact on the price causing forced Selling.
Every Market goes through these PHASES in a Complete Cycle, Starting from Lows, going up to Highs, and then coming back down again.
Now Recognizing our position in the Market Cycle is also very important for shaping our Trading Plan /Strategy accordingly :
•Accumulation : (Buy support /sell resistance), DCA and try to build a long term Position
•Distribution : (Buy support /sell resistance), Start to gradually Unload Your Long term Holdings.
•Bullish Transition : Look for Buy/Long opportunities.
•Uptrend or Markup : Buy support/Deviations/ or Pullback into HTF support
•Bearish Transition: Look for Selling /short opportunities.
•Downtrend or Mark Down : Sell Pumps/ Deviations/ Retest into HFT Resistance.
x------------End-------------x
If you enjoyed this Post :
Follow @AtlasOnChain2
Best Time Frames for each trading style:
Scalping - 5 min
Day Trading - 15 min
Swing Trading - 4H
It took me years of trial and error to figure this out
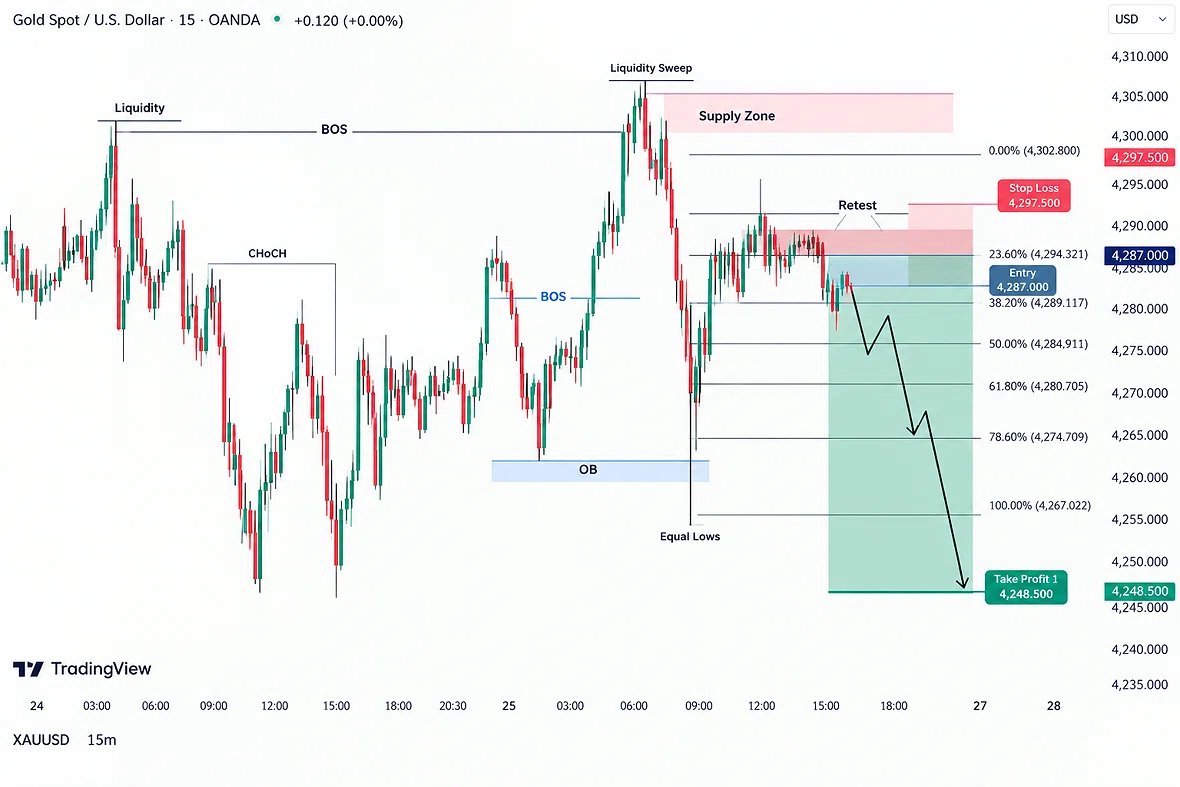
Gold looking ready to drop from this supply zone 👀
15m setup: liquidity sweep + retest of CHoCH/BOS, now sitting at the entry around 4287.
SL: 4297.5
TP1: 4248.5
Watching for the sell-off next week. #XAUUSD#Gold
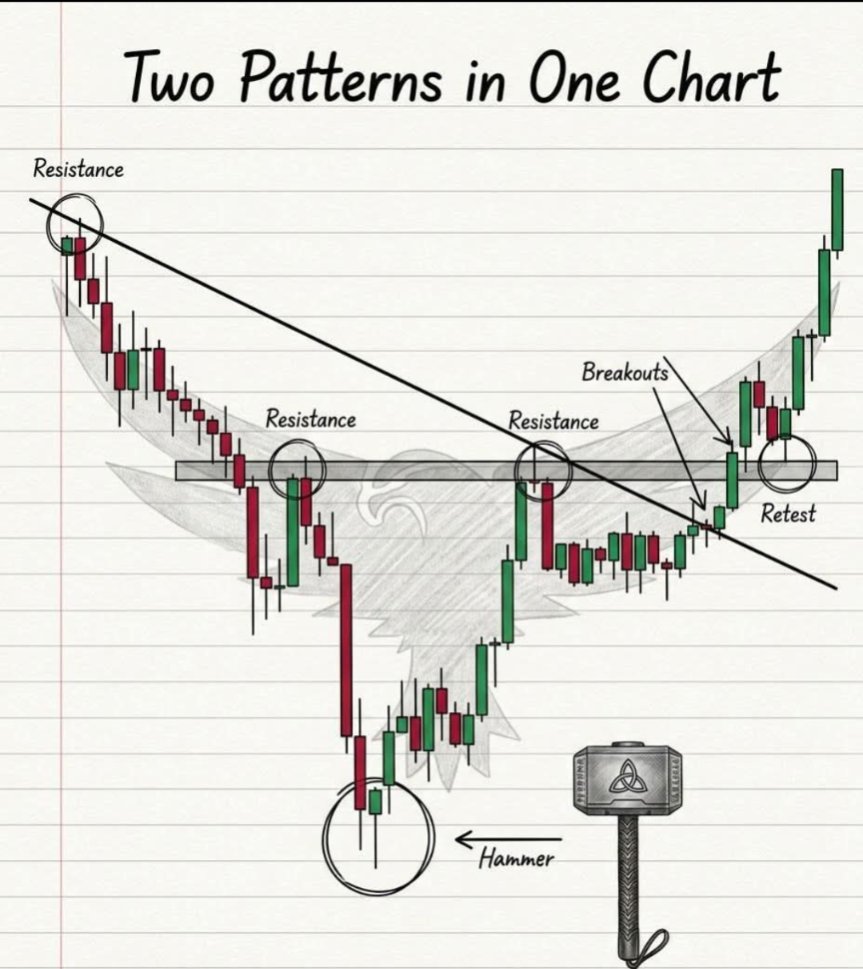
TWO PATTERNS, ONE CHART
DOUBLE CONFIRMATION = STRONG ENTRY!
✅ Hammer reversal signals the end of selling pressure
✅ Breakout above resistance shows buyers taking control
✅ Retest validates the breakout before continuation
This is how disciplined traders combine candlestick signals with breakout strategies to catch high‑probability moves.
Trade smart: respect resistance levels, wait for confirmation, and let the market prove itself before committing.
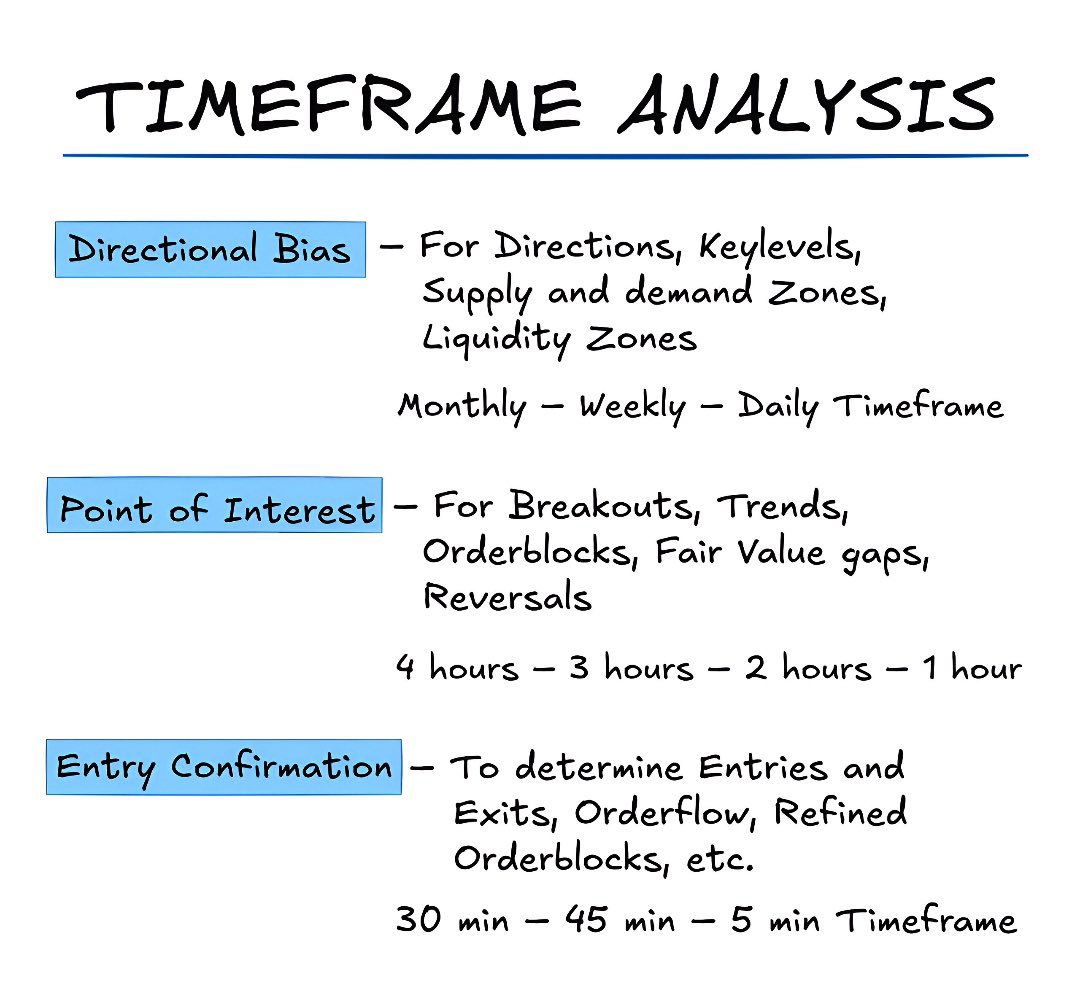
Power of Timeframes
Higher timeframes decide the game.
Lower timeframes only confirm it.
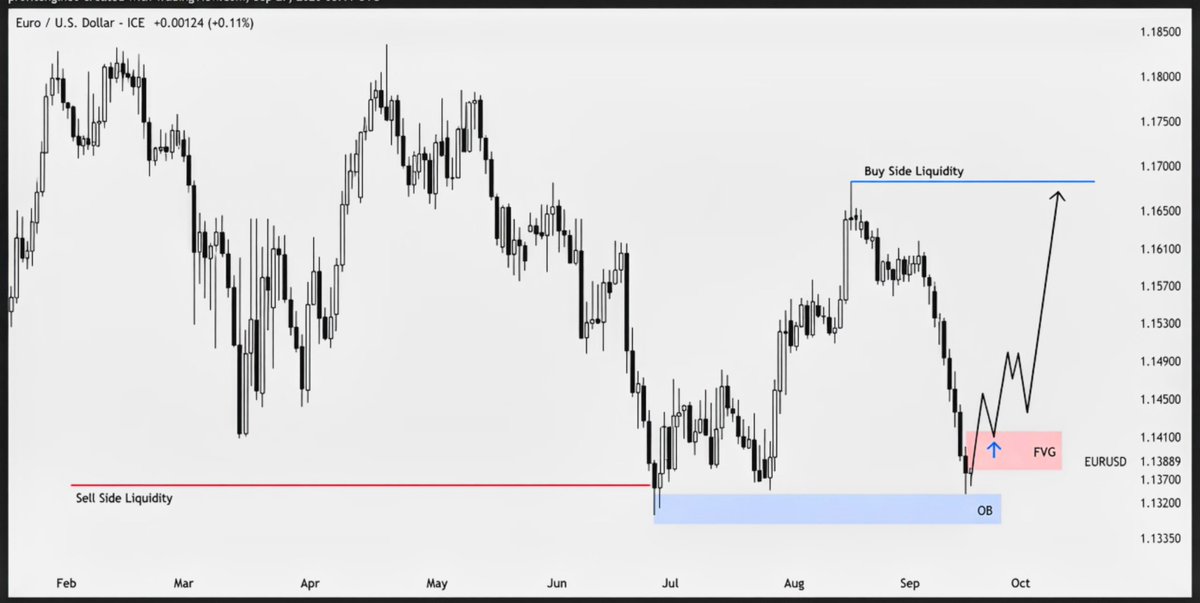
4H → Direction + Key levels + Supply & Demand
1H → Trend + Liquidity + Breaks + Reversals + OB + FVG
5M → Confirmation only
Never reverse the order.
Never trade 5M against 4H.
Structure first.
Entry last.
That’s how professionals stay consistent.
Relative Strength Index (RSI) – Stock Market Indicator
The Relative Strength Index (RSI) is a popular momentum oscillator used in technical analysis. It measures the speed and size of recent price changes to help traders spot overbought or oversold conditions in stocks, commodities, currencies, or other assets.
RSI was developed by J. Welles Wilder and is widely used because it is simple, effective, and works on almost any timeframe.
Key Features of RSI
1. Formula
RSI is calculated with this formula:
RSI = 100 − (100 / (1 + RS))
Where RS (Relative Strength) = Average gain over a chosen period ÷ Average loss over the same period.
The standard period is 14 days (called RSI-14). Traders can change this number depending on their style.
2. RSI Range (0–100)
- Above 70 → Overbought. The asset may be too expensive and could reverse lower (potential sell signal).
- Below 30 → Oversold. The asset may be too cheap and could bounce higher (potential buy signal).
- Between 40 and 60 → Neutral zone. Price is usually consolidating or moving sideways with no strong trend.
Some traders use 80 and 20 levels in strong trends instead of the classic 70/30.
3. Divergence Signals
Divergences are powerful warning signs that a trend may be losing strength:
- Bullish Divergence: Price makes lower lows, but RSI makes higher lows. This often signals a possible upward reversal.
- Bearish Divergence: Price makes higher highs, but RSI makes lower highs. This often signals a possible downward reversal.
4. RSI-Based Trading Strategies
- Overbought/Oversold Strategy: Buy when RSI drops below 30 and sell when RSI rises above 70.
- RSI Crossover Strategy: Buy when RSI crosses back above 30 from below. Sell when RSI crosses back below 70 from above.
- Trend Confirmation: RSI staying above 50 supports an uptrend. RSI staying below 50 supports a downtrend.
Many traders combine RSI with other tools such as moving averages, support/resistance, or candlestick patterns for better results.
5. Best RSI Settings for Different Trading Style
- Day Trading → RSI(7) or RSI(9). Faster signals for short-term moves.
- Swing Trading → RSI(14). The classic and most widely used setting.
- Long-Term Investing → RSI(21) or higher. Smoother readings that filter out short-term noise.
RSI is not perfect. It can stay overbought or oversold for a long time during strong trends. Always use it together with price action and proper risk management.
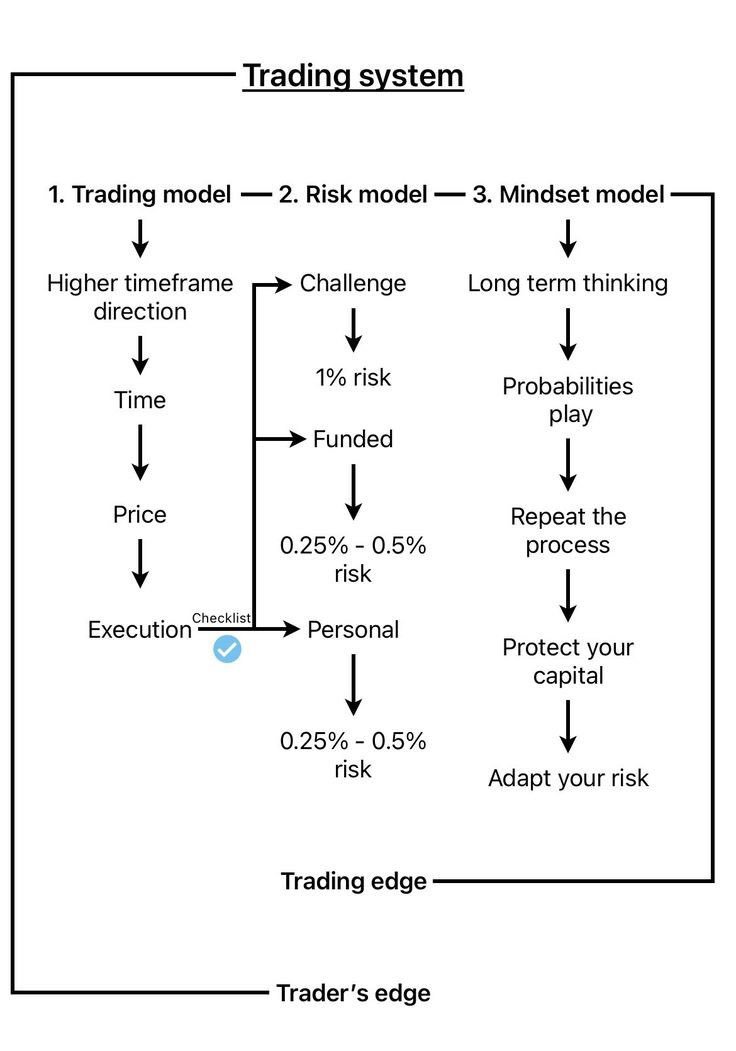
A Trading System
A trading system is a set of clear rules that help you buy and sell in financial markets. It can be done by hand or by a computer program. The goal is to give buy and sell signals based on fixed rules.
Main Parts of a Trading System
1. Market Analysis
- Technical analysis: Looks at past prices, charts, and tools to guess future moves.
- Fundamental analysis: Checks company reports, economy news, and events to see the real value of something.
- Quantitative analysis: Uses math and numbers to find good trades.
2. Strategy Building
- Entry rules: When to start a trade (example: price hits a certain level or a signal shows).
- Exit rules: When to close a trade (example: stop-loss or take-profit).
- Risk control: Ways to keep losses small, like how much money to risk and stop-loss orders.
3. How Trades Are Made
- Manual: You place the trades yourself when the system gives a signal.
- Automated: A computer program places the trades for you automatically.
4. Backtesting
Test the system on old data to see if it worked well in the past.
5. Watching and Improvin
Keep checking how the system is doing and change it if needed to make it better.
Types of Trading Systems
1. Discretionary systems
You use your own judgment and experience. Flexible, but feelings can affect decisions.
2. Systematic systems
Follow strict rules only. Can be fully automatic so emotions stay out.
3. Algorithmic systems
Use complex computer codes to trade very fast. Often used in high-frequency trading.
4. Quantitative systems
Use big math models and lots of data to find trades.
Common Trading Strategies
1. Trend following
Buy when prices keep going up, sell when they keep going down. Uses moving averages and trend lines.
2. Mean reversion
Prices often return to their average. Uses tools like Bollinger Bands and RSI.
3. Arbitrage
Find the same thing priced differently in two places and profit from the difference. Needs very fast trading.
4. Momentum trading
Buy things that are already rising fast, sell things that are falling fast. Uses MACD and similar tools.
5. Scalping
Make many small trades to catch tiny price moves. Needs lots of buyers and sellers and low fees.
Good Points of Trading Systemd
- More consistent because rules stay the same.
- Faster and more accurate when automated.
- You can test them on past data first.
- Can handle many trades and markets at once.
Problems
- Overfitting: Works great on old data but fails in real markets.
- Can break in strange market conditions.
- Hard and expensive to build and keep running well.
4 Types Of Trading Signals:
Quantified trading signals can be based on different types of strategies. Some buy high in the hopes of selling higher, while others try to create a great risk/reward ratio by buying low hoping to sell on rebounds or reversals in price action. Here are four different types of trading signals.
1\. Momentum signals are based on buying strength.
Momentum traders wait for a strong move in a stock and then buy and get on-board for a short amount of time. Momentum traders usually trade short time frames of days. These work primarily in bull markets.
2\. Breakout signals are based on buying all-time highs or 52 week highs, trying to buy high and sell higher. Breakouts are bought trying to catch a parabolic move where a stock could double or even triple over weeks and months. These work primarily in strong bull markets when indexes break to all-time highs.
3\. Buying oversold dips are based on buying a long term price support level or an oversold oscillator like the 30 RSI, a price extension far from the 10 day EMA, or a -80 to -100 . This signal tries to create a great risk/reward ratio based on buying a deep dip of a historical price range. These work best in range-bound markets.
4\. Trend following signals try to go in the direction of the long term trend by using long term moving averages like the 200 day SMA breaks as buy or sell signals, or all-time highs or lows to enter longs or shorts. These work in trends with higher highs or lower lows.
SUPER TRADING STRATEGIES EVERY TRADER SHOULD KNOW.
Here are 4 major categories of trading strategies you need to understand. 🧵👇
1. DAY TRADING STRATEGIES
Strategies focused on capturing short-term price movements within a single trading day.
🔹 Scalping: Making multiple small profits from tiny price movements throughout the day.
🔹 Momentum Trading: Following strong price movements supported by high trading volume.
🔹 Range Trading: Buying near support and selling near resistance when price moves within a defined range.
🔹 News-Based Trading: Trading around economic announcements, earnings reports, and other market-moving events.
2. SWING TRADING STRATEGIES
Strategies designed to capture price movements over several days or weeks.
🔹 Technical Analysis-Based Trading: Using chart patterns, RSI, MACD, and moving averages to identify potential trading opportunities.
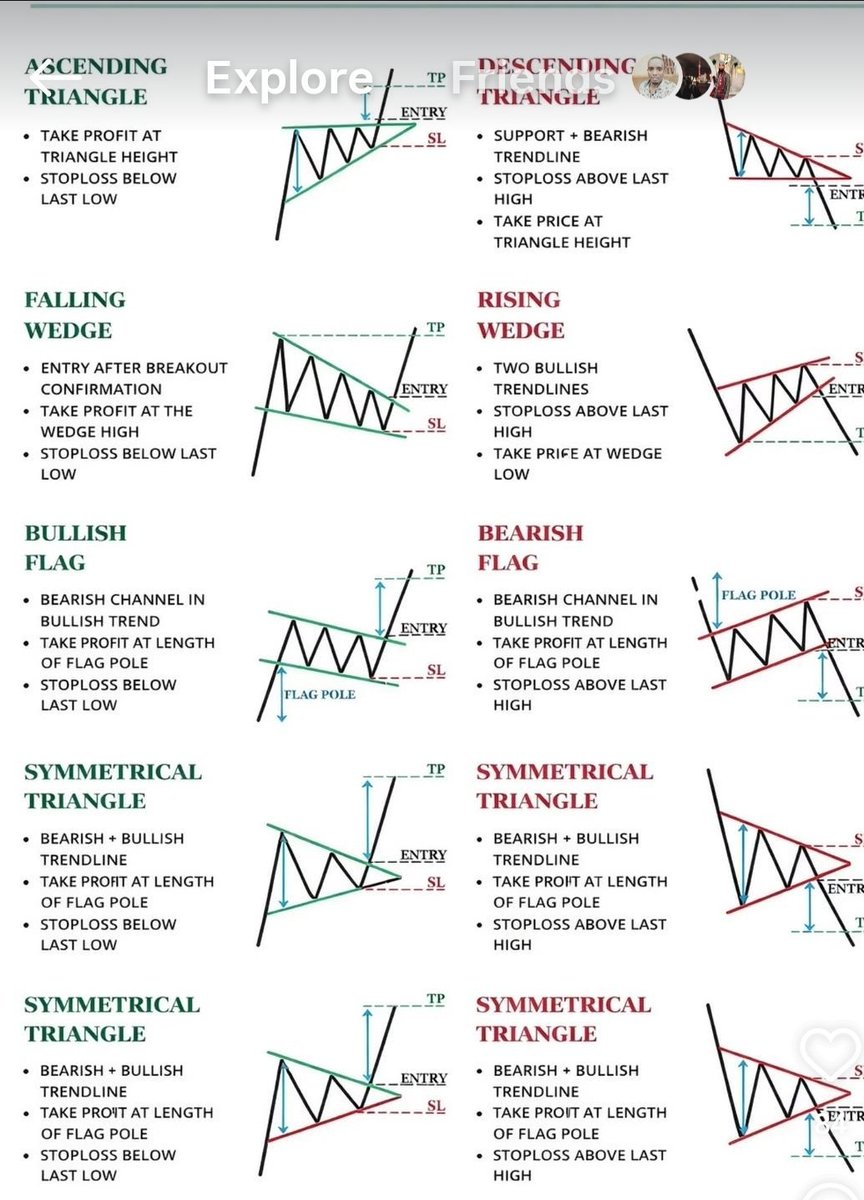
🔹 Breakout Trading: Entering positions when price breaks above resistance or below support.
🔹 Mean Reversion: Betting that price will return toward its average after an extreme move.
3. POSITION TRADING & LONG-TERM STRATEGIES
Strategies focused on capturing longer-term market opportunities.
🔹 Value Investing: Buying undervalued assets based on fundamental analysis.
🔹 Growth Investing: Investing in companies with strong growth prospects.
🔹 Dividend Investing: Focusing on stocks that pay regular dividends.
🔹 Index Fund Investing: Investing passively in funds that track broad market indices.
4. ALGORITHMIC & SYSTEMATIC TRADING STRATEGIES
Strategies that use predefined rules, statistical models, or computer algorithms.
🔹 Trend Following: Following established market trends using systematic rules.
🔹 Statistical Arbitrage: Exploiting statistical pricing relationships between related securities.
🔹 High-Frequency Trading: Using advanced algorithms to execute trades at extremely high speeds.
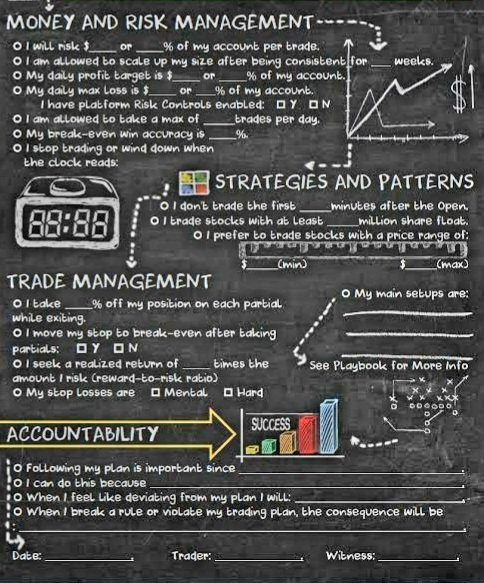
5. RISK MANAGEMENT: THE FOUNDATION OF EVERY STRATEGY
Every strategy carries risk.
Before choosing a trading strategy, consider:
• How much capital you can afford to risk.
• Your risk tolerance and time commitment.
• Your entry, exit, and stop-loss rules.
• Your ability to follow a consistent trading plan.
• Your experience and emotional discipline.
No strategy guarantees profits. Long-term passive index investing has historically outperformed many active trading approaches for individual investors over extended periods.
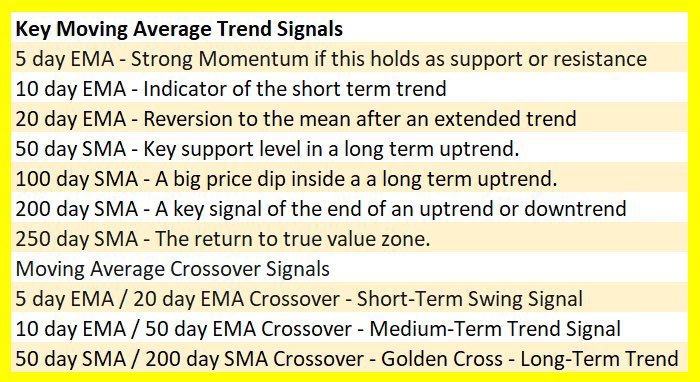
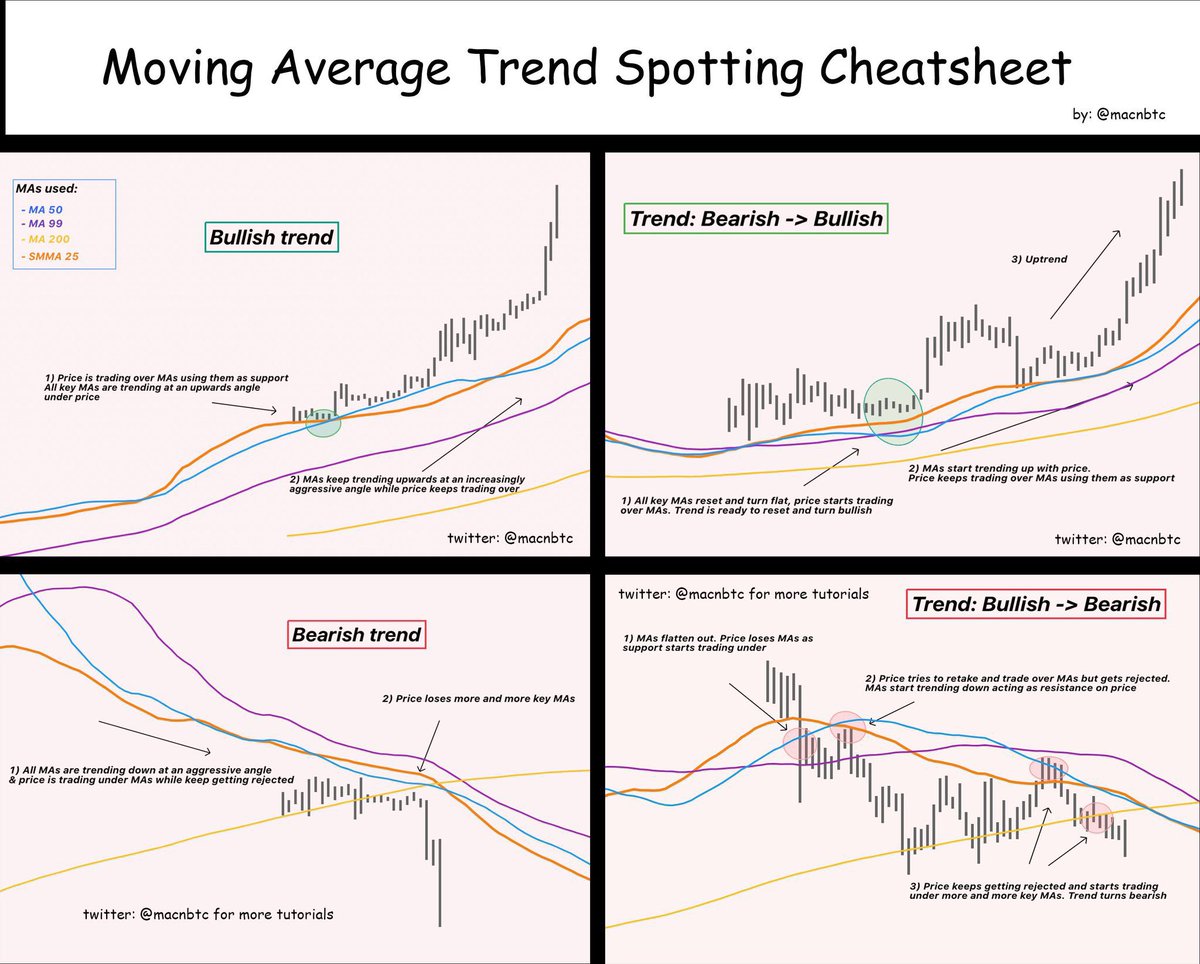
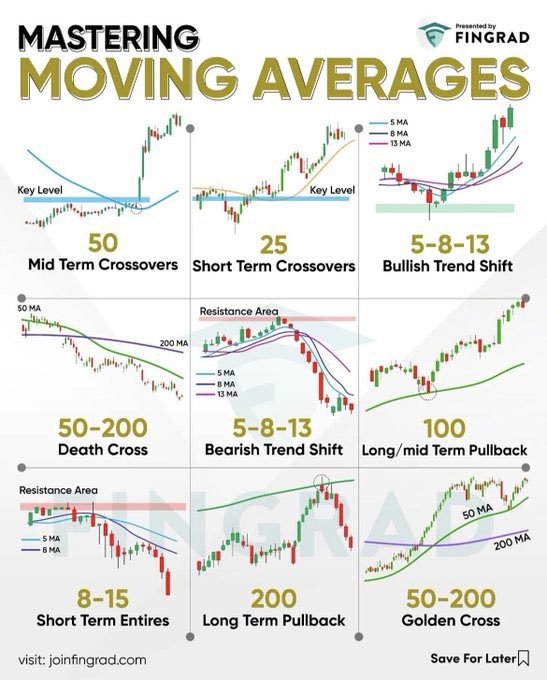
Moving Averages Cheat Sheet
Moving averages are one of the cleanest tools in technical analysis for reading trend, momentum, and swing structure.
They quantify the direction and strength of price.
When price stays above a moving average, that timeframe is bullish.
The more moving averages price holds above, the stronger the trend.
Core Moving Averages I Use
- 5 EMA → Momentum
- 10 EMA→ Short-term trend
- 20 EMA → Mean reversion level
- 30 EMA → Swing filter
- 50 EMA→ Pullback zone in an uptrend
When price is above multiple EMAs, the chart is healthy.
When price loses them one by one, momentum is fading.
Bullish Crossover Signals (Inside the Ribbon)
These work best on charts that are already in a longer-term uptrend:
- 5 / 20 EMA cross → Flying Eagle
- 5 / 30 EMA cross→ Flying Falcon
- 10 / 30 EMA cross→ Flying Squirrel
- 10 / 50 EMA cross → Flying Dragon
The more of these crossovers that fire together, the stronger the bullish signal.
Trade Management
Profit Target
In strong trends, the 70 RSI zone often acts as a logical area to take partial profits.
Stop Loss Options
- Fixed percentage risk
- Below the short-term EMA used in the crossover
- Below both EMAs in the crossover
Trailing Stop Methods
- Swing traders: Trail below the short-term EMA
- Momentum traders: Trail below the previous day’s low
- Trend traders: Hold until the short-term EMA crosses back under the longer-term EMA
Bearish Crossunders (For Downtrends)
- 5 / 20 EMA cross under → Lame Duck
- 10 / 50 EMA cross under→ Loch Ness Monster
These can be used to go to cash or as short signals when the higher timeframe is already bearish.
Important Rules
These signals are designed for:
- Stocks and indices that trend or swing cleanly
- Market leaders and growth names
They are not ideal for:
- Sideways/choppy markets
- Extremely high-volatility charts
The real edge is not the crossover itself.
The edge comes from:
- Taking small, controlled losses
- Letting winners run with a trailing stop
- Only trading these signals in the direction of the bigger trend
Backtest everything on your own watchlist.
Risk management turns average signals into positive expectancy.
Moving averages don’t predict the future.
They help you stay on the right side of momentum.
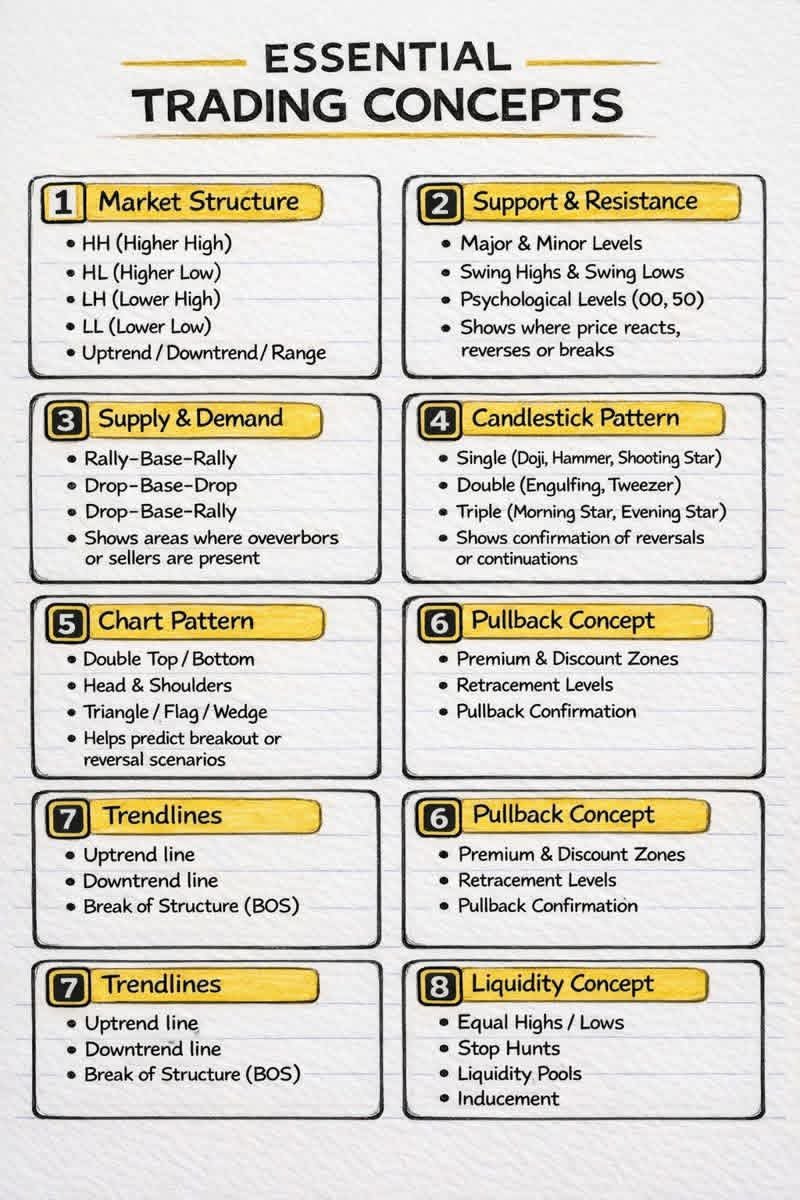
Most traders lose because they trade without a system ❌
These 8 concepts are the foundation of consistent trading 🧱📈
• Market structure → who’s in control
• Support & resistance → decision zones
• Supply & demand → institutional footprints
• Candlesticks → intent, not noise
• Chart patterns → repeated behavior
• Pullbacks → smart money entries
• Trendlines & BOS → real shifts
• Liquidity → fake moves & stop hunts
Master the foundation first.
Then strategies start to work.
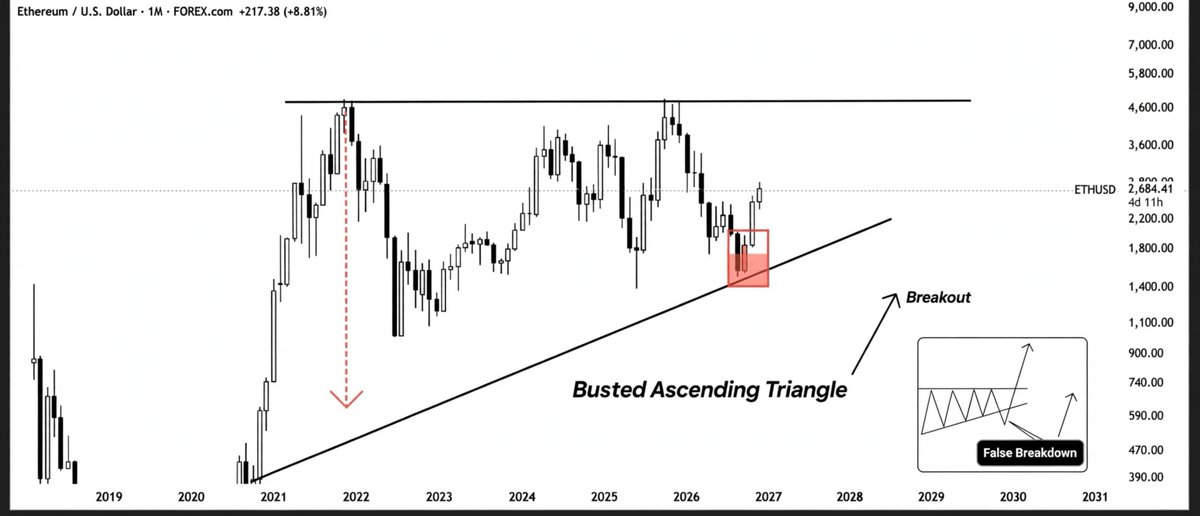
ETH in 2026 is just like BTC in 2016.
Everyone expected Bitcoin to only hit $5K-$6K, and it pumped all the way to $20K.
Everyone is expecting Ethereum to hit $5K-$6K, and it'll pump way higher.
Busted ascending triangle. False breakdown already played out. Breakout incoming.
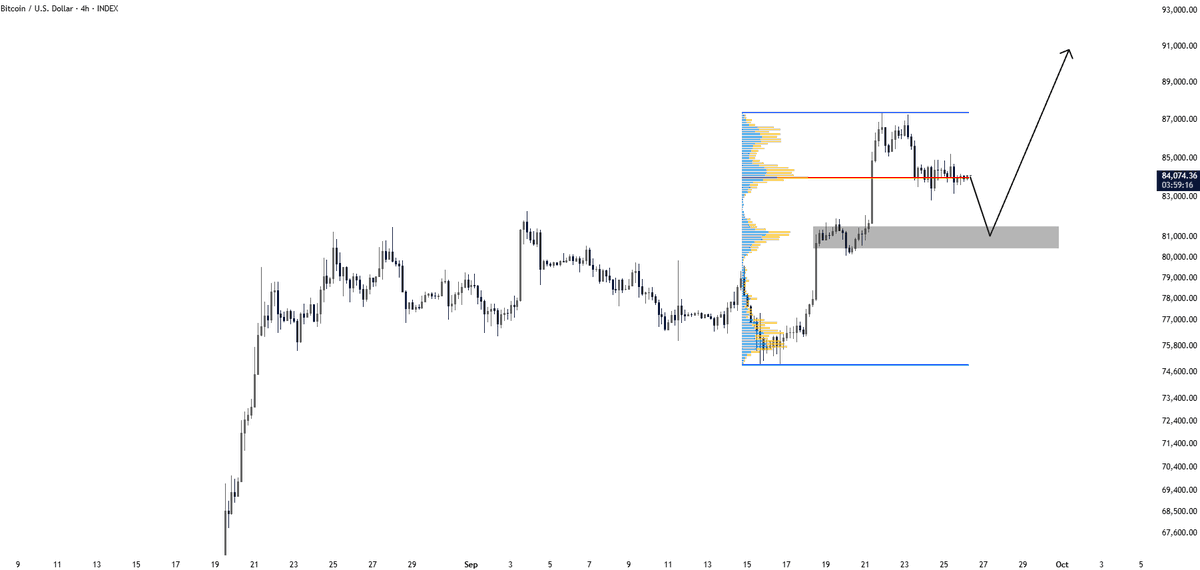
$BTC is sitting right around the $83K POC.
Price rejected from $87K and is now consolidating around the highest-volume zone.
A retest of $80K–81.5K would make sense as the breakout shelf.
Hold that zone and $91K+ comes back into focus.
$80K–81.5K is the key area.


![AtlasOnChain2's tweet photo. 8 Phases of Market Cycle 🚨
You Must have heard about the 4 Phases of Market Cycle 👇
< Accumulation, Uptrend, Distribution & Downtrend >
But let me breakdown these 4 Phases into 8 for better understanding of Market Cycle.
[𝘉𝘰𝘰𝘬𝘮𝘢𝘳𝘬 𝘵𝘩𝘪𝘴 𝘱𝘰𝘴𝘵 𝘧𝘰𝘳 𝘧𝘶𝘵𝘶𝘳𝘦]
1) Accumulation Phase :
During this phase, prices are relatively low and stable after a downtrend. Price is boring and keeps ranging for weeks and month.
Experienced investors and smart money start accumulating gradually to avoid price spikes, Retail investors are less involved due uninteresting market and due to Fear of market falling further.
This phase can be recognized if price is Trading Inside a range or forming any reversal patterns like Double Bottoms.
Technical indicators are often Oversold in this area & Negative news have little to no impact on the prices as sell pressure is absorbed by the smart money.
2) Bullish Transition Phase: This phase is a transition from Accumulation to an Uptrend.
Prices start moving up slowly, after breaking the downwards Market structure & starts slowly heading upwards but it's typically a slow and unexciting phase.
This is also the best time to look for buying opportunities.
3) Uptrend or Markup Phase
: During the uptrend, prices consistently climbs up , forming higher highs and higher lows.
As the market attracts more participants, Positive sentiment starts increasing with bullish news having a good impact on the price.
4) Bullish Acceleration Phase: In this phase price moves too quick in a very short period of time, often driven by extreme excitement and greed.
This phase price enters parabola. 'Dips are eaten up quickly' and Technical indicators start entering the OverBought zone.
5) Distribution Phase: In this phase, Initial investors who bought during accumulation phase - start selling to secure profits.
Prices become unstable, choppy or range-bound , and even positive news has minimal impact on the price. Retails are actively involved in this area.
Reversal patterns like Inverse Head and Shoulders, double top, breakdown of 200 MA might indicate a potential trend shift.
6) Bearish Transition Phase: This is a transition phase where New Buyers (Mostly Retails) fail to absorb the selling pressure from the early investors/ smart money who bought during the accumulation phase.
Price transitions from Uptrend to a Downtrend by breaking the bullish market structure.
This is also the best time to sell & take profits.
7) Downtrend or MarkDown Phase:
In this phase, prices consistently decrease, and fear dominates the market. Selling becomes more frequent, leading to Lower Highs and Lower Lows. There are very few new buyers Left to absorb the increased selling pressure.
8) Bearish Acceleration Phase: In this Phase - Prices drop rapidly in a short period, driven by extreme fear and negativity with bad news. Market sentiment becomes very negative, and technical indicators show a strongly oversold signal.
In this Phase there are little to No Postive news left in the market, while negative news have bigger impact on the price causing forced Selling.
Every Market goes through these PHASES in a Complete Cycle, Starting from Lows, going up to Highs, and then coming back down again.
Now Recognizing our position in the Market Cycle is also very important for shaping our Trading Plan /Strategy accordingly :
•Accumulation : (Buy support /sell resistance), DCA and try to build a long term Position
•Distribution : (Buy support /sell resistance), Start to gradually Unload Your Long term Holdings.
•Bullish Transition : Look for Buy/Long opportunities.
•Uptrend or Markup : Buy support/Deviations/ or Pullback into HTF support
•Bearish Transition: Look for Selling /short opportunities.
•Downtrend or Mark Down : Sell Pumps/ Deviations/ Retest into HFT Resistance.
x------------End-------------x
If you enjoyed this Post :
Follow @AtlasOnChain2](https://pbs.twimg.com/media/HTN6HUAWgAEIWDp.jpg)
![AtlasOnChain2's tweet photo. 8 Phases of Market Cycle 🚨
You Must have heard about the 4 Phases of Market Cycle 👇
< Accumulation, Uptrend, Distribution & Downtrend >
But let me breakdown these 4 Phases into 8 for better understanding of Market Cycle.
[𝘉𝘰𝘰𝘬𝘮𝘢𝘳𝘬 𝘵𝘩𝘪𝘴 𝘱𝘰𝘴𝘵 𝘧𝘰𝘳 𝘧𝘶𝘵𝘶𝘳𝘦]
1) Accumulation Phase :
During this phase, prices are relatively low and stable after a downtrend. Price is boring and keeps ranging for weeks and month.
Experienced investors and smart money start accumulating gradually to avoid price spikes, Retail investors are less involved due uninteresting market and due to Fear of market falling further.
This phase can be recognized if price is Trading Inside a range or forming any reversal patterns like Double Bottoms.
Technical indicators are often Oversold in this area & Negative news have little to no impact on the prices as sell pressure is absorbed by the smart money.
2) Bullish Transition Phase: This phase is a transition from Accumulation to an Uptrend.
Prices start moving up slowly, after breaking the downwards Market structure & starts slowly heading upwards but it's typically a slow and unexciting phase.
This is also the best time to look for buying opportunities.
3) Uptrend or Markup Phase
: During the uptrend, prices consistently climbs up , forming higher highs and higher lows.
As the market attracts more participants, Positive sentiment starts increasing with bullish news having a good impact on the price.
4) Bullish Acceleration Phase: In this phase price moves too quick in a very short period of time, often driven by extreme excitement and greed.
This phase price enters parabola. 'Dips are eaten up quickly' and Technical indicators start entering the OverBought zone.
5) Distribution Phase: In this phase, Initial investors who bought during accumulation phase - start selling to secure profits.
Prices become unstable, choppy or range-bound , and even positive news has minimal impact on the price. Retails are actively involved in this area.
Reversal patterns like Inverse Head and Shoulders, double top, breakdown of 200 MA might indicate a potential trend shift.
6) Bearish Transition Phase: This is a transition phase where New Buyers (Mostly Retails) fail to absorb the selling pressure from the early investors/ smart money who bought during the accumulation phase.
Price transitions from Uptrend to a Downtrend by breaking the bullish market structure.
This is also the best time to sell & take profits.
7) Downtrend or MarkDown Phase:
In this phase, prices consistently decrease, and fear dominates the market. Selling becomes more frequent, leading to Lower Highs and Lower Lows. There are very few new buyers Left to absorb the increased selling pressure.
8) Bearish Acceleration Phase: In this Phase - Prices drop rapidly in a short period, driven by extreme fear and negativity with bad news. Market sentiment becomes very negative, and technical indicators show a strongly oversold signal.
In this Phase there are little to No Postive news left in the market, while negative news have bigger impact on the price causing forced Selling.
Every Market goes through these PHASES in a Complete Cycle, Starting from Lows, going up to Highs, and then coming back down again.
Now Recognizing our position in the Market Cycle is also very important for shaping our Trading Plan /Strategy accordingly :
•Accumulation : (Buy support /sell resistance), DCA and try to build a long term Position
•Distribution : (Buy support /sell resistance), Start to gradually Unload Your Long term Holdings.
•Bullish Transition : Look for Buy/Long opportunities.
•Uptrend or Markup : Buy support/Deviations/ or Pullback into HTF support
•Bearish Transition: Look for Selling /short opportunities.
•Downtrend or Mark Down : Sell Pumps/ Deviations/ Retest into HFT Resistance.
x------------End-------------x
If you enjoyed this Post :
Follow @AtlasOnChain2](https://pbs.twimg.com/media/HTN6GmxX0AAlIoS.jpg)






![AtlasOnChain2's tweet photo. 8 Phases of Market Cycle 🚨
You Must have heard about the 4 Phases of Market Cycle 👇
< Accumulation, Uptrend, Distribution & Downtrend >
But let me breakdown these 4 Phases into 8 for better understanding of Market Cycle.
[𝘉𝘰𝘰𝘬𝘮𝘢𝘳𝘬 𝘵𝘩𝘪𝘴 𝘱𝘰𝘴𝘵 𝘧𝘰𝘳 𝘧𝘶𝘵𝘶𝘳𝘦]
1) Accumulation Phase :
During this phase, prices are relatively low and stable after a downtrend. Price is boring and keeps ranging for weeks and month.
Experienced investors and smart money start accumulating gradually to avoid price spikes, Retail investors are less involved due uninteresting market and due to Fear of market falling further.
This phase can be recognized if price is Trading Inside a range or forming any reversal patterns like Double Bottoms.
Technical indicators are often Oversold in this area & Negative news have little to no impact on the prices as sell pressure is absorbed by the smart money.
2) Bullish Transition Phase: This phase is a transition from Accumulation to an Uptrend.
Prices start moving up slowly, after breaking the downwards Market structure & starts slowly heading upwards but it's typically a slow and unexciting phase.
This is also the best time to look for buying opportunities.
3) Uptrend or Markup Phase
: During the uptrend, prices consistently climbs up , forming higher highs and higher lows.
As the market attracts more participants, Positive sentiment starts increasing with bullish news having a good impact on the price.
4) Bullish Acceleration Phase: In this phase price moves too quick in a very short period of time, often driven by extreme excitement and greed.
This phase price enters parabola. 'Dips are eaten up quickly' and Technical indicators start entering the OverBought zone.
5) Distribution Phase: In this phase, Initial investors who bought during accumulation phase - start selling to secure profits.
Prices become unstable, choppy or range-bound , and even positive news has minimal impact on the price. Retails are actively involved in this area.
Reversal patterns like Inverse Head and Shoulders, double top, breakdown of 200 MA might indicate a potential trend shift.
6) Bearish Transition Phase: This is a transition phase where New Buyers (Mostly Retails) fail to absorb the selling pressure from the early investors/ smart money who bought during the accumulation phase.
Price transitions from Uptrend to a Downtrend by breaking the bullish market structure.
This is also the best time to sell & take profits.
7) Downtrend or MarkDown Phase:
In this phase, prices consistently decrease, and fear dominates the market. Selling becomes more frequent, leading to Lower Highs and Lower Lows. There are very few new buyers Left to absorb the increased selling pressure.
8) Bearish Acceleration Phase: In this Phase - Prices drop rapidly in a short period, driven by extreme fear and negativity with bad news. Market sentiment becomes very negative, and technical indicators show a strongly oversold signal.
In this Phase there are little to No Postive news left in the market, while negative news have bigger impact on the price causing forced Selling.
Every Market goes through these PHASES in a Complete Cycle, Starting from Lows, going up to Highs, and then coming back down again.
Now Recognizing our position in the Market Cycle is also very important for shaping our Trading Plan /Strategy accordingly :
•Accumulation : (Buy support /sell resistance), DCA and try to build a long term Position
•Distribution : (Buy support /sell resistance), Start to gradually Unload Your Long term Holdings.
•Bullish Transition : Look for Buy/Long opportunities.
•Uptrend or Markup : Buy support/Deviations/ or Pullback into HTF support
•Bearish Transition: Look for Selling /short opportunities.
•Downtrend or Mark Down : Sell Pumps/ Deviations/ Retest into HFT Resistance.
x------------End-------------x
If you enjoyed this Post :
Follow @AtlasOnChain2](https://pbs.twimg.com/media/HTN6IHpXUAAm89V.jpg)