I'm starting to like Dylan Cardwell. Please give this a listen!
"In college I averaged 5 points per game, I rebounded the ball five times per game, I averaged like 1.6 blocks per game. No one thought I was an NBA player. I'm not supposed to be here. I'm living my childhood dream. This is a dream come true for me"
"We might not be having a great season, but this is the best locker room I've really been a part outside of my last year at Auburn. I really appreciate being on this team and being in this locker room"
The crypto team at @fundstrat nailed their #bitcoin price targets in 2023 and 2024
We caught up @SeanMFarrell about his price target for 2025 and why he thinks $175,000 is the number to watch 👀 ⬇️
JUST IN: 🇺🇸 Warren Buffett now holds $277 Billion in cash and has been selling stocks like never before, including Apple.
He's getting ready for a crash...
🚨#BREAKING: Here are the Top Names that have been mentioned in Epstein Document:
Alan Dershowitz - 137 times
Prince Andrew - 76 times
Clinton - 73 times
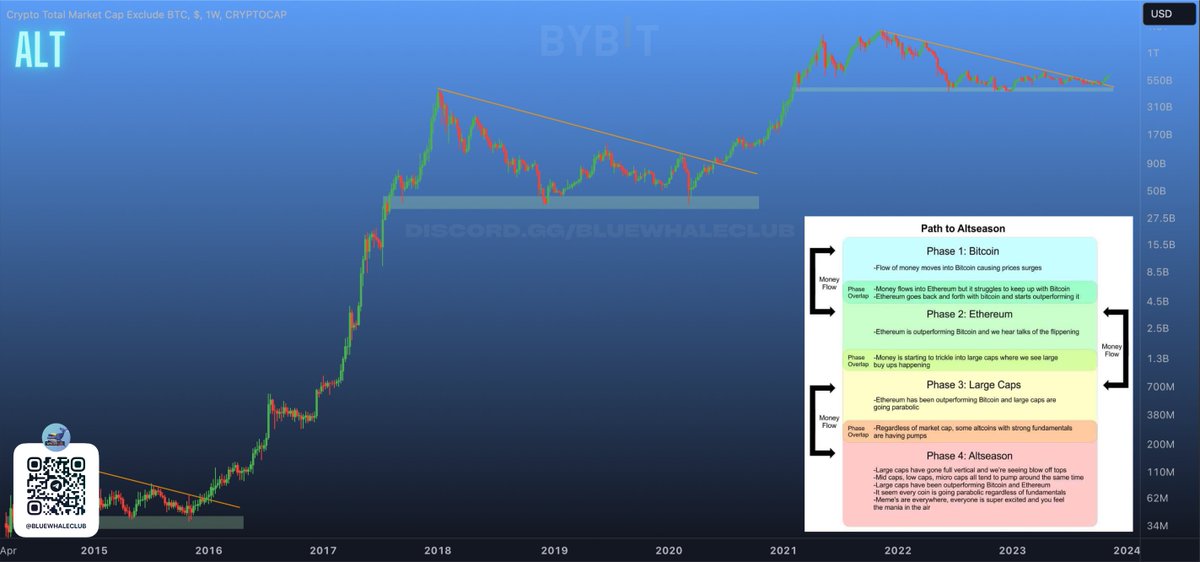
Altcoin Total Market Cap broke out to its highest levels in over 18 months! 👀
While #Bitcoin is in a sideways phase after its rapid rise, altcoins have gained their share of attention, with many of them seeing double-digit gains almost every day. 🚀
What's causing this? The usual Money Flow theory explains that after $BTC, money flows into smaller assets. However, hold off on the euphoria, as the real rally will only start after breaking the $700B mark. 😉
Until then, stay prepared to buy during the pullbacks (corrections). 💰
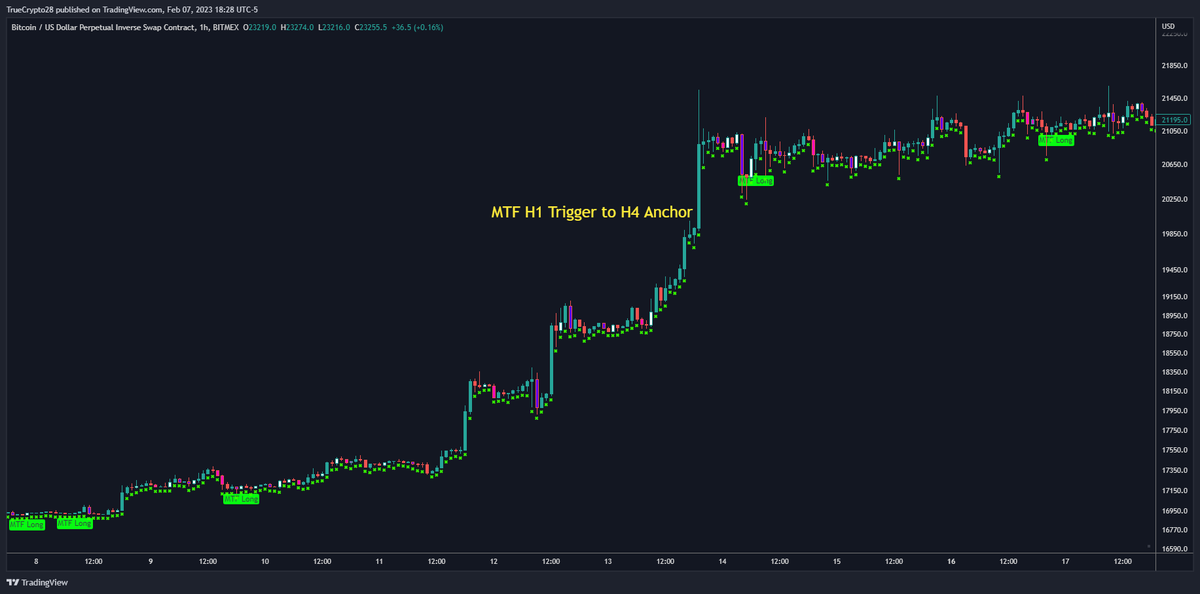
True Vibration Signals
Have been updated w/ a Training Wheels setting to Sharpen your signals
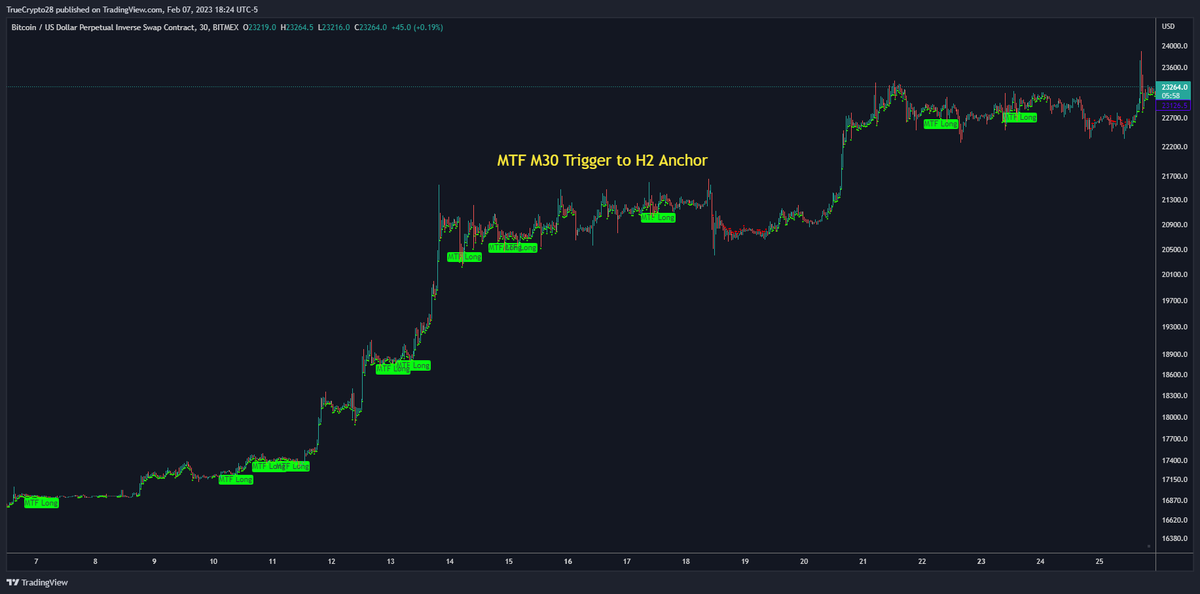
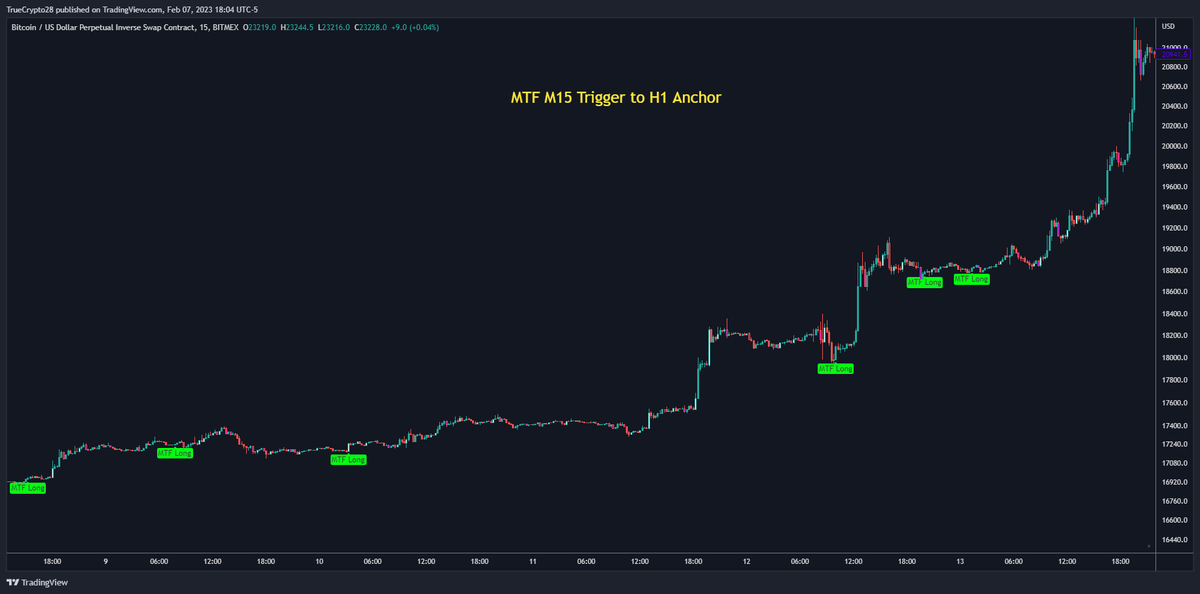
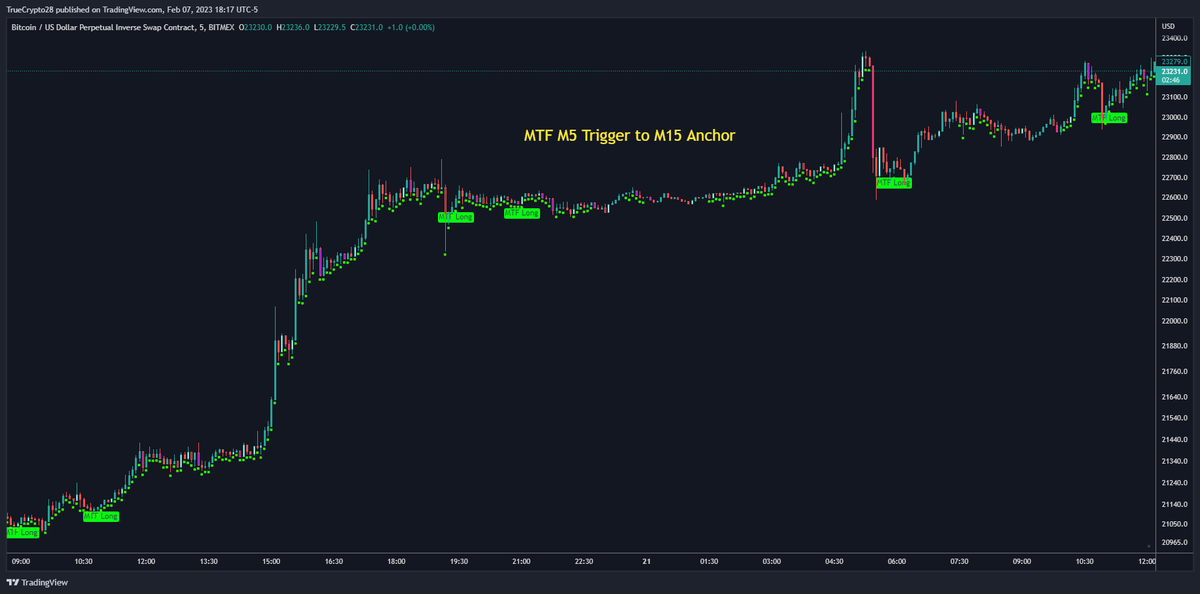
These are MTF Signals that use 2 Timeframes for edge-based signals.
Traders interested in no-cost access to this tool
1⃣Like
2⃣Retweet
3⃣DM me for details; expect response delays
⚠️📉 BTC Technical Analysis Update: The Final Stand! ⚠️📉
The moment has arrived...
To my long-standing and new followers, we've been patiently anticipating this scenario, and it's finally here. As detailed in my previous TA a month ago, the unfolding events are aligning perfectly with our predictions. The question now is - will this be the last stand for #BTC, or will it break through the line? Before we delve into the charts, I want to express my gratitude for the incredible support you've shown. My account is steadily growing, and the insights I share have been beneficial to many of you – As always, I don't seek your money, but your likes and retweets as a token of appreciation!
Remember, these analyses present probabilities rather than certainties, so please, always do your own research. As a neutral analyst, I profit from both market directions and am not swayed by the hype.
🐂 Sentiment Stage 🐻
As we observed last time, the bulls were proclaiming the return of the bull market and the onset of the altcoin season, while the bears were forecasting doom and gloom. The bulls seemed to convince most retail investors that we were entering a new bull market under the most challenging conditions - zero regulation, yet money was mysteriously flowing into the market. But let's put aside the doom and gloom and the magic money and see what the chart is objectively telling us.
🔥 The Renowned Liquidity Heatmap 🔥
The 6-month heatmap indicates thin liquidity at 27k and 30k. However, most of the liquidity is still at the lower levels, as shown from 25-20k, and then a very high liquidity zone at 16.8k. Be aware that looking this far back is less accurate, and liquidity is dynamic since traders keep changing their positions. FYI, this map has nothing to do with liquidations; it's a liquidity based on traders' bids/asks, etc., so actual liquidity. That's why it won't predict where it might go to but rather show where most liquidity is. This is one of my own tools of 4 crypto tools, and everyone is invited to try it for free for 3 days. Just join my discord and type !DCTtrial.
📊 Diving into Charts 📊
Looking at the daily chart, there's no real bullish reversal, but it's important to note that the RSI stochastic is getting close to the oversold area, which means we can still drop down a few days, but we will eventually try to retest 27k before a further decline unless we break 25k. That's where the strongest support for Bitcoin is. Losing that key area is a free fall to 23k. This also aligns with the heatmap, showing thin liquidity at 27-30k and high liquidity at 25-20k.
The weekly chart is crucial. If we close the weekly with a Lower low, this is a confirmation for a continuation of the downtrend unless we manage to make a higher high, but this also requires volume, which we lack now. The MACD is showing a bearish cross. However, the key indicator to look at is the RSI 50. If we manage to hold that, BTC might get saved. Breaking under that is a further decline.
If we go below 23k and retest 25k, which would take some weeks, we would form a deadly Head and Shoulder formation that could drop us all the way to 10k. This could take weeks, as I already explained this in my last tweet, but you heard it here first before “influencers” yell HS.
💰 Derivatives Market💰
Without much change as shown in the chart, OI has not dropped that much, still at 8.5B, indicating traders are still not closing their positions. According to the funding rate in coinalyze, it's positive, indicating LONGS are still open, which means they're suffering right now or believe BTC will hold 25k, so they keep their positions open. Liquidations show 30m LONGS have been liquidated, and CVD fut. Stablecoin/coin is going down, indicating new positions are not being opened or money is getting into the system. We could see the continuation of this down unless something drastic changes.
🌊 Navigating the Elliott Wave 🌊
Without repeating my EW since nothing has changed and it's been unfolding to the teeth. After identifying Wave C's local top, we anticipated a 5-3-5 movement in the downtrend. Fibonacci ratios had indicated a 31k range for Wave C's peak, a target we successfully hit 🎯. The current ABC corrective pattern mirrors that of July 2021. This EW chart would be invalidated if we sustain above 35-36k for at least 2 weeks.
📚 Bookmap: Liquidity Check 📚
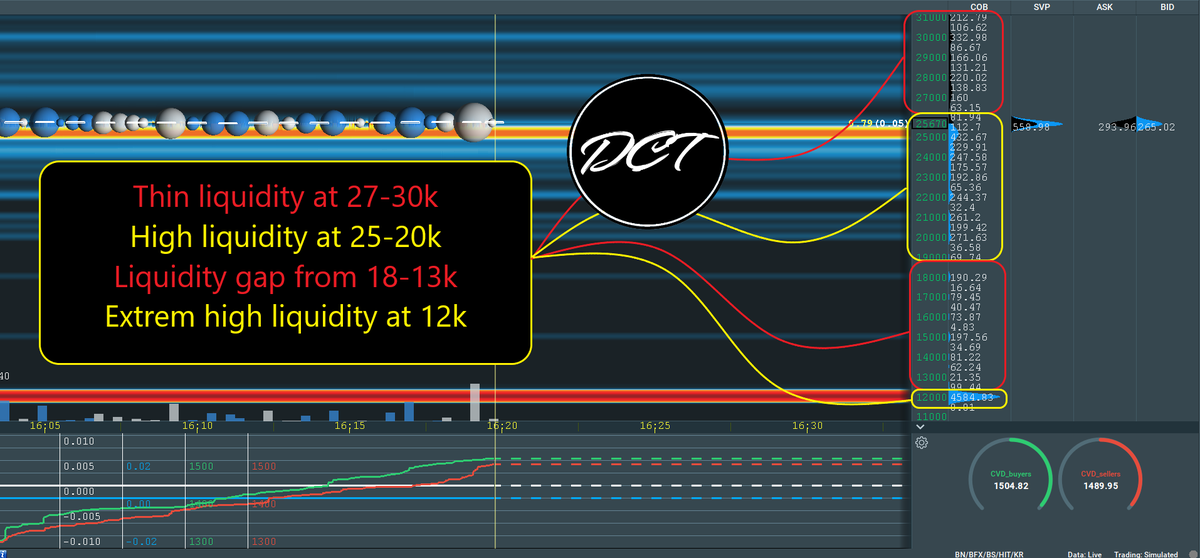
The book confirms, as in the liquidity heatmap, that there is thin liquidity at 27-30, suggesting potential liquidity hunts. However, liquidity is remarkably high at 25-20. Any supply shock could prompt a swift price drop due to a mismatch between supply and demand. Not to mention, going below 18k, there are big liquidity gaps between 18-13k. Remarkably, high liquidity around 12k with 4.6k BTC orders has been persistent for almost a year.
📢 Shoutout to @Bleeding_Crypto 📢
I already recommended last month to follow this analyst who has consistently provided objective market insights and I rarely mentions people, but he really deserves it. He's not just a good friend, but also a skilled analyst!
A second shoutout I must mention is a much smaller account that deserves as much appreciation, who is also a follower of mine, @sicariobtc. He brings you valuable insight all for free, give him some appreciation as well.
I only choose alphas in my mentions, and both analysts deserve it.
🌐 Macroeconomic View 🌐
I already mentioned a bit about macro, and I'm going to repeat myself. While macroeconomics might not be the most thrilling topic, it's vital to understand its implications on crypto and everyday life. Many of you have followed my views, which have remained consistent over the years. Now, even the FED acknowledges an imminent recession. For a more in-depth discussion on macroeconomics, stay tuned for a new post.
📜Regulation📜
There is no doubt that the narrative about regulation is driving the sell-off, yet you must understand regulation is not a bad thing for price appreciation over time. This means new capital can get in once the dust settles and regulators finally draw clear guidelines and rules for the VC, exchanges, and companies. This takes time, but once it's done, we will have the biggest bull run in our history. (My personal opinion)
💡 Conclusion 💡
I wrote this last time, and my conclusion has not changed. I will stick to it with all the charts and analysis I'm showing. As stated previously, the evidence suggests a looming sell-off and a final flush before reaching the bottom, but this would also be the final bottom once reached this year. While I could be wrong, and I'd rather make money than be right, this doesn't mean I'm disregarding all my analysis Based on my examination of the charts and macroeconomics, it's apparent that BTC is following the Nasdaq, which is also experiencing a bear rally.
This channel isn't about fear-mongering; instead, where others see fear, I see opportunity. In the long run, I'm bullish; otherwise, I wouldn't be in this space. However, believing we are in a full bull market with almost no liquidity, a rally driven mainly by whales, and a monetary policy with Quantitative Tightening (QT), high inflation, and an approaching recession, is akin to gambling. In fact, the casino might offer better odds.
This technical analysis will be invalidated if we rise above 40k (the Elliott Wave count will be invalidated if we stay above 35-36k for 2 weeks). As mentioned previously, if we maintain key levels, like the 200 Simple Moving Average (SMA) weekly at 25k, a reversal could occur. For now, my inclination is that we will go much lower. Of course, in the short term, we may see high swings, and I will keep you updated on these smaller time frames. This technical analysis could take weeks or even months to unfold. So far, it's been adhering to the predicted path. Let's see if it stays on track. #cryptoanalysis #Elliottwave #BTC #crypto #eth #Polygon #dxy #spy #nasdaq $BTC #sec #binance
📊 #Bitcoin has just fallen back below $30k to open the new week (UTC). Our new insight analyzes how #FOMO plays a big role in when tops hit, how prices historically move the opposite direction of the crowd's expectation, and #stablecoin retail money. 🤑 https://t.co/HIegRal5za
Broke: USDT denied a US stablecoin license.
Woke: USDT offers rebasing yield. But still an unlicensed stable.
Bespoke: USDT2, a non-rebasing flatcoin that accumulates yield internally (like cUSDC) so that 1 USDT2 is worth a non-fixed monetary value. Unregulated & not prohibited😇