🐙 Recap from the Deep
$SPY closed near 718 after rejecting the 724–725 zone — stalling right under a heavy call wall.
Key Levels
Resistance: 725
Pivot: 722
Support: 715 → 700 (put wall)
Options Flow
Put/Call: 2.2 → put-heavy
Heavy buying: 700–710 puts
Some 720–722 calls stepping in
Gamma Map
Negative gamma (~ -2B) → volatility expansion
Call wall: 725 (cap)
Put wall: 700 (magnet)
Volatility Context
Expected move: ~±5.7 → 713–723 range
Sitting in a low gamma pocket → fast moves likely
Current Read
Flow is leaning bearish with hedges stacking below, but not one-sided. Market is pinned between 725 resistance and 700 support — a breakout or breakdown will move fast.
Lose 715 → quick flush to 700
Clear 725 → squeeze to 730+
🐙 The Deep End
Price is coiling under resistance in a negative gamma regime — expansion is coming, direction depends on who blinks first.
Are you positioning for the breakdown… or the squeeze?
$SPY $SPX $DJI $QQQ $TSLA $MSFT $TQQQ $SQQQ $VIX
🐙 Recap from the Deep – $SPY
$SPY pushed into 719.79 highs but stalled right under the key 720 gamma wall — classic compression after a strong dip buy.
Key Levels
• 720 → Major resistance (call wall)
• 700 → Strong support / higher low (703)
• 680 → MA cluster (50/100)
• 670 → 200 MA (trend line)
Options Flow
• Put-heavy positioning (P/C ~2.7)
• Size loaded 700–710 puts
• Market hedged for downside… but price held
Gamma Map
• Positive gamma → controlled price action
• 720 acting as ceiling
• 700 acting as floor
• Range = compression zone
Volatility Context
• Suppressed vol (positive gamma)
• Expect chop + fakeouts until break
• Energy building for expansion
Current Read
Failed breakdown at 703 → strong bounce → now coiling under resistance.
Bearish positioning + strong price = potential squeeze setup.
The Play
• Break 720 → opens upside expansion
• Hold 700 → bulls remain in control
• Inside 700–720 → noise zone
Pressure building under the surface… which side gives first? 🐙
$SPY $SPX $QQQ $DJI $TSLA $MSFT
🐙 $NVDA Quick Update
Low: 198.78 → bounced back above 200
Now: ~200.5
👉 Clean reaction at support
🔥 What it means
Sweep below 200 → buyers stepped in
This is support holding, not breakdown (yet)
🎯 Levels that matter
200 → must hold
205 → reclaim = strength
210 → breakout trigger
195 → next support if lost
🧠 Read
$NVDA trying to build a higher low at 200
Hold → push back toward 205–210
Lose → quick move to 195
🐙 Play
Best entry was ~198–200
Now:Wait for pullback
OR strength above 205
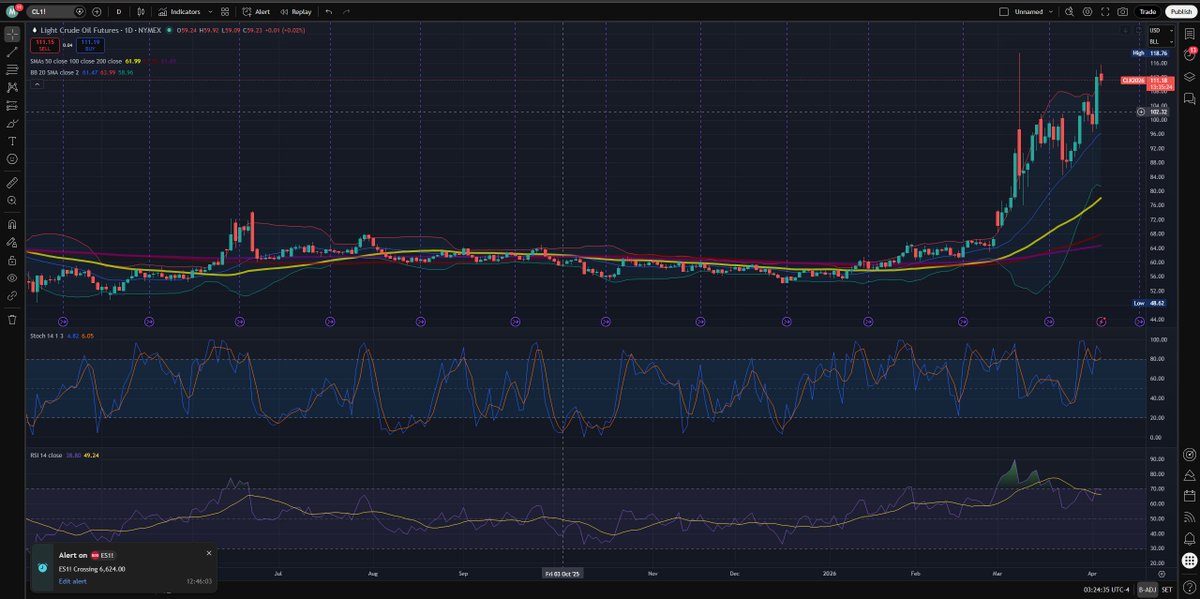
🐙 Everyone thinks oil just topped…
🐙 Oil isn’t done… and the market is feeling it.
While most are calling a top, positioning tells a different story 👇
🛢️ $WTI Structure (CL1!)
• Parabolic move → now consolidating
• Holding above key MAs (trend intact)
• No real breakdown — just cooling
🐋 $XLE Flow
• Heavy calls stacked at 60–65
• Put hedging below (55–58)
• Skew = bullish continuation
⚡ Gamma Insight
• 60 = control level
• Above → expansion
• Below 58 → fast downside
🧠 The Real Read
This isn’t a top… it’s a pause
Energy still has fuel
And that means pressure on equities isn’t gone yet
🧭 Cross-Asset
• Oil elevated
• $SPY still weak
• Inflation risk still alive
🐙 Deep Sea Insights (History Matters)
• 2008: Oil → $147 → equities peaked → sharp global selloff
• 2011: Oil spike (Arab Spring) → growth slowed, markets choppy
• 2014: Oil collapse → energy crash → markets stabilized after
• 2022: Oil > $120 → inflation surge → aggressive rate hikes → bear market
• 1970s: Oil shocks → stagflation → prolonged equity weakness
🐙 Octopus Read
As long as oil stays bid → markets stay fragile
❓ Does oil break 115+ and extend…
or finally roll over and give equities relief?
$SPY $SPX $XLE $CL $QQQ $VIX $TSLA $MSFT $SMH
🐙 The market just flashed a signal most traders ignore… until it’s too late.
$NQ just triggered a Death Cross (50 MA < 200 MA)
But here’s the truth 👇
This isn’t a warning…
It’s confirmation the move is already happening.
🌊 What’s underneath
• Price already below all major MAs
• Structure = breakdown → weak bounce
• Trend → distribution → unwind
🐋 The Real Read
The “Death Cross” is a lagging signal
Meaning: smart money already positioned
👉 Rallies here aren’t bullish
They’re exit liquidity
🧭 Cross-Asset Check
• $SMH rolling over after 200 MA test
• $SPY still below 662 (key level)
• $VIX elevated — not collapsing
🐙 Octopus Read
This is where markets stop trending…
and start unwinding fast.
⚓ Key Zone to Watch
24.8K = line in the sand
❓ Does $NQ fail here and accelerate lower…
or squeeze everyone leaning short?
$SPY $SPX $QQQ $VIX $SMH $TSLA $MSFT $TQQQ $SQQQ
🐙 Recap from the Deep — $SPY Weekly Close
As we’ve been tracking all week, $SPY broke structure and failed to reclaim the 200 MA (~662). Every bounce since has been sold — confirming this is distribution, not accumulation.
🌊 Weekly Recap (What Happened)
• Breakdown below key support → acceleration lower
• Relief bounce into ~655 → weak, low volume
• Rejection before 662 → sellers stayed in control
• Continued pressure into close → trend intact
⚓ Key Levels ($SPY)
• Resistance: 655 → 662 (major rejection zone / 200 MA)
• Pivot: 650
• Support: 640 → 630 (next liquidity zones)
🐋 Options Flow + Gamma
• Net gamma remains negative → unstable, directional moves
• Put dominance throughout the week
• Flow showed hedging, not bullish positioning
🧭 Volatility Context ($VIX)
• Spiked early → now compressing near ~23–24
• Not collapsing → just resetting
• As long as VIX >22 → downside risk remains active
🐙 Current Read
This week confirmed the shift:
The market is no longer trending — it’s breaking and failing.
Below 662 = sellers control
Bounces = opportunities, not reversals
Watch for:
• Rejection 655–662 → continuation toward 640 / 630
• VIX curl higher → confirms next leg down
🌊 Into next week:
Do we get another failed bounce… or does volatility reset and squeeze the market higher?
$SPY $SPX $QQQ $VIX $TSLA $MSFT $TQQQ $SQQQ
🐙 $SPY Closing Recap — Short Covering Bounce, But Vol Still Elevated
As we’ve been warning in previous updates, the setup was primed for a short covering rally — not a true shift in trend. Today played that out.
🌊 $SPY Recap (What Happened)
$SPY bounced from the lows (~650s → mid 650s), but failed to show strong follow-through.
This move was positioning unwind, not fresh risk-on buying.
⚓ Key Levels ($SPY)
Resistance: 658 → 662 → 665
Support: 650 → 645 → 630
Battle Zone: 650–655 (still the key decision area)
🐋 Options Flow + Gamma
Flow remains put-skewed → defensive positioning still dominant
Net gamma: negative (~ -3 to -4B) → unstable, reactive market
Large downside positioning persists → 630 put wall still a magnet
⚠️ Intraday Shift:
The call wall reduced significantly in the last hour → upside resistance weakened, but also signals calls being closed/unwound, not added ($660 CW went from $960B to $320B)
👉 That’s important:
This wasn’t new bullish positioning — it was liquidity coming out of the market
👉 Today’s bounce happened because shorts covered, not because bulls stepped in.
🌀 Volatility Context ($VIX)
$VIX pulled back slightly but remains elevated (~24–25)
Still trending higher lows → no real fear reset
VIX did NOT collapse alongside price → rally lacks confirmation
👉 If this were a true trend change, VIX would be breaking down harder
🐙 Current Read
Market remains in a high-volatility, negative gamma regime
This favors sharp counter-trend moves, not sustained trends
Unless $SPY reclaims ~660–665 with acceptance + VIX breaks lower, rallies are likely to fade
If downside resumes:
👉 645 → 630 becomes the path ($630 still has $1.5B put wall)
If upside continues:
👉 Likely squeeze-driven, not structurally bullish (yet)
🌊 Final Take
We called for a short covering rally — and that’s exactly what we got.
But with VIX still elevated + call wall fading (not building), this still looks like relief, not reversal
❓ Does vol finally break down… or does $SPY roll back into the dominant trend?
$SPY $SPX $DJI $QQQ $TSLA $MSFT $TQQQ $SQQQ $VIX
🐙 JPM Collar Insight — What Big Money Is Positioning For
🌊 JPM just put on a 31k JunQ collar vs ~6496
🟢 Long 6150/5190 put spread (downside protection)
🔺 Short 6840 call (upside cap)
🧠 What It Means
👉 Not chasing upside
👉 Not expecting a crash
👉 Positioning for range + uncertainty
🧲 Key Levels
🔺 6840 → Institutional ceiling (supply zone)
🔻 6150 → Downside concern / protection zone
🐙 Octopus Read
This aligns with today’s market:
Relief rally ✔️
Vol compression ✔️
Still unstable ✔️
👉 Big money is saying:
“We hedge downside, and we’re fine capping upside”
❓ Question for the crew
Does $SPX drift toward 6150 where protection kicks in… or hold higher and prove this hedge unnecessary?
$SPY $SPX $DJI $QQQ $TSLA $MSFT $TQQQ $SQQQ $VIX
🐙 $SPY Closing Recap — The Short Covering Rally We Warned About
As we’ve been saying in our earlier updates, the setup was there for a short-covering rally — and today, that’s exactly what played out. This wasn’t new bullish positioning, this was forced upside.
🌊 $SPY Recap (What Happened)
Flow flipped → call buying surged → dealers chased price higher → $SPY squeezed into ~650 and held into close.
A textbook short-covering + month-end flow move, just like we flagged.
⚓ Key Levels ($SPY)
Resistance: 650 → 655 → 660
Support: 645 → 640 → 630
Battle Zone: 640–645 (decision area)
🐋 Options Flow + Gamma
• Call flow dominant (dealer hedging drove upside)
• Net gamma still negative (~-9 to -10B)
• Put gamma barely reduced (-$24.7B)→ downside still loaded
• Put wall at 630 (~$2.3B) remains key
🌪️ Volatility Context
$VIX ~25.24 → still elevated → no real unwind of risk
🐙 Current Read
This is exactly what we warned:
👉 Short covering rally, not a trend change
Why it matters:
• Driven by flows (not conviction)
• Month-end rebalancing + positioning unwind
• Broader markets (oil, crypto, EU) didn’t confirm the move
• Downtrend structure still intact underneath
⚠️ What’s next
If $SPY loses 640 → downside likely accelerates (630 in play)
If it holds → squeeze can extend, but still fragile
🌊 We warned about the squeeze… now we watch if it fades.
$SPY $SPX $DJI $QQQ $TSLA $MSFT $TQQQ $SQQQ $VIX
🐙 Opening Recap from the Deep
As we’ve been tracking in the last few updates…
$SPY is now firmly below the 200 MA (~661) and pressing into the 640 breakdown zone, while $VIX has now spiked to ~30.16 ⚠️
👉 This is no longer just elevated fear —
👉 This is stress-level volatility
🌊 $SPY + $VIX — Something doesn’t add up…
Price is breaking down…
But $VIX at 30+ changes the game 👀
🧠 Translation:
We’re entering a zone where:
👉 Panic can accelerate downside
👉 BUT also trigger violent short covering rallies
🐋 Risk Factor (NEW): Bank Earnings Ahead
As mentioned earlier — positioning is crowded heading into earnings:
Heavy downside hedging
Put exposure stacked below
Funds leaning defensive
⚠️ Now with $VIX at 30+:
👉 The bar for a squeeze gets LOWER
Even a small catalyst =
fast risk reduction + short covering
🦑 Gamma Context
Still deep in negative gamma
👉 Meaning:
Dealers amplify moves BOTH directions
No stability — only expansion
⚠️ At these vol levels:
Upside squeezes can be just as aggressive as selloffs
⚓ Key Levels ($SPY)
🔴 Breakdown:
Lose 640 → 635 → 630 (fast, air pocket)
🟢 Reclaim:
Reclaim 650 → short covering squeeze → 655 → 660
🌪 Volatility Context
$VIX ~30.16
👉 This matters a LOT:
This is not normal pullback vol
This is risk-off / hedging stress
But also:
👉 Historically, VIX spikes like this
often precede reflex rallies
🐙 Octopus Read
As we’ve been building:
👉 Trend = bearish
👉 Gamma = negative
👉 Vol = extreme
👉 Positioning = crowded
⚠️ That combo creates a trap environment
Breakdown → accelerates hard
Bounce → squeezes even harder
👉 Watch 640… but ALSO watch reaction speed
Because now the real question is:
👉 Does fear keep expanding…
👉 or does it trigger a squeeze?
$SPY $SPX $DJI $QQQ $TSLA $MSFT $TQQQ $SQQQ $VIX
🐙 Opening Recap from the Deep
As we’ve been tracking in the last few updates…
$SPY is now firmly below the 200 MA (~661) and pressing into the 640 breakdown zone, while $VIX has now spiked to ~30.16 ⚠️
👉 This is no longer just elevated fear —
👉 This is stress-level volatility
🌊 $SPY + $VIX — Something doesn’t add up…
Price is breaking down…
But $VIX at 30+ changes the game 👀
🧠 Translation:
We’re entering a zone where:
👉 Panic can accelerate downside
👉 BUT also trigger violent short covering rallies
🐋 Risk Factor (NEW): Bank Earnings Ahead
As mentioned earlier — positioning is crowded heading into earnings:
Heavy downside hedging
Put exposure stacked below
Funds leaning defensive
⚠️ Now with $VIX at 30+:
👉 The bar for a squeeze gets LOWER
Even a small catalyst =
fast risk reduction + short covering
🦑 Gamma Context
Still deep in negative gamma
👉 Meaning:
Dealers amplify moves BOTH directions
No stability — only expansion
⚠️ At these vol levels:
Upside squeezes can be just as aggressive as selloffs
⚓ Key Levels ($SPY)
🔴 Breakdown:
Lose 640 → 635 → 630 (fast, air pocket)
🟢 Reclaim:
Reclaim 650 → short covering squeeze → 655 → 660
🌪 Volatility Context
$VIX ~30.16
👉 This matters a LOT:
This is not normal pullback vol
This is risk-off / hedging stress
But also:
👉 Historically, VIX spikes like this
often precede reflex rallies
🐙 Octopus Read
As we’ve been building:
👉 Trend = bearish
👉 Gamma = negative
👉 Vol = extreme
👉 Positioning = crowded
⚠️ That combo creates a trap environment
Breakdown → accelerates hard
Bounce → squeezes even harder
👉 Watch 640… but ALSO watch reaction speed
Because now the real question is:
👉 Does fear keep expanding…
👉 or does it trigger a squeeze?
$SPY $SPX $DJI $QQQ $TSLA $MSFT $TQQQ $SQQQ $VIX
🐙 Opening Recap from the Deep
As we’ve been tracking in the last few updates…
$SPY is now firmly below the 200 MA (~661) and pressing into the 640 breakdown zone, while $VIX has now spiked to ~30.16 ⚠️
👉 This is no longer just elevated fear —
👉 This is stress-level volatility
🌊 $SPY + $VIX — Something doesn’t add up…
Price is breaking down…
But $VIX at 30+ changes the game 👀
🧠 Translation:
We’re entering a zone where:
👉 Panic can accelerate downside
👉 BUT also trigger violent short covering rallies
🐋 Risk Factor (NEW): Bank Earnings Ahead
As mentioned earlier — positioning is crowded heading into earnings:
Heavy downside hedging
Put exposure stacked below
Funds leaning defensive
⚠️ Now with $VIX at 30+:
👉 The bar for a squeeze gets LOWER
Even a small catalyst =
fast risk reduction + short covering
🦑 Gamma Context
Still deep in negative gamma
👉 Meaning:
Dealers amplify moves BOTH directions
No stability — only expansion
⚠️ At these vol levels:
Upside squeezes can be just as aggressive as selloffs
⚓ Key Levels ($SPY)
🔴 Breakdown:
Lose 640 → 635 → 630 (fast, air pocket)
🟢 Reclaim:
Reclaim 650 → short covering squeeze → 655 → 660
🌪 Volatility Context
$VIX ~30.16
👉 This matters a LOT:
This is not normal pullback vol
This is risk-off / hedging stress
But also:
👉 Historically, VIX spikes like this
often precede reflex rallies
🐙 Octopus Read
As we’ve been building:
👉 Trend = bearish
👉 Gamma = negative
👉 Vol = extreme
👉 Positioning = crowded
⚠️ That combo creates a trap environment
Breakdown → accelerates hard
Bounce → squeezes even harder
👉 Watch 640… but ALSO watch reaction speed
Because now the real question is:
👉 Does fear keep expanding…
👉 or does it trigger a squeeze?
$SPY $SPX $DJI $QQQ $TSLA $MSFT $TQQQ $SQQQ $VIX
🐙 Options Flow Quick Hit — Shift Beneath the Surface
For the first time today…
👉 $1M+ CALLS > PUTS
Flow is flipping 👇
🐋 Notable Whale Activity
• $1.2M — $SPY 679C (0DTE) bought above ask
• $1.9M — $SPY 685C (Mar ’27) sweep
• $3.0M — $SPY 690C (Mar ’27) aggressive buy
• $2.1M — $SPY 660P (Jun ’26) block (hedge?)
📊 Sentiment: Shifting Bullish | Calls overtaking puts
🐙 Octopus Read
After a day dominated by put protection, we’re now seeing call buyers step in size — not just short-dated punts, but longer-dated positioning (2027).
👉 That’s not noise… that’s intent
But remember:
We’re still sitting near that 650 fault line
So this looks like:
🟢 Early positioning for a bounce / squeeze
⚠️ Not confirmation yet
If price holds → these calls can fuel upside
If 650 breaks → they get trapped fast
—
Is this the start of the squeeze… or just another setup before the drop? 👀
$SPY $SPX $QQQ $VIX $DJI $TSLA $MSFT $AAPL
🐙 $SPY After Hours — Support Holding… For Now
$SPY closed 653.28 AH after flushing below 650 and reclaiming — key level defended (put wall doing its job).
🌊 What Happened
Flush → reclaim → stabilization above 650
👉 Dealer support likely kicked in near that $4.2B put wall
⚓ Key Levels
🔴 Resistance: 660 → 665 → 670
🟢 Support: 650 → 640 → 630
🎯 Battle Zone: 650 (critical pivot)
🐋 Options Flow + Positioning
• Calls still dominating (≈5x puts earlier)
• Price NOT responding higher
👉 Bullish positioning being absorbed = bearish tilt
🧠 Octopus Read
This looks like support hold → bounce → decision zone
Likely path = relief bounce first, but structure still weak
👉 Rips into 660–665 = sell zone unless reclaim holds
🎯 Playbook
• Bounce → 660–665 → watch for rejection (puts)
• Breakdown → lose 650 → fast move to 640
Is 650 real support… or just the setup before the next flush? 👀
$SPY $SPX $QQQ $DJI $TSLA $MSFT
🐙 $SPY Closing Recap — Breakdown + Vol Expansion
$SPY sold off hard into the close, losing key MAs and flushing below 650, while $VIX surged to ~26.7 — risk-off is no longer hidden.
🌊 What Happened
Steady bleed → lost 50/100 MA (683/681) → acceleration lower
👉 Breakdown confirmed as vol expanded alongside price
⚓ Key Levels ($SPY)
🔴 Resistance: 660 → 665 → 670
🟢 Support: 650 → 640 → 630
🎯 Battle Zone: 650 (major put wall)
🐋 Options Flow + Vol
• Calls dominated (~5x puts) → bulls trapped
• Put wall at 650 (~$4.2B) holding (for now)
• $VIX ~26.7 and rising → regime shift underway
🧠 Octopus Read
This is structure breaking + volatility expanding
👉 Rounding top → distribution → now potential trend shift
👉 $VIX holding >25 = expect unstable, downside-biased price action
🎯 Playbook
• Bounce → 660–665 = sell zone
• Lose 650 → opens fast move to 640
• $VIX > 30 → likely fear acceleration
Is this the start of a larger unwind… or just the setup before a squeeze? 🐙
$SPY $SPX $VIX $QQQ $DJI $TSLA $MSFT
🐙 $SPY Update — We Called the Zone… Now What?
Yesterday we mapped 640–645 as the first downside target
👉 Today: $SPY tagged 644.72 and bounced to 653 AH
Not luck. Not random. That was the level.
🌊 What Just Happened
Break 650 → sweep into our target zone (640–645) → sharp reaction
👉 First buyers showed up exactly where expected
⚓ Key Levels
🔴 Resistance: 660 → 665 → 670
🟢 Support: 650 → 645 → 633
🎯 Pivot: 650 (battle line)
🐋 Flow Context (from our earlier read)
• Put ladder built below 650 (645 → 633 → 625)
• We said: bounce likely at first zone, but not final low
👉 That’s exactly what played out
🧠 Octopus Read
This is likely leg 1 down → bounce → decision phase
👉 Most will call bottom too early — structure still damaged
🎯 Playbook
• Bounce → 660–665 = key rejection zone
• Reclaim 660 → squeeze potential
• Lose 645 → opens 633–625 (next targets we flagged)
We hit the first level perfectly…
Now the real question: does it hold — or do we go finish the job lower? 🐙
$SPY $SPX $QQQ $DJI $TSLA $MSFT