Gold vs. Stocks may be entering a regime change.
The $Gold / $SPX ratio has spent decades below a secular resistance line that connects the 1980 and 2011 peaks.
Now, for the first time in years, the ratio is pressing against it again.
A breakout could mark the beginning of a major capital shift toward hard assets.
If this resistance breaks, are your portfolios prepared for that kind of shift?
@TaviCosta The key level: $48. A breakout and sustained hold above $48 would provide final bullish confirmation and strengthen the case for a potential multi-year bullish phase.
🇧🇷 Brazil vs. S&P 500 — The Great Rotation Setup
$EWZ / $SPX has broken above its secular resistance trendline dating back to 2009.
But Brazil still needs to reclaim the 4-year EMA and break above 0.0059 to confirm a sustained shift in relative strength.
One breakout is a start. Three technical barriers need to be cleared.
Will Brazil finally outperform U.S. equities in the next commodities bull market?
🇧🇷 $EWZ: A potential multi-year commodities bull market?
Brazil’s long-term resistance is being tested.
A breakout and hold above $48 would provide bullish confirmation. The BRL/USD chart is approaching its own key resistance at 0.2120.
Two levels to watch. One potential shift in market leadership.
But confirmation first.
🇧🇷 #Brazil is on my radar.
With presidential elections taking place today, $EWZ is approaching a potential structural breakout.
If the commodities bull market accelerates, could Latin America become one of its biggest beneficiaries?
My new article explores the setup, key levels, and what I need to see before allocating capital.
Full analysis in the first comment.
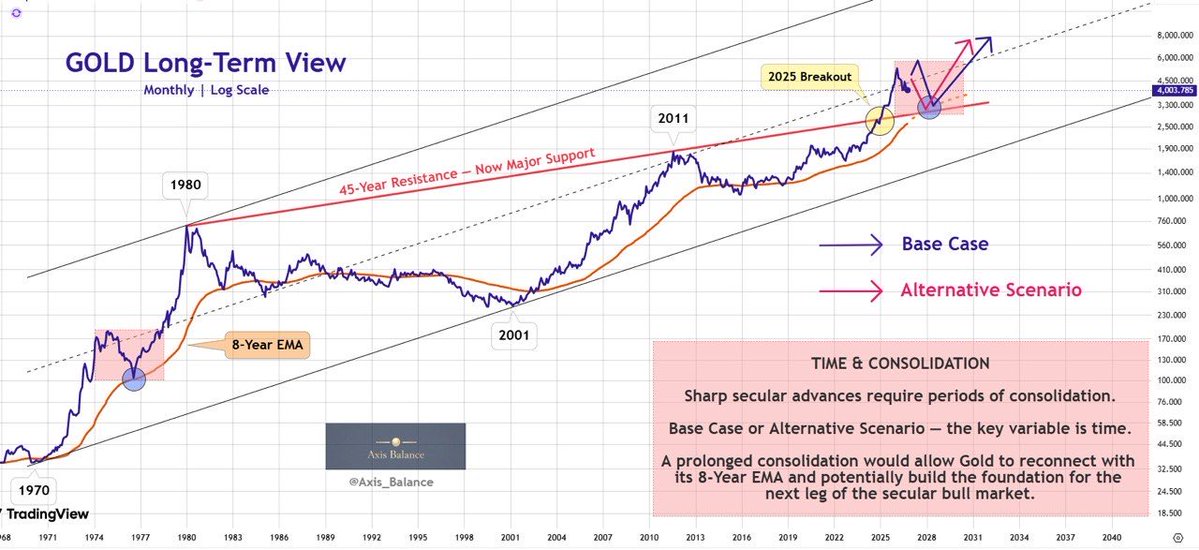
$3,500 and below? That’s where many see $GOLD heading next.
My view hasn’t changed: I believe we may have already seen a local bottom this summer, and the market is now retesting that low.
Gold often experiences seasonal weakness in Q4. This retest could be part of the process before the next move higher.
My targets remain at least $4,800, with a potential retest of the January high within the next 1–2 quarters.
Only after that could we see a deeper correction toward $3,500–$3,000, possibly closer to 2028.
Time will tell who’s right.
Not financial advice.
$XAUUSD
I don’t have a crystal ball, so I can’t tell you where silver will be on November 6. But as I mentioned in my post, historical bull cycles have seen silver consolidate for around four years after major advances.
I don’t expect a major move above $80 in the immediate future. In my view, prices around $60 or below could offer a good accumulation opportunity for long-term investors.
Not financial advice.
For long-term investors, $Silver is in a good accumulation zone. The January peak was a local high. The bigger move comes after the base is built. Not investment advice.
$Silver | The thesis hasn’t changed.
Back in June, I mapped out this long-term structure and price has now clearly bounced from the long-term support.
That is exactly what I wanted to see.
But this is not a short-term trade. The bigger picture is still a 45-year cup-and-handle structure, and these secular formations can take years to develop.
My view hasn’t changed:
Build the base. Respect the volatility. Let time do the work. The projected path remains illustrative, not a forecast.
DXY is sitting under descending resistance and on secular support. Same pattern since 2008. A break above the descending line is renewed dollar strength. A break below secular support is the structural shift. Muted on a selloff is a data point. The monthly close decides whether it becomes a trend.
@ThHappyHawaiian New lows don’t necessarily mean the downside is over. I’m watching for a local bottom here, with a potential recovery toward the $80 resistance zone. Let’s see if price follows the path on my chart.
$Silver miners have underperformed silver for over 15 years.
$SIL/XAGUSD is approaching multi-year resistance, but I don’t think we break out just yet.
Key resistance: 1.54–1.60. A breakout could signal a shift in relative strength.
For now, patience.
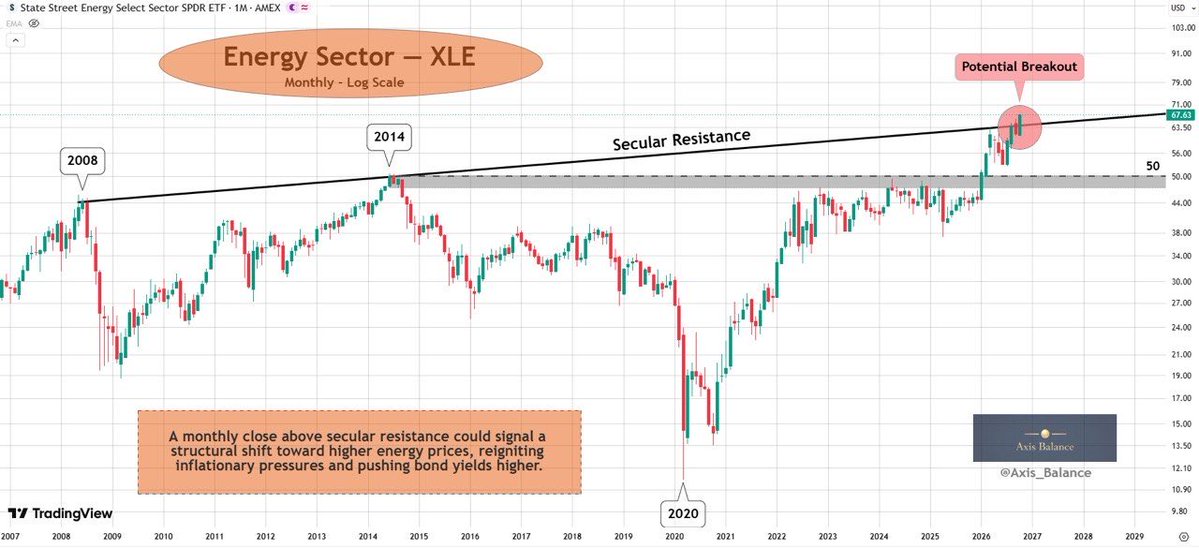
The $XLE ETF is testing secular resistance that has defined its long-term structure since 2008. A confirmed monthly breakout could signal a significant shift in the energy sector — with implications that extend far beyond energy stocks.
Higher energy prices can feed into production and transportation costs, adding to inflationary pressure. If inflation proves sticky, the Federal Reserve may have less room to ease monetary policy.
$Silver is still building a base after its January ATH. The $80–93 zone remains the major resistance. A sustained breakout is needed to signal a resumption of the bull trend. Until then, consolidation remains the base case. Patience over chasing.