I posted this earlier in the week on @RealVision, but thought it was worth sharing here as well, just to give everyone something to think about.
If you step back and look at the data, something interesting is happening in markets right now…
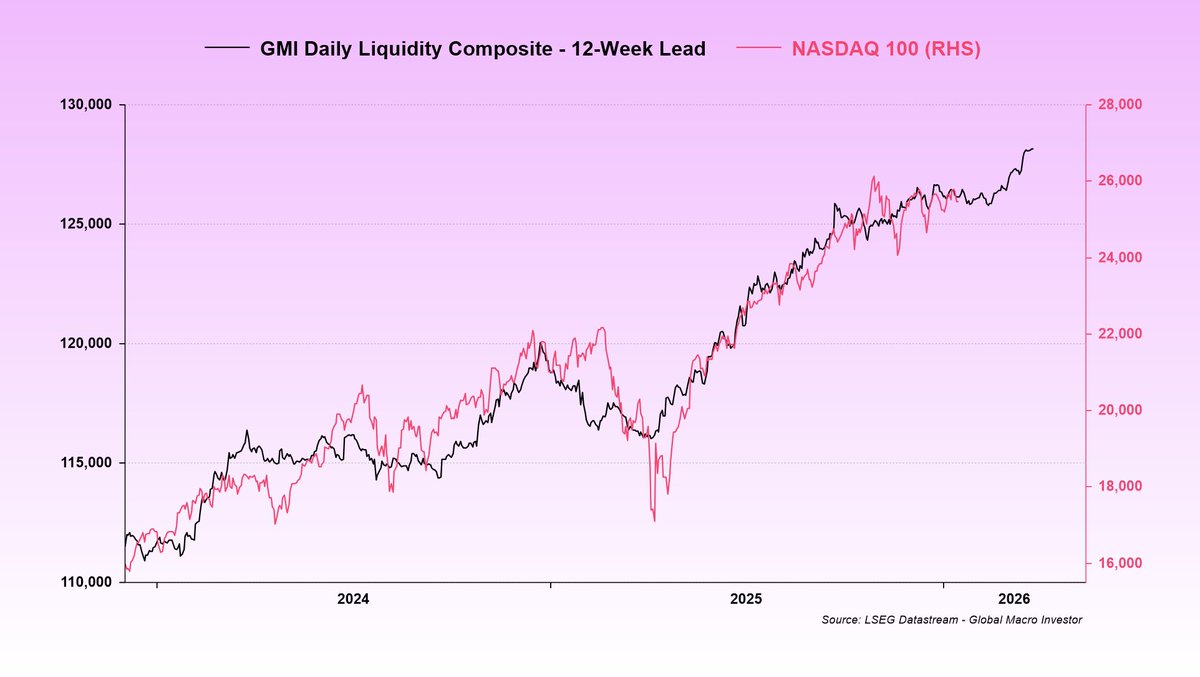
When you line up liquidity with equities, you get this (chart 1).
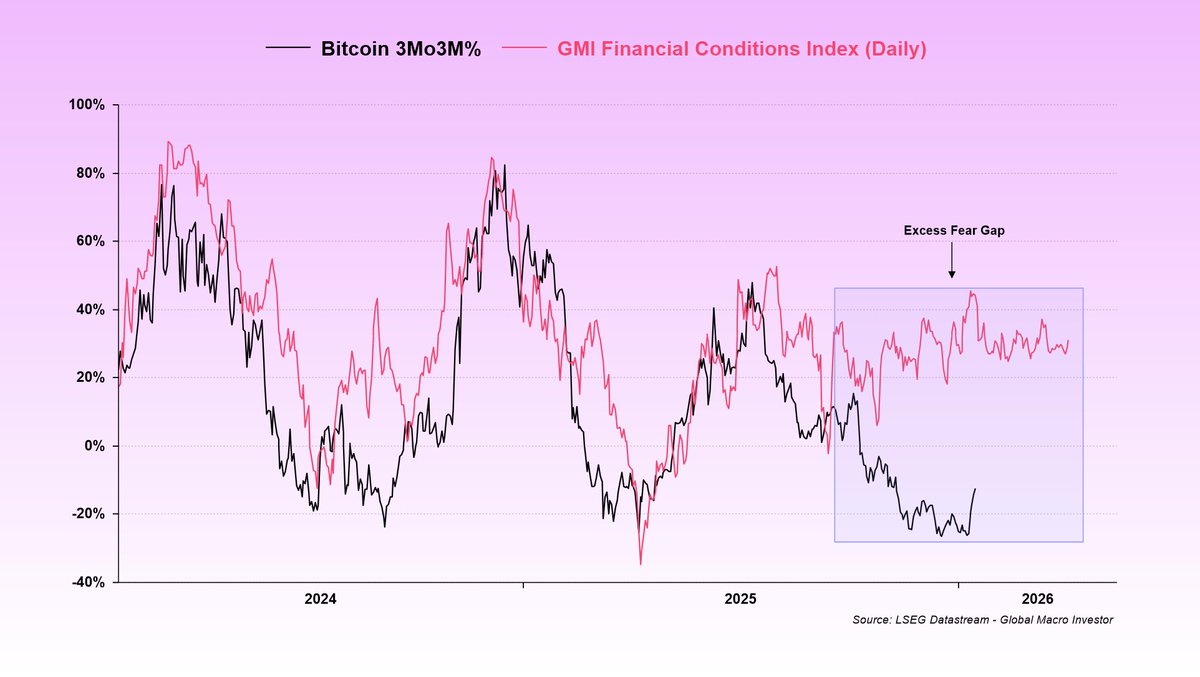
And then compare that with the same liquidity measure versus Bitcoin (chart 2), a simple truth emerges:
Both cannot be right...
Either equities are fundamentally mispricing liquidity despite trading near record highs, or Bitcoin is correctly signaling that the liquidity cycle has already peaked and that risk assets are about to roll over. Only one of these outcomes can ultimately be correct.
Now let’s separate data from opinion for a moment...
The data is clear:
Global liquidity has not yet peaked.
Now to my subjective view…
I think Bitcoin remains the outlier here, and that the events around 10/10 temporarily distorted price discovery, for reasons I’ve discussed at length previously.
Equities, credit, and broader risk assets are behaving exactly as you would expect in a rising liquidity regime. They’re hovering near all-time highs...
Bitcoin, by contrast, is pricing a liquidity peak that the data simply does not support at this stage.
At some point you have to step back and ask:
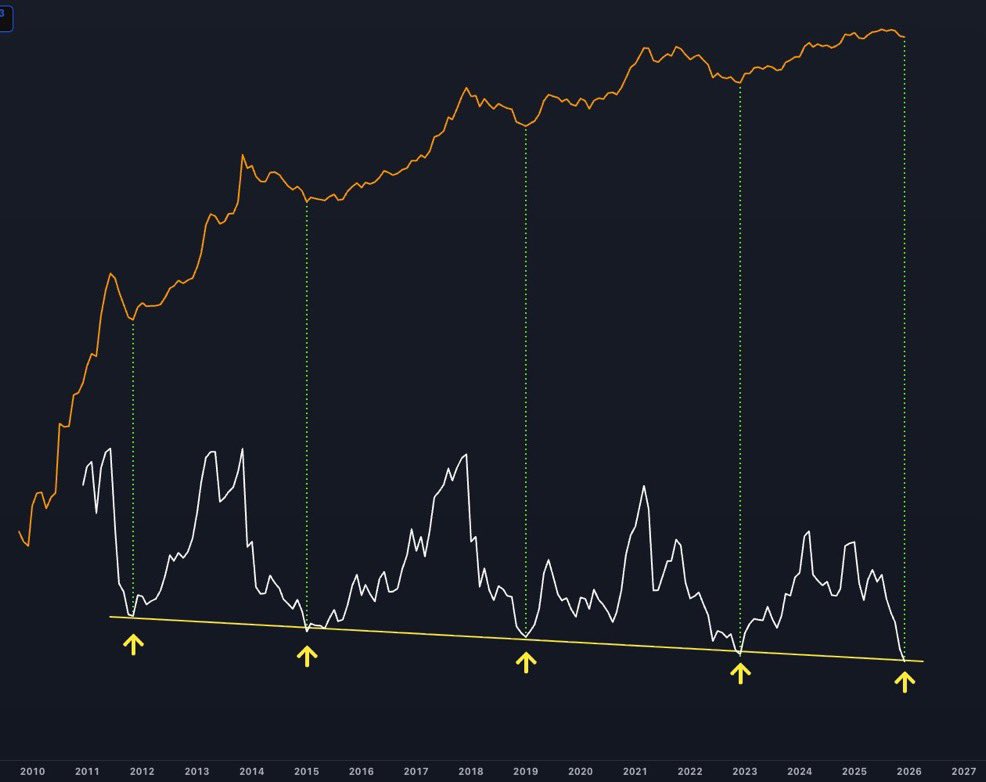
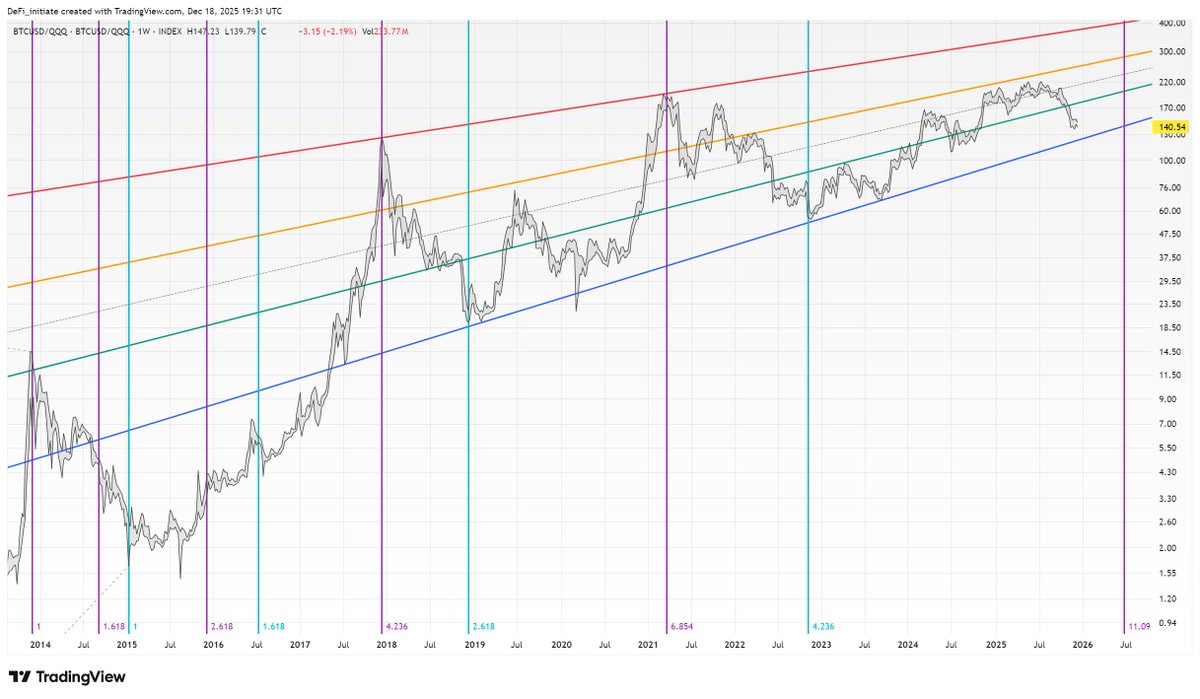
Is it more likely that one asset is right, or that every other BTC-correlated risk asset is wrong (chart 3)?
If you then layer in broader financial conditions, it stops being about opinion and becomes more about probabilities (chart 4).
What really stands out to me is the sheer magnitude of the “Excess Fear Gaps” that have opened up relative to the macro and liquidity fundamentals.
Right now, the weight of the evidence suggests liquidity is still rising and, in our view, will continue to rise, and that is what risk assets are reflecting.
That means Bitcoin is the anomaly.
What I’ve done here is present the data objectively and my view subjectively.
This is the battlefield for 2026.
The bull versus bear debate comes down to one thing and one thing only:
The direction of global liquidity...
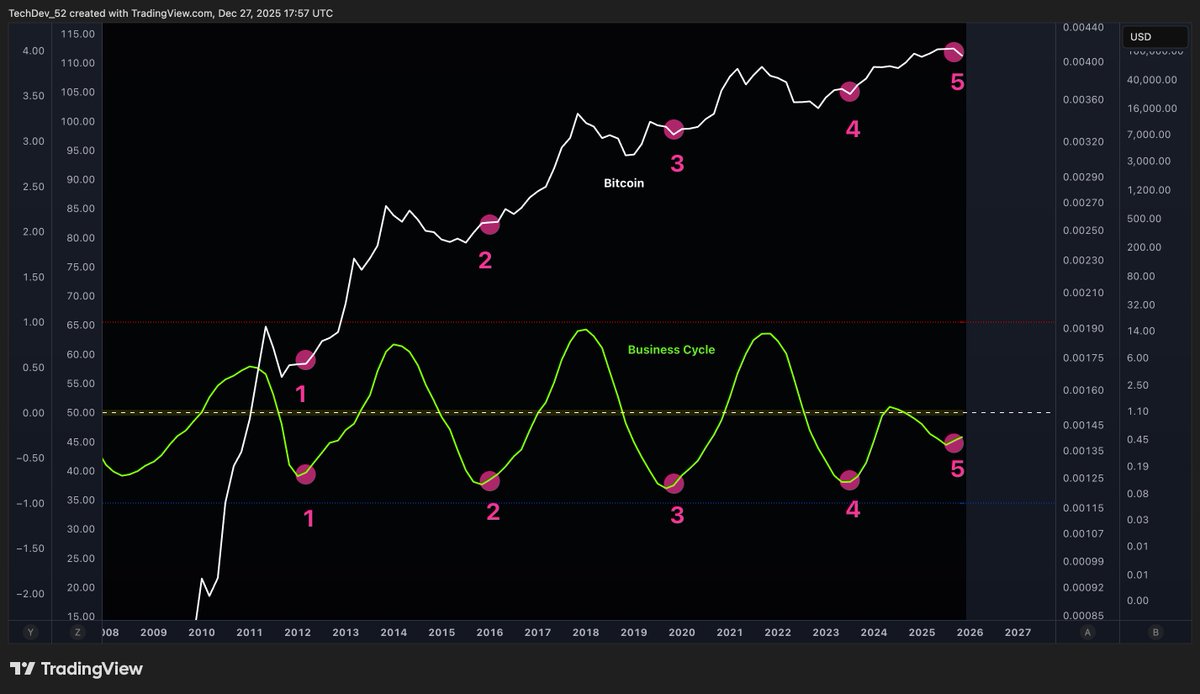
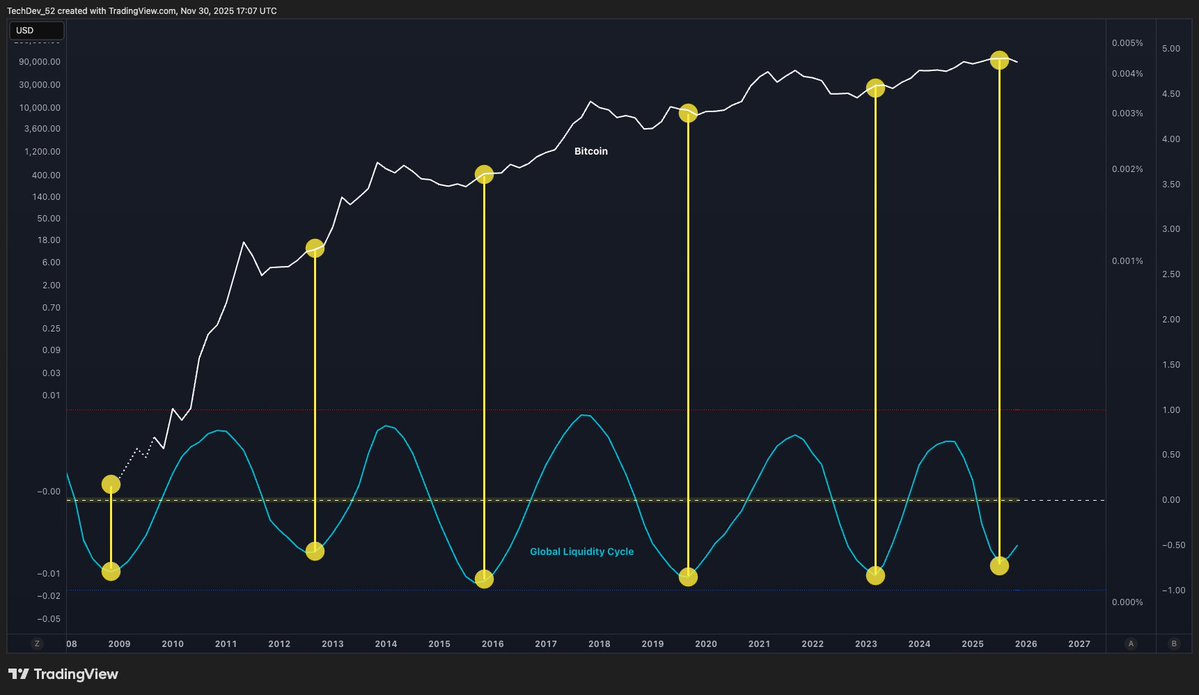
5th signal in the history of Bitcoin.
Business cycle inflections.
Each of the previous 4 started multi-month bull legs.
Note how different this business cycle has looked.
Hence how different this Bitcoin cycle has felt.
Higher for longer. Best part lies above midline.
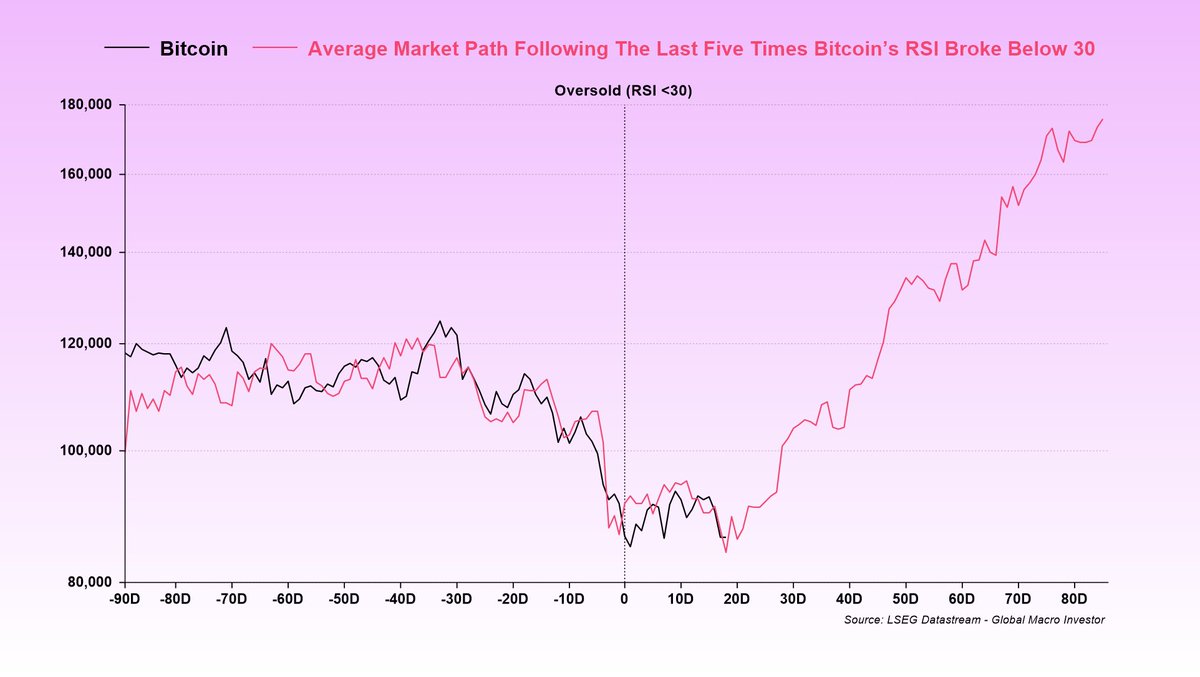
A lot of people have been asking for an update on this chart, so I’ll just leave this here for anyone who needs to see it.
This shows the average BTC trajectory following an oversold RSI reading, with RSI falling below 30 at t=0.
So far, it’s been pretty bang on.
Unless you believe the 4-year cycle is still in play, which we don’t, this chart should hold up contextually over time.
No, it won’t be perfect, but assuming the bull market isn’t already over, it’s a useful chart to keep in mind.
As we’ve outlined many times, based on our work on the business cycle, the current path of financial conditions, and our expectations for overall liquidity, the balance of probabilities is that this cycle extends well into 2026.
In that world, the 4-year cycle is dead.
Remember, the 4-year cycle was never about the halving, despite widespread belief that it is, but instead has always been driven by the public debt refinancing cycle, as outlined in our work at GMI, which post-COVID was pushed out by one year.
In our view, the 4-year cycle is now officially broken because the weighted average maturity of the debt term structure has increased.
And the bigger picture is that there is still a vast amount of interest expense that needs to be monetized, which has far exceeded GDP growth.
Another thing to keep in mind is that bases can take time to form and usually come with plenty of chop before the bigger up-move kicks in.
Finally, let me repeat what I said when I first posted this chart last month.
If you think the bull market is over and we are now facing twelve months of pain, this chart is not for you. Move along...
Many think "the cycle" has topped. Some think months ago.
What if we're barely halfway, with the parabolic phase yet to begin?
This cycle's uniquely glacial pace is confounding many.
Time can shake as many loose as volatility, if not more.
Business cycle wise, and macro structure wise (not just BTC), the most recent point of similar market positioning was October 2020.
Then: BTC 10k, ETH 300
Now: BTC 100k, ETH 3k
Both: Sentiment terrible
Poetry.