🚀BIT U.S. Stock Margin Trading· Officially Launched!
The Margin Trading public beta is officially available!
For every user trying margin for the first time, we've prepared a "0-cost trial" offer:
🎁 Offer 1: 【First-Time Margin → 30 Days 0% Interest】
· Interest-free limit of up to $20,000 per account
· Limited interest-free slots — available while they last
🎁 Offer 2: 【Interest Cashback Reward】
· After applying the interest-free benefit (Offer 1), tiered cashback is calculated on the actual margin interest you pay to the platform, up to $2,000 per account
· Total prize pool: $15,000 in cashback, first come first served
🗓 Campaign Period: June 26, 2026, 00:00 — July 30, 2026, 00:00 (UTC+8)
🎯Eligibility: Users who have completed identity verification (KYC) and meet the access requirements
Remember to update BIT app to the latest version
The gateway is open, first come, first served⬇️
⏰1 Day to Go · BIT US Stock Margin Trading Public Beta Launch
BIT's US Stock is introducing a new feature: Margin Trading enters public beta on June 26
Built on more than 7 years of institutional-grade DNA and a compliance infrastructure established through licensed broker-dealer channels, BIT is among the first to open up the US stock margin financing pipeline, helping clients improve capital efficiency in a transparent and controlled manner within a regulated framework
During the public beta, BIT is offering 2 promotions: limited-time 0% interest and an interest cashback reward. See below for more details⬇️
https://t.co/nLB1GLlIAk
🔔Spots are limited
First come, first served
BIT U.S. Stocks Launches Margin Trading Feature
BIT’s U.S. Stocks reaches another major milestone with the launch of its margin trading feature, which will enter public beta in 2 days (June 26).
This launch marks the completion of BIT’s investment workflow under a compliant framework—from holding real U.S. Stocks to accessing capital with additional flexibility. Backed by more than 7 years of institutional service expertise and a licensed brokerage compliance framework, BIT is committed to delivering leverage capabilities to eligible investors in a transparent and well-controlled manner.
To celebrate the public beta launch, BIT is introducing 2 promotional campaigns: "First Margin Loan · Limited-Time Interest-Free Offer" and "Interest Cashback Rewards." During the promotional period, eligible users who use margin trading for the first time will enjoy 0% interest for 30 days on their first margin loan.
Elio Cui, Head of Brokerage, commented:
"By introducing margin trading, BIT continues to build out its brokerage capabilities spanning account opening, trading, and leveraged financing. This enables BIT users to manage liquidity more flexibly and respond more quickly to investment opportunities, without relying on traditional banking rails or leaving the digital asset ecosystem."
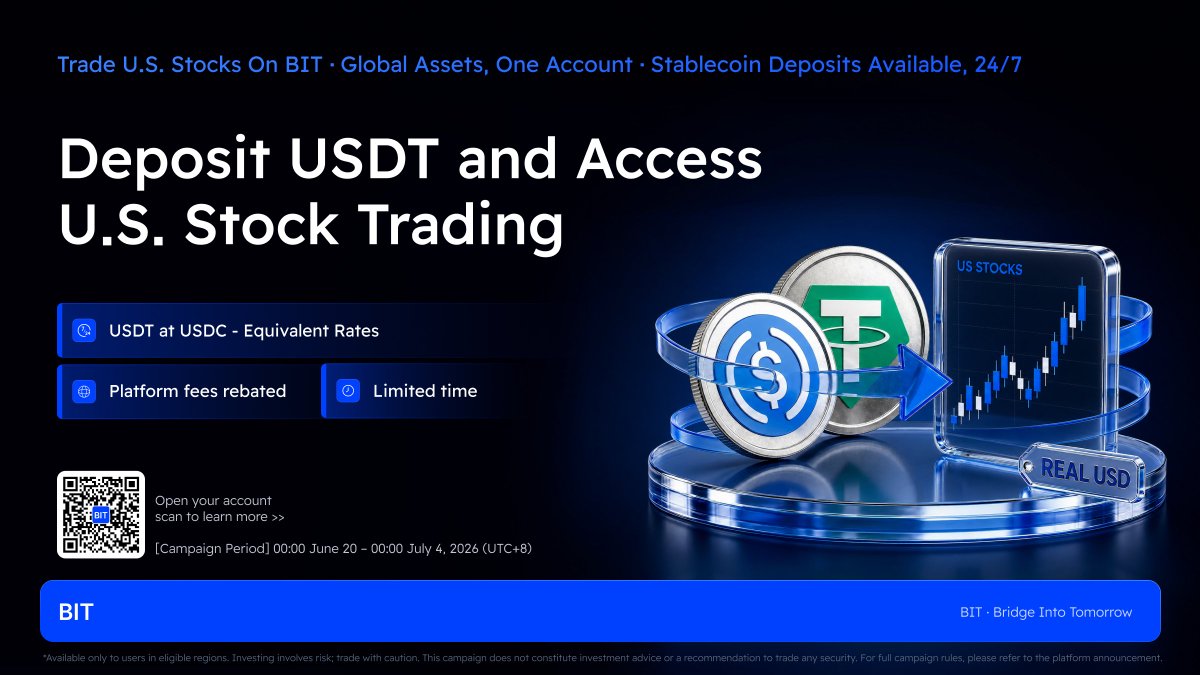
Crypto holders — you can now access U.S. stocks with stablecoins.
Deposit USDT. Trade U.S. stocks. No conversion headaches.
BIT accepts USDT at USDC-equivalent rates.
Limited-time campaign: 00:00 June 20 – 00:00 July 4, 2026 (UTC+8)
You have learned what ETFs are, how they are priced, and how they compare to other products. This final post covers the mechanism that keeps the entire ETF ecosystem functioning: the creation and redemption process.
This is one of the most overlooked aspects of ETF structure, and understanding it gives you a more complete picture of how ETFs work.
The key participant: Authorised Participants
ETFs involve a special category of large institutional participants known as Authorised Participants, or APs. These are typically large financial institutions such as banks or market makers that have a formal agreement with the ETF provider.
Ordinary retail investors do not interact with this mechanism directly. It operates at the institutional level behind the scenes.
How creation works
When demand for an ETF increases and its market price rises above its NAV, an AP can step in to create new ETF units.
To do this, the AP assembles a basket of the underlying securities that mirrors the ETF's holdings and delivers this basket to the ETF provider. In exchange, the ETF provider issues new ETF units to the AP, which the AP can then sell on the open market.
This process increases the supply of ETF units available in the market, which helps bring the market price back in line with the NAV.
How redemption works
The reverse process occurs when the ETF's market price falls below its NAV.
In this case, the AP purchases ETF units on the open market and delivers them back to the ETF provider. In exchange, the ETF provider returns the equivalent basket of underlying securities to the AP.
This process reduces the supply of ETF units in the market, which helps support the market price back toward NAV.
Why this matters
The creation and redemption mechanism is what distinguishes ETFs structurally from closed-end funds, which have a fixed number of units and can trade at persistent premiums or discounts to NAV.
Because ETF supply can expand and contract in response to market demand, the gap between market price and NAV is generally kept narrow through this ongoing arbitrage process. As noted in Post 3, small premiums or discounts may still persist, particularly in less liquid ETFs.
A structural characteristic of the redemption mechanism
When an AP redeems ETF units in exchange for the underlying securities, this transaction occurs as an in-kind exchange rather than a cash sale. This means the ETF itself does not need to sell its holdings to meet redemptions. The implications of this structure vary by jurisdiction and fund type.
Putting it all together
The seven posts in this series have covered the full foundation of ETF literacy:
Post 1: What is an ETF
Post 2: Types of ETFs
Post 3: How ETFs are priced
Post 4: Understanding the expense ratio
Post 5: ETF vs individual stock
Post 6: ETF vs mutual fund
Post 7: How ETF creation and redemption works
Disclaimer: ETFs are subject to market risk and do not guarantee returns. The value of an investment may rise or fall.
For informational purposes only. This does not constitute financial advice or a recommendation to buy or sell any product.
Your crypto. Your stocks. One account.
Deposit USDT and start trading U.S. stocks on BIT — at USDC-equivalent rates, with platform fees rebated.
Campaign runs 00:00 June 20 – 00:00 July 4, 2026 (UTC+8)
ETFs and mutual funds are both pooled investment products that hold a collection of underlying securities. However, they differ in several important structural ways.
How they are traded
This is the most fundamental difference between the two.
ETFs are traded on exchanges during market hours, just like stocks. Their price changes continuously throughout the trading day based on supply and demand.
Mutual funds are not traded on an exchange. Instead, investors buy and sell directly through the fund provider. Transactions are processed once per day, after the market closes, at the fund's official end-of-day NAV.
This means an investor in an ETF can see and act on price changes throughout the day. An investor in a mutual fund does not know the exact price they will transact at until after the market closes.
Minimum investment
Mutual funds often require a minimum initial investment, which can range from hundreds to thousands of dollars depending on the fund.
ETFs can generally be purchased in any quantity, subject to the price of one unit. On platforms that support fractional shares, investors may be able to access ETFs with smaller amounts.
Fee structures
Both ETFs and mutual funds charge ongoing management fees, expressed as an expense ratio.
Actively managed mutual funds have historically carried higher expense ratios than passively managed index ETFs, though this varies across fund types and providers.
Some mutual funds also charge sales loads, which are fees applied at the point of purchase or redemption. Most ETFs do not carry sales loads, though standard trading fees may apply.
Active vs Passive management
Mutual funds are more commonly associated with active management, where a fund manager makes decisions about which securities to hold in pursuit of a specific objective.
ETFs are more commonly associated with passive management, tracking a predetermined index. However, actively managed ETFs do exist and have grown in number in recent years.
Transparency
ETFs are required to disclose their holdings regularly, typically on a daily basis for most index ETFs. Mutual funds generally disclose holdings less frequently than ETFs, with disclosure schedules varying by fund and jurisdiction.
Accessibility
ETFs are accessible to any investor with a brokerage account that supports exchange-traded products. Mutual funds may have additional eligibility requirements or distribution restrictions depending on the jurisdiction.
Disclaimer: ETFs are subject to market risk and do not guarantee returns. The value of an investment may rise or fall.
For informational purposes only. This does not constitute financial advice or a recommendation to buy or sell any product.
Here's exactly what you get when you sign up during our campaign:
$100 platform-fee voucher
$0 commission on U.S. stock trades
Real-time quotes, Level 1
USDT deposited at USDC-equivalent rates
Rebates on eligible platform fees
Campaign ends July 4.
Looking for more ways to use your stablecoins?
BIT lets you trade U.S. stocks directly with stablecoins — 24/7 deposits, one account.
Eligible platform fees are rebated during our campaign. Don't miss it.
June 20 – July 4, 2026
Two of the most common ways to access the US stock market are through individual stocks and ETFs. Here is how the two differ structurally.
What you are buying
When you buy an individual stock, you are purchasing ownership in a single company. Your exposure is concentrated entirely in that one business.
When you buy an ETF, you are purchasing a single product that holds a collection of underlying securities. Your exposure is spread across all the holdings inside that ETF.
Concentration vs Diversification
An individual stock's performance is tied directly to the fortunes of one company. A single corporate event, earnings miss, or sector development can have a significant impact on its price.
An ETF's performance reflects the collective movement of all its holdings. The impact of any single holding is proportional to its weighting within the fund.
Pricing and Trading
Both individual stocks and ETFs are traded on exchanges during market hours. Both can be bought and sold at market prices in real time throughout the trading day.
Costs
Individual stocks generally do not carry an ongoing management fee. ETFs carry an expense ratio, which is deducted from the fund's NAV over time.
Both may be subject to trading fees and bid-ask spreads depending on the platform used.
Ownership rights
When you hold an individual stock directly, you hold a direct ownership stake in that company, with associated rights such as dividends and shareholder voting where applicable.
When you hold an ETF, you own units of the fund rather than the underlying securities directly. ETFs are structured as either distributing or accumulating. Distributing ETFs pass dividends from the underlying holdings through to unitholders periodically.
Accumulating ETFs reinvest those dividends back into the fund automatically.
Transparency
Individual stock holdings are straightforward as you know exactly what you own. ETF holdings are disclosed regularly by the fund provider, typically on a daily basis for most index ETFs.
Disclaimer: ETFs are subject to market risk and do not guarantee returns. The value of an investment may rise or fall.
For informational purposes only. This does not constitute financial advice or a recommendation to buy or sell any product.
When you buy an ETF, there is one ongoing cost you should be aware of. It is called the expense ratio.
What is an expense ratio?
The expense ratio is the annual fee charged by the fund provider to manage the ETF. It covers operational costs such as fund administration, portfolio management, and regulatory compliance.
It is expressed as a percentage of the amount you have invested in the ETF.
A simple example:
If an ETF has an expense ratio of 0.10% and you hold $10,000 worth of that ETF, the annual fee amounts to $10.
How is it deducted?
The expense ratio is not billed to you directly. It is deducted gradually from the NAV of the ETF on a daily basis. This means you will not see a separate charge on your account. Instead, it is already reflected in the ETF's price over time.
Where can you find it?
Every ETF is required to disclose its expense ratio publicly. It is typically found on the ETF provider's website, the fund factsheet, or on financial data platforms. It is one of the first figures to look up when researching any ETF.
How do ETF expense ratios generally compare?
ETFs are generally known for carrying lower expense ratios compared to actively managed funds, though this varies across fund types and providers. Passive index-tracking ETFs tend to have lower expense ratios than thematic or actively managed ETFs.
As a reference point, broad market index ETFs in the US market have historically carried expense ratios ranging from as low as 0.03% to around 0.20%. Thematic and actively managed ETFs can carry higher ratios.
A note:
The expense ratio is one of several factors that may affect the overall cost of holding an ETF. Other costs such as trading fees and bid-ask spreads may also apply depending on the platform and market conditions.
Disclaimer: ETFs are subject to market risk and do not guarantee returns. The value of an investment may rise or fall.
For informational purposes only. This does not constitute financial advice or a recommendation to buy or sell any product.
How ETFs Are Priced
You know what an ETF is. But do you know how its price is determined? This is one of the most commonly misunderstood aspects of ETFs.
Two numbers matter: NAV and Market Price
Every ETF has two prices at any given time.
The first is the Net Asset Value, or NAV. This represents the total value of all the assets held inside the ETF, divided by the number of units outstanding. During trading hours, an indicative NAV is calculated and published in real time as an estimate. The official NAV is calculated once per day after the market closes.
The second is the Market Price. This is the price at which the ETF is actually trading on the exchange at any given moment during market hours.
Why are they different?
Because ETFs trade on an exchange like a stock, their market price is determined by supply and demand in real time. If more people are buying than selling, the market price can rise above the NAV. If more people are selling, it can fall below.
When the market price is above NAV, the ETF is said to be trading at a premium. When the market price is below NAV, it is said to be trading at a discount.
How does the price stay close to NAV?
There is a mechanism in place to help keep the two prices closely aligned. Large institutional participants known as Authorised Participants can create or redeem large blocks of ETF units directly with the fund provider. This process of creation and redemption incentivises arbitrage activity that tends to narrow any gap between the market price and NAV, though small premiums or discounts may persist, particularly in less liquid ETFs.
ETFs vs Mutual Funds on pricing:
This is where ETFs differ meaningfully from mutual funds in structure. Mutual funds are priced once per day, after the market closes, based on their NAV. ETFs on the other hand are priced continuously throughout the trading day, just like a stock.
This means an investor buying an ETF at 10 am and another buying at 3 pm on the same day may pay different prices.
Disclaimer: ETFs are subject to market risk and do not guarantee returns. The value of an investment may rise or fall.
For informational purposes only. This does not constitute financial advice or a recommendation to buy or sell any product.
Not all ETFs are the same. Here is a breakdown of the main types available to investors today.
Equity ETFs
The most common type. An equity ETF holds a collection of stocks, either tracking a broad market index or focusing on a specific region or market segment.
Example: An ETF tracking the S&P 500 holds shares across 500 of the largest U.S.-listed companies.
Bond ETFs
Instead of stocks, these ETFs hold fixed income instruments such as government bonds or corporate bonds. They are generally used by investors seeking more stable, income-oriented exposure.
Sector ETFs
These focus on a specific industry or sector of the economy, such as technology, healthcare, energy, or financials. Rather than broad market exposure, sector ETFs concentrate on one segment.
Commodity ETFs
These provide exposure to physical commodities such as gold, silver, or oil, without the investor needing to hold the physical asset directly.
Thematic ETFs
A newer and growing category. Thematic ETFs focus on a specific trend or idea, such as artificial intelligence, clean energy, or cybersecurity. Holdings are selected based on their relevance to the theme rather than a traditional index.
International ETFs
These provide exposure to markets outside of the U.S., such as emerging markets, European equities, or specific countries. They allow investors to access global markets through a single product.
A note on risk:
Disclaimer: ETFs are subject to market risk and do not guarantee returns. The value of an investment may rise or fall.
For informational purposes only. This does not constitute financial advice or a recommendation to buy or sell any product.
New to investing? Here is an introduction to ETFs.
What is an ETF?
ETF stands for Exchange-Traded Fund.
Think of it like a basket. Instead of buying one stock, you are buying a single product that holds many stocks inside it, all in one purchase.
A simple example:
The S&P 500 is an index that tracks the 500 largest companies in the US, including Apple, Microsoft, and Amazon.
Investors who buy an S&P 500 ETF gain exposure to all 500 companies through a single product.
Key characteristics of ETFs:
Diversification. A single ETF can hold exposure to many companies across different sectors.
Tradability. ETFs are bought and sold on exchanges during market hours, similar to regular stocks.
Cost structure. ETFs generally carry an annual management fee, known as the expense ratio.
Transparency. ETF holdings are typically disclosed publicly and updated regularly.
Accessibility. ETFs are available in a range of price points, including fractional shares on some platforms, such as BIT.
Disclaimer: ETFs are subject to market risk and do not guarantee returns. The value of an investment may rise or fall.
For informational purposes only. This does not constitute financial advice or a recommendation to buy or sell any product.
BIT Adds Clear Street as Clearing Partner, Strengthening US Equities Infrastructure
As BIT's US equities business continues to scale, BIT (formerly Matrixport) has onboarded Clear Street, a US institutional-grade clearing firm, as a new partner. This marks a significant step forward in BIT's commitment to building a higher-standard foundation for its US equities operations.
BIT's US equities business operates under an Omnibus IB architecture, where all orders are cleared and custodied by US-licensed clearing institutions. BIT has now established partnerships with three US-licensed firms: Clear Street, RQD Clearing, and Atomic Vaults Securities (AVS).
Among these, Clear Street is backed by approximately $1 billion in funding and a strong capital base, processing roughly 550 million shares and approximately $28.4 billion in notional trading volume daily. This gives Clear Street the clearing and execution capacity to serve large institutional clients.
For BIT users, this translates to more robust institutional-grade infrastructure behind every trade — greater system stability, reduced risk of disruptions or delays during volatile market conditions, and stronger liquidity support and asset protection.
Compared to the industry-standard model of relying on a single clearing partner, BIT's multi-institution clearing architecture more effectively distributes operational risk and improves the stability and continuity of trade execution.
BIT has stated that in selecting clearing partners, the platform will continue to evaluate key metrics including asset scale, net capital levels, and risk management capabilities, in order to meet the asset allocation needs of its global user base.
Clear Street is regulated by the US SEC (CRD#288933). Regulatory information is publicly available via FINRA BrokerCheck: https://t.co/g763qi3dOv
Data source: Clear Street official website
Transparency is part of the product.
Here's every fee you'll encounter trading US stocks on BIT — no surprises, no hidden layers:
Trading Commission — Waived
Platform Fee — $0.005/share (min. $0.99/order)
Funding your account with USDC/USDT? Conversion fees* scale with your size:
▪️ Up to $10K → 0.20%
▪️ $10K–$100K → 0.15%
▪️ $100K–$1M → 0.10%
▪️ $1M–$5M → 0.08%
▪️ Over $5M → 0.06%
Know exactly what you're paying. Invest with confidence.
*USDC/USDT conversion fees are subject to change. Please refer to the latest fee schedule on the platform.
The bridge between crypto and US equities is here.
BIT gives you real US stock market access — backed by a licensed broker-dealer. That means genuine ownership of US-listed equities, with dividends and shareholder voting rights where applicable.
Here's what that looks like in practice:
Real stocks, real ownership — Exposure to underlying US-listed equities, with the rights that come with it
Fund with USDT/USDC, 24/7 — Deposit and withdraw stablecoins around the clock, no fiat wiring needed
One platform, two worlds — Manage your crypto and US stocks/ETFs side by side, and shift allocations freely as markets move
Onboarding follows standard KYC/AML — streamlined and built for investors
Your portfolio. Your strategy. One platform.