Day 22/90 —Well Log Analyzer
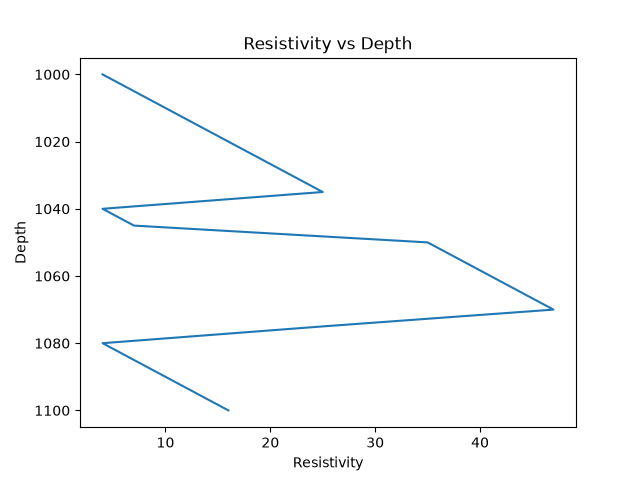
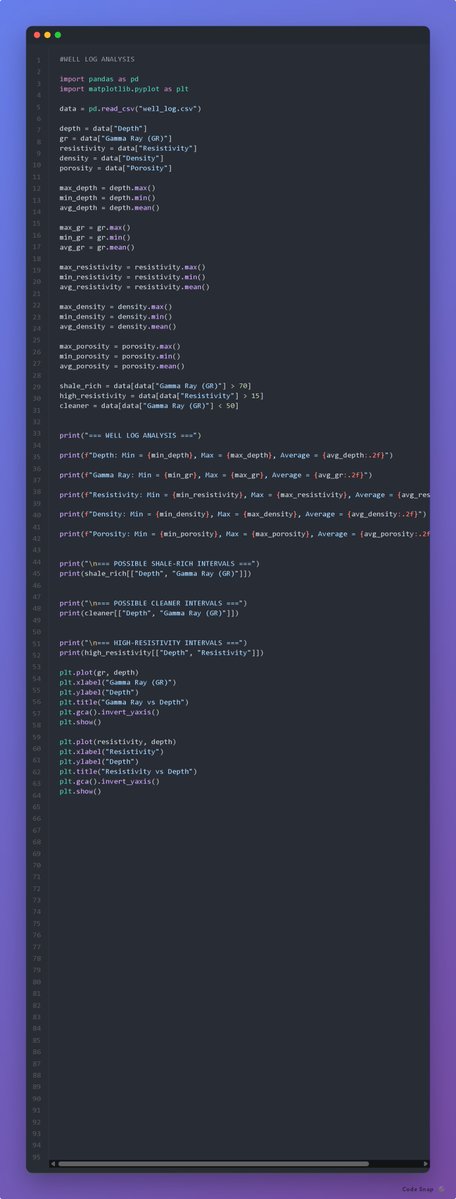
Built a Python well log analyzer using Pandas and Matplotlib. It calculates log statistics, identifies possible shale-rich, cleaner, and high-resistivity intervals, and visualizes Gamma Ray and resistivity against depth.
Applying Python to geophysics.
Day 22/90 —Well Log Analyzer
Built a Python well log analyzer using Pandas and Matplotlib. It calculates log statistics, identifies possible shale-rich, cleaner, and high-resistivity intervals, and visualizes Gamma Ray and resistivity against depth.
Applying Python to geophysics.
Day 22/90
Today, I’m working on a Well Log Analyzer with Python.
I’ll be using Pandas to analyze Gamma Ray, resistivity, density, and porosity data, then Matplotlib to visualize the logs against depth.
Another step toward combining Python with geophysics.
Day 21/90 — Geophysics Data Analyzer
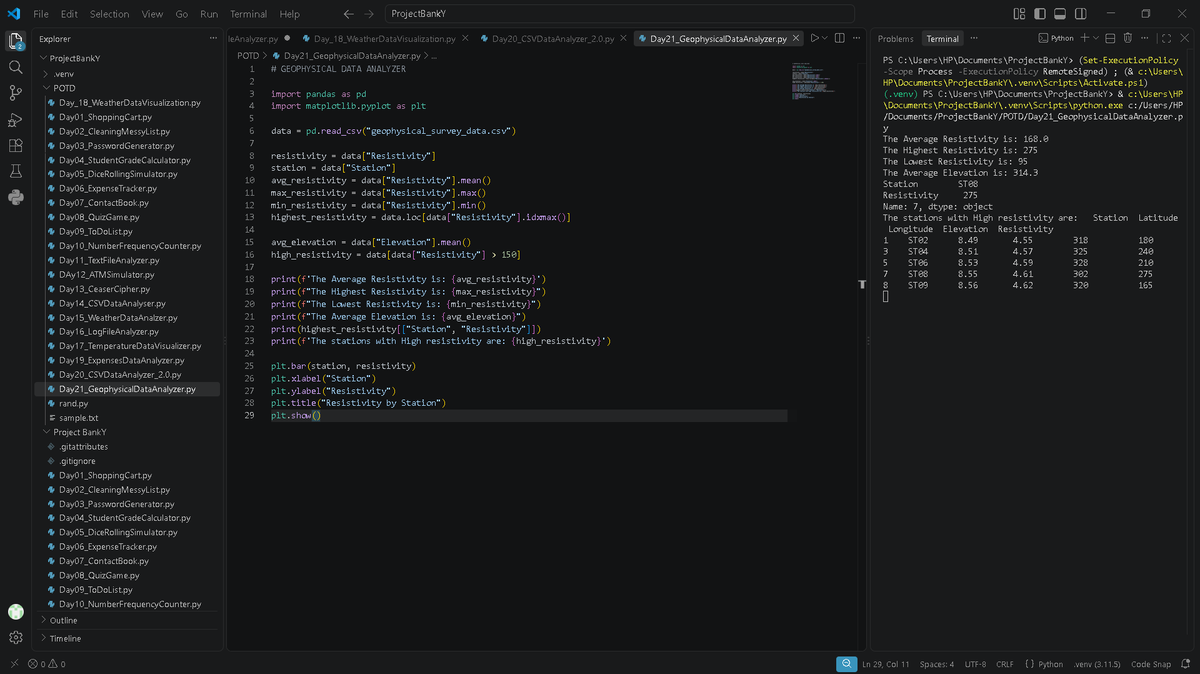
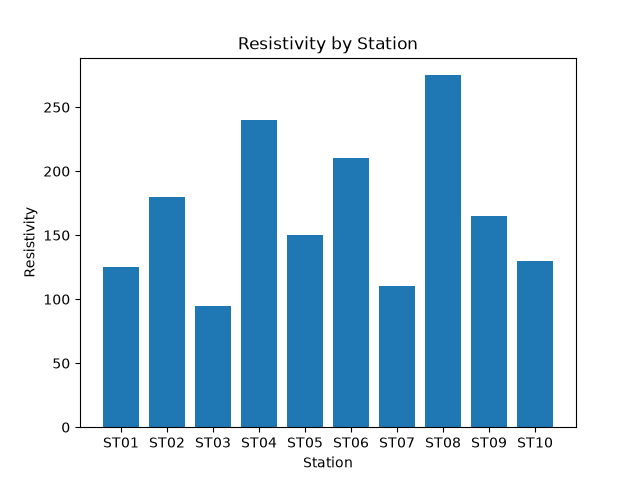
Used Pandas to analyze resistivity data, calculate key statistics, filter stations, and find the highest reading. Matplotlib was used to visualize resistivity across stations.
Taking Python closer to real geophysical applications.
#Python
Day 21/90
Today, I’m building a Geophysical Data Analyzer with Python.
I’ll be using Pandas to analyze survey data and Matplotlib to visualize resistivity measurements.
Taking Python a little closer to geophysics.
#Python#Geophysics#Pandas#Matplotlib#90DaysOfCode
Day 20/90 — CSV Data Analyzer
Built a student performance analyzer using Pandas and Matplotlib.
It reads CSV data, calculates key statistics, compares departments, identifies top students, and visualizes average scores.
#Python#Pandas#Matplotlib#90DaysOfCode
Day 20/90
Today’s project: building a Student Performance Data Analyzer with Python.
I’ll be using Pandas to clean, analyze and extract insights from a CSV dataset, then Matplotlib to visualize the results.
Time to get more comfortable with data.
#Matplotlib#90DaysOfCode
Day 19/90 — Expense Data Analyzer
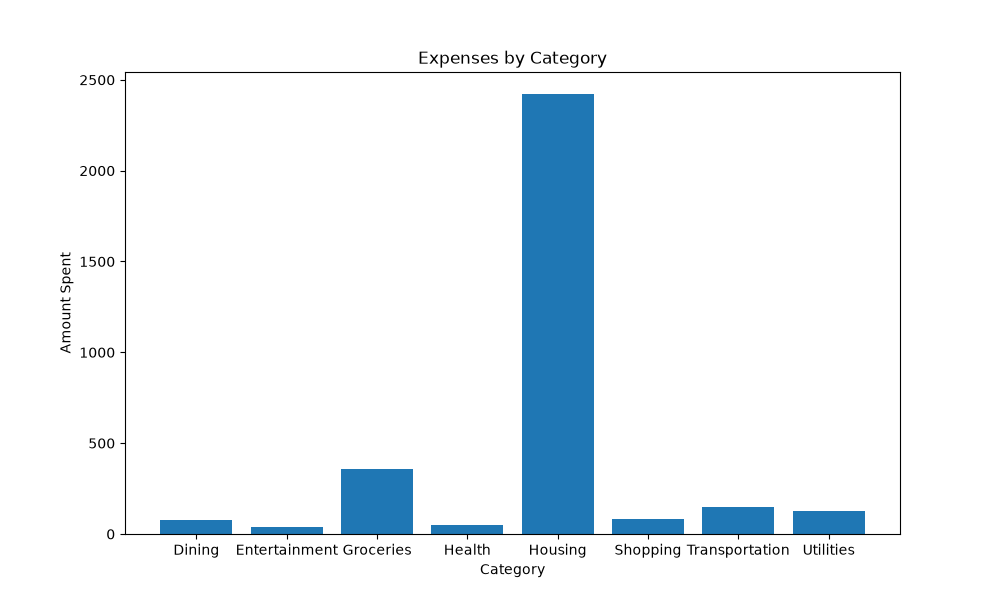
Built an expense analyzer with Pandas and Matplotlib.
It calculates total, average and highest expenses, analyzes spending by category, and visualizes spending patterns with bar and line charts.
#Python#Pandas#Matplotlib#90DaysOfCode
Day 19/90 — Expense Data Analyzer
Today, I’m building an Expense Data Analyzer using Pandas and Matplotlib.
I’ll analyze spending patterns and visualize where the money goes.
#Python#Pandas#Matplotlib#90DaysOfCode
The past few days have been overwhelming. I’ve been really occupied with personal life and work, and it affected my daily projects and posts.
But we’re back on track.
Let’s get Day 19 started!!
Day 18/90 — Weather Data Visualization
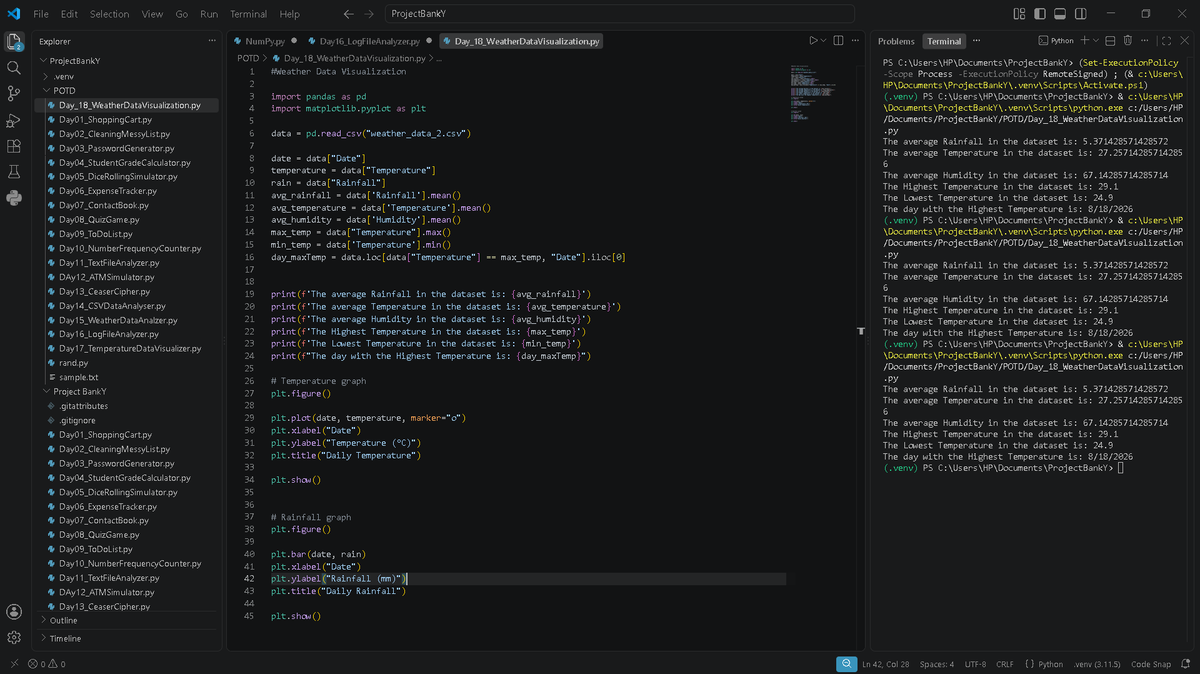
Today I combined Pandas and Matplotlib to analyze and visualize weather data.
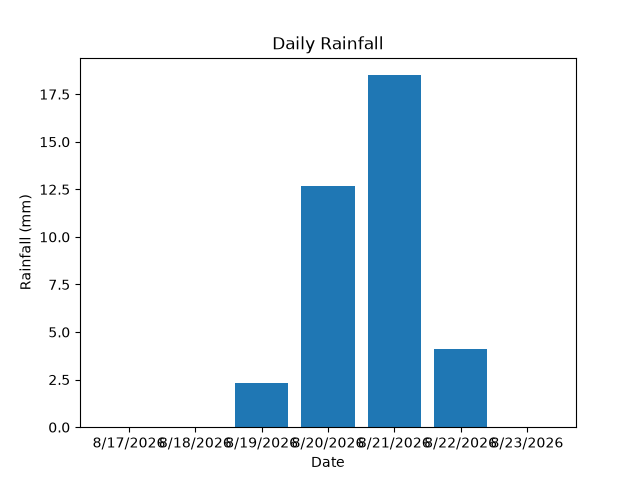
I created a temperature line graph and a rainfall bar chart from a CSV dataset.
#Python#Pandas#Matplotlib#90DaysOfCode
Day 18/90
Today, I’m combining Pandas and Matplotlib to turn weather data into useful visualizations.
Time to make the data speak.
#Python#Pandas#Matplotlib#90DaysOfCode
Day 17/90
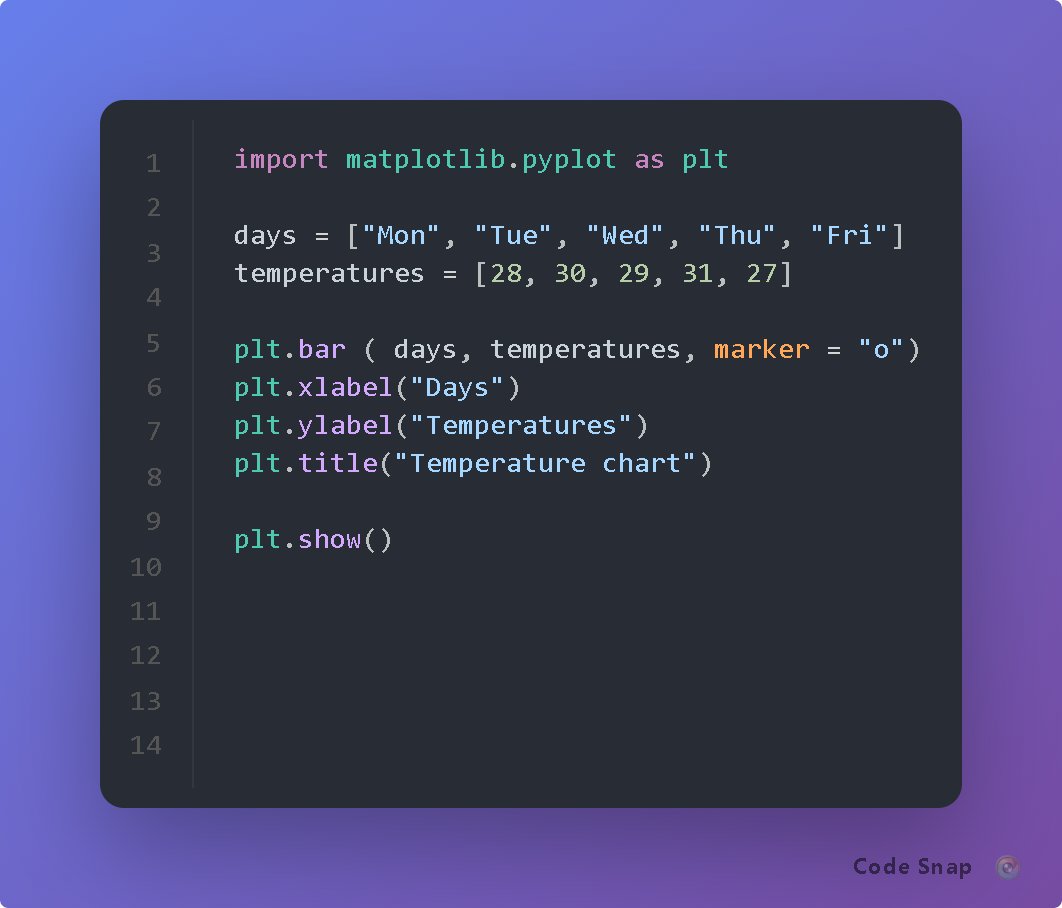
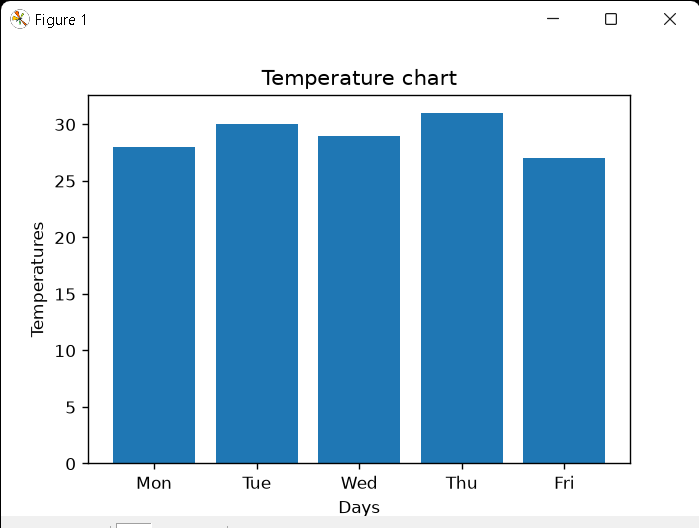
Started learning Matplotlib by creating a simple temperature chart.
Today I learned how to visualize data using bar charts, labels, titles, and https://t.co/Orql1mvl9E().
Small step, but we’re moving.
#Python#Matplotlib#90DaysOfCode
Day 17/90
Today, I’m learning Matplotlib and building a simple temperature data visualizer in Python.
I’ve worked with data before. Today, I’m learning how to actually visualize it.
One step at a time.