#Bitcoin – What's Next?
The Big Sunday Report: All We Need to Know
🚩 TA / LCA / Psychological Breakdown:
Today I want to share something very important that almost no one is talking about. At least I have not seen a single account on X pointing this out yet, and the best part is that it aligns perfectly with the capitulation event I have been expecting since the start of Stage 5. So what is it? In 2022, Bitcoin saw a death cross on the 1-week chart, with the white line crossing below the blue line. That death cross happened right after BTC lost the MA200 weekly. Two months after the death cross, the capitulation candle printed at 15-16k, and Bitcoin went down another 30% after the death cross. This is exactly what marked the end of the previous bear market. Now look at what is happening right now in 2026.
First, BTC lost the MA200 weekly. Same as 2022. Second, BTC is now showing the same white-crossing-blue structure on the 1-week chart that preceded the previous death cross, and the death cross is loading once again. Third, in 2022 BTC dropped 30% after the death cross. The same setup is loading right now. Do you notice the pattern? The repeat is in front of us, on the same indicators, with the same structural sequence. It is also worth mentioning that I made a clear warning recently regarding the MA200 weekly, and I told you I did not believe it would hold. The big mistake many people made is buying right into the MA200 weekly support, believing it is a strong support, and we are not below it and lost it. Recent buyers are trapped and they keep arguing their mistakes with: "It does not matter at what price Iam buying" And I showed many times that indeed it mattes, it matters a lot! Entry is everything and whoever fails to understand this shouldnt trade.
Another CRUCIAL point: In every bear market in Bitcoin history, BTC has always dropped 30% below the MA200 weekly. Always. Not once, not twice, every single time. And let me add the salsa on top of the food: every bear market ended with a capitulation event, never with a slow grind back up from the MA200 weekly. So I ask: what makes this cycle different? Why would people blindly buy at current prices believing the MA200 weekly will hold for the first time in Bitcoin history? People are free to do what they want, and I respect their decision, but I am skipping this zone and I will buy lower. The math is simple, the pattern is in front of everyone, and yet most still refuse to see it.
Why This Aligns With the CBB:
If we take the current level around 60k as the reference and apply the historical 30% drop pattern, we land directly in the 42-43k zone. This is exactly the CBB region I have been pointing to since September 2025! Exactly where the BlackRock ETF launched, exactly where the Golden Bull bottom support sits, and exactly where my September-October 2026 timeline projects the bottom, and I expect it to be hit in September - October! Multiple independent indicators are converging toward the same target zone. This is why Premium is important and very few will understand.
We are now several weeks into Stage 5: Whoever does not know what Stage 5 is , please read the previous Sunday reports. The white-crossing-blue structure forming again is the next confirmation that the architecture is playing out as designed. Capitulation has not happened yet and the fear is building and has not reached a peak level yet. You havent seen a bottom yet if you believe it was the bottom. At the same time realized losses are growing, but the extreme single-event moment has not arrived. To make it very short: I am waiting for the total capitulation event! Its only two days to go and the doors for the free premium membership trial ends. You can join now before the free trial ends: https://t.co/SBmkqCq0oI
THIS IS NO FINANCIAL ADVICE BUT EDUCATIONAL CONTENT ONLY.
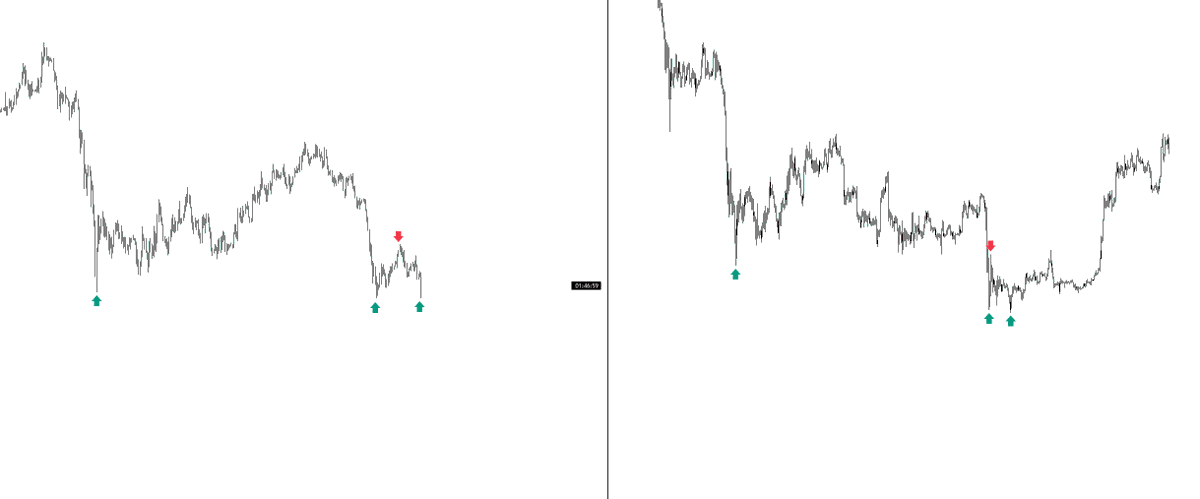
Getting some 2022 PTSD right now on $BTC.
I don't even think this will play out, if I'm honest. Very low chance.
Just an interesting pattern I thought was worth sharing.
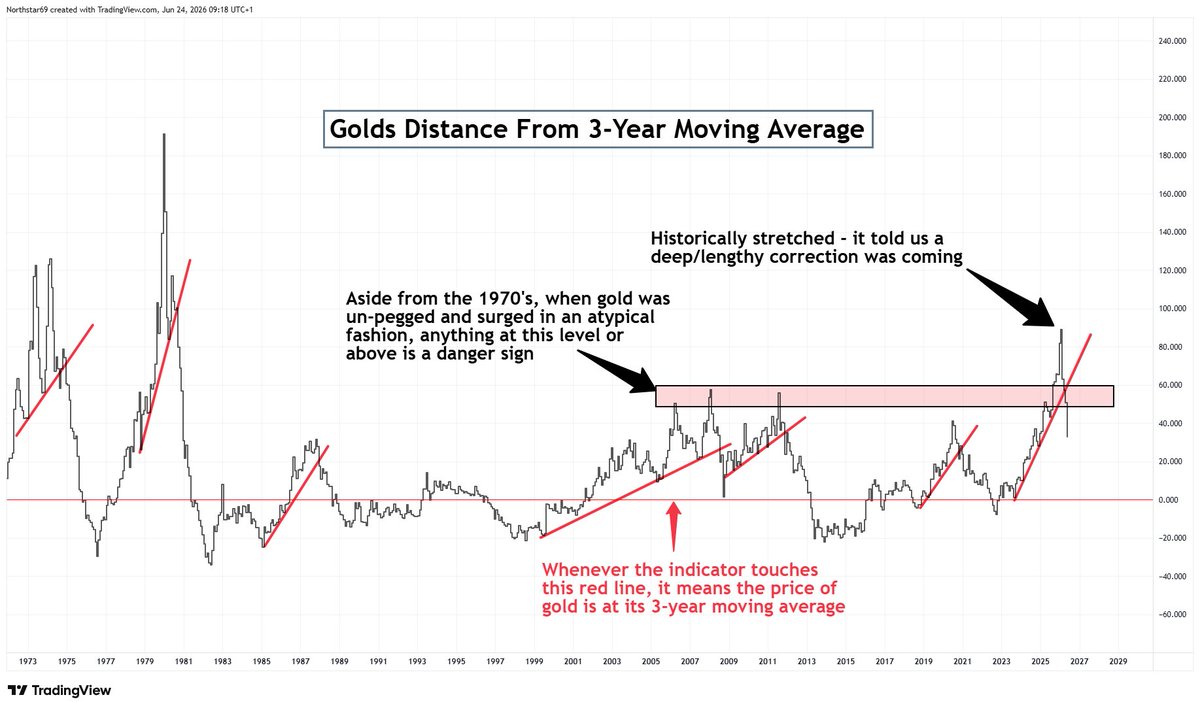
GOLD & SILVER: Once the correction began, this chart is how we knew it was likely to be deep and time-consuming. It's one of the main reasons we haven't been instantly jumping onboard bullish calls at every uptick.
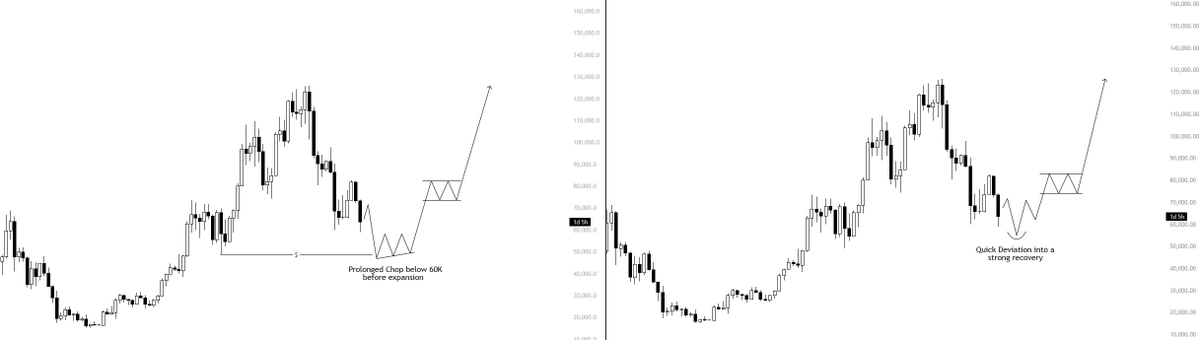
It's either one scenario or the other:
1. A prolonged period of consolidation below $60K before expansion.
2. Quick deviation below $60K followed by expansion.
Both scenarios ultimately lead to the same outcome for $BTC. I don't see any other realistic possibilities playing out besides these two.
Not many people have a public track record like this.
Respectfully, if you want to trade against my HTF $BTC view, be my guest.
I have reciepts of every trade executed publicly.
$BTC Roadmap playing out perfectly 👌
Pumped 32% from our zone and we caught the long from the low 60’s while others were shit scared of the breakout of war 😭
Dumped -15% so far from the top and we caught it from 82k, 5R+ locked 🔒
I gave you everything, even ltf moves, day in, day out. We caught every move on #BTC
Retweet/follow would be appreciated, i always try my best to give you the most possible outcome i can and will continue to do so❤️
The most important strategy for catching the $BTC bottom.
One article. That's all I've ever created, and likely all I ever will.
It explains how I will be using mathematics and historical drawdowns to catch the bottom with leverage and trade alongside the hedge funds.
Study.
Why did Bitcoin rise while Net Liquidity went sideways?
Look at the bottom-right.
• Net Liquidity versus Bitcoin — the legacy macro thesis
• Net Liquidity component decomposition
• Composite regime score: 45 out of 100 (yellow)
• Stablecoin supply versus Bitcoin
When crypto-native dollars expand, Bitcoin follows.
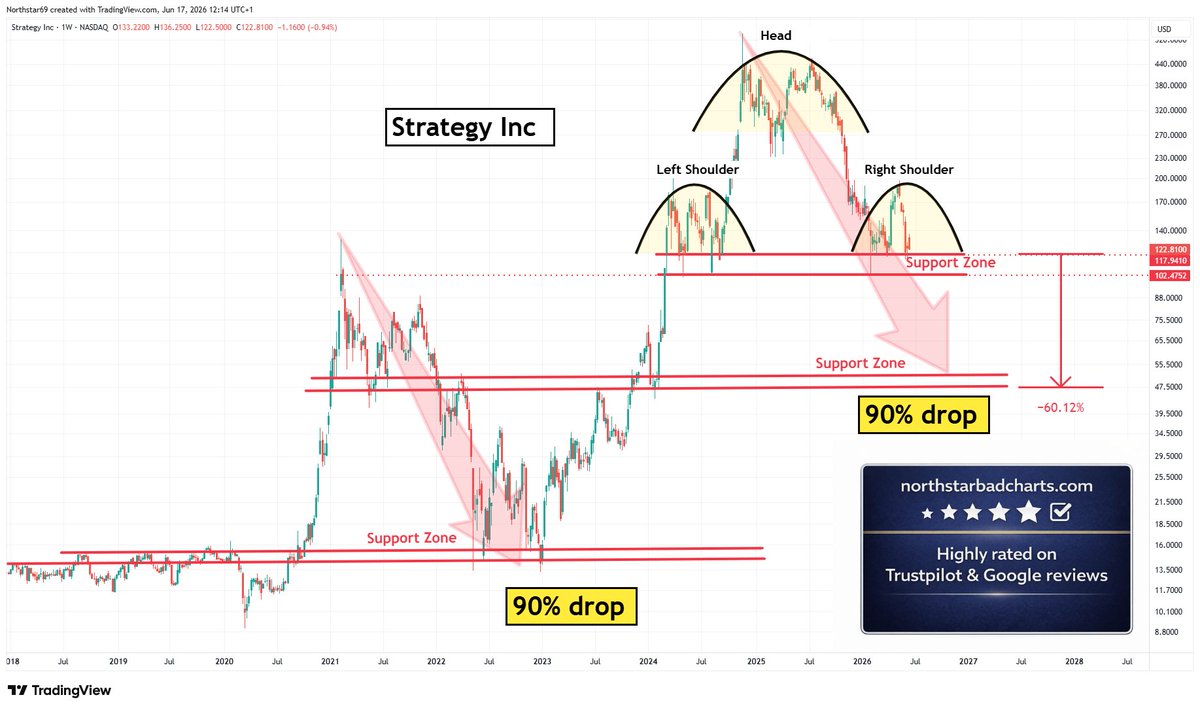
$MSTR's mNAV breakeven to dump MSTR over BTC is ~1.22x.
With only 6 mo of div coverage left (Saylor said he wants this to be over 18mo), Saylor is very likely to sell BTC over MSTR for cash pretty soon (if he hasn't already).
Given BTC is down ~10%, this may be priced in
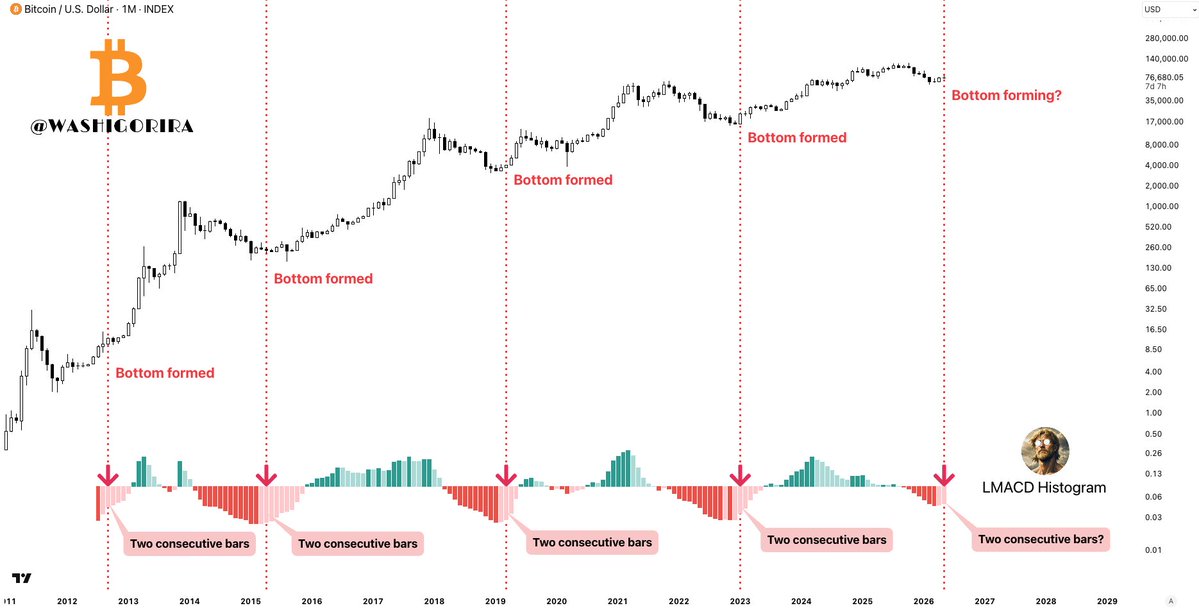
#Bitcoin Pattern worth watching 👀
Historically, #BTC’s bottom formed after 2 consecutive lighter red bars on the monthly logarithmic MACD histogram.
May hasn’t closed yet.
If history rhymes, the worst of the downside may already be behind us.