bitcoin:native
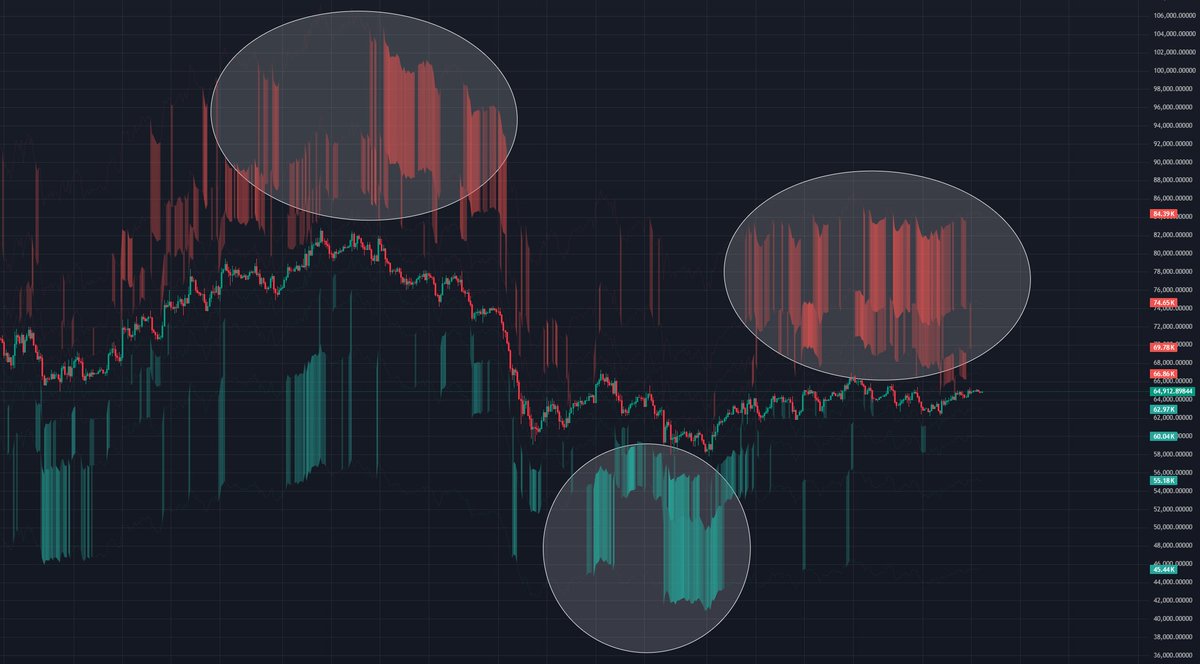
One of my primary concerns right now is the asks imbalance, specifically the liquidity imbalance on the upside. These sell walls are extremely thick, and such barriers, whether buy or sell walls, can significantly dictate future price action.
The last time we encountered sell walls of this magnitude was when the price was in the 78k to 82k range. The market failed to absorb the supply, moving sideways for roughly a month before triggering a price pivot. That ultimately led to a massive long squeeze and a severe market downturn.
Current conditions are starting to look quite similar. The sell walls are thickening, and the price has been consolidating in its current range for about a month. If this liquidity is not absorbed, it could act as another pivot trigger. Given that long leverage positions are currently overheated, a repeat of the long squeeze scenario is a distinct possibility.
Is there a risk of spoofing? Yes, if these walls suddenly vanish, that would be a clear indicator. However, that doesn't mean we should let our guard down; remaining vigilant is highly advised.
#Bitcoin #BTC #CryptoMarket
A critical final resistance test for Gold ($XAU).
Previously, $XAU staged a strong breakout above its downtrend resistance. The final obstacle lies in the current area, which serves as a major confluence of resistance levels.
If Gold manages to clear this zone, it remains well-positioned to extend its upward momentum. However, a failure to hold could lead to a retest of the 4,000–4,100 region.
#Gold #XAUUSD #Commodities
As outlined in my analysis, bitcoin:native has reached the 65.3k mark, entering the red zone. The 65.3k–65.7k range acts as a strong resistance area and is expected to hold. Should this level be breached, the likelihood of BTC advancing toward 67k will significantly increase.
My expectation is a price rejection from this red zone, followed by a retest of the trendline. If the trendline fails to provide support, the current upward movement will be confirmed as a false breakout, and the downward trajectory will resume.
#Bitcoin #BTC #Crypto
The weekly $BTC ETF net flow has turned strongly positive since May, now reaching $853.54M. Whether this represents genuine accumulation or a false signal remains to be seen.
#Bitcoin#BTC#Crypto#ETFs
$ETH reclaimed the yellow circle zone and held it three more times, and now price is back testing the grey area yet again.
The $1,900 to $2,000 band is still the big wall, exactly as I mapped in previous posts. Nothing has changed there. But this time there's an added layer: a rising trendline resistance now converging into that same zone. Two obstacles stacking in one spot.
So we watch. Either ETH gets rejected here again, or it pushes back up to retest $1,950 and pressures the wall once more.
And about the $3,200 forecast for this year, the probability of that is low right now. Before ETH even breaks $1,900 to $2,000, that target stays on the shelf. First things first. Reclaim the wall, then we talk about higher. Until then, this zone runs the show. #Ethereum #Crypto
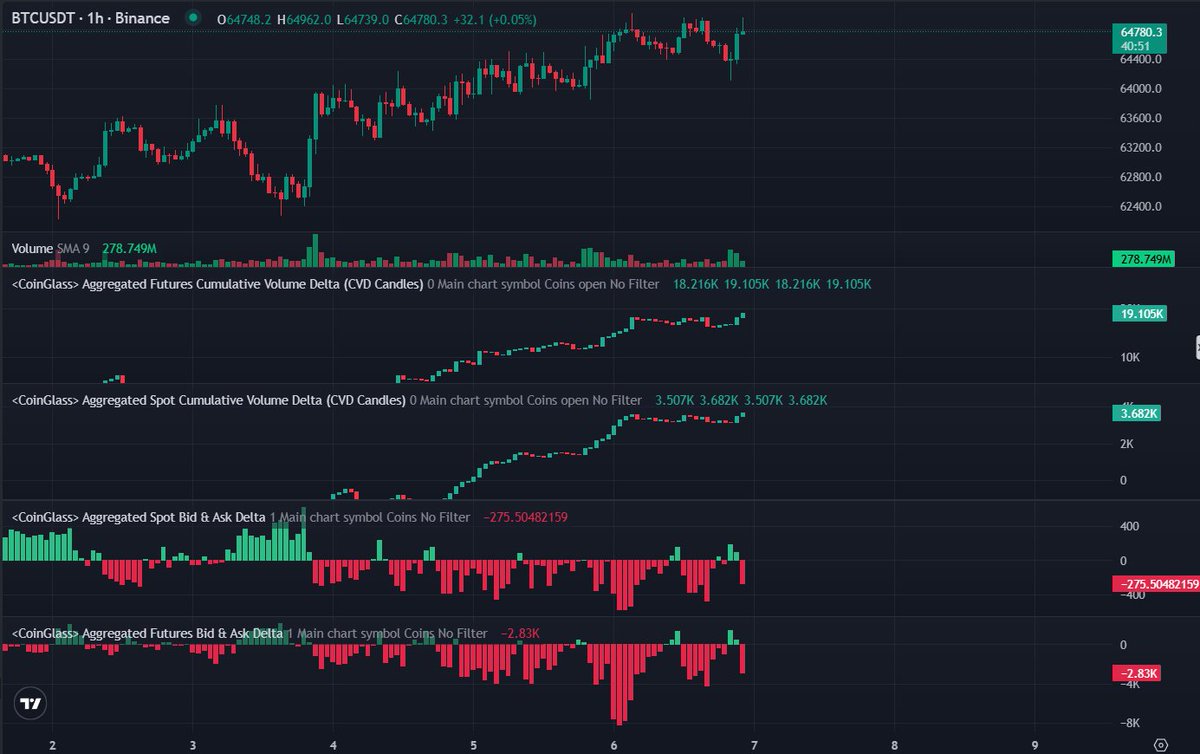
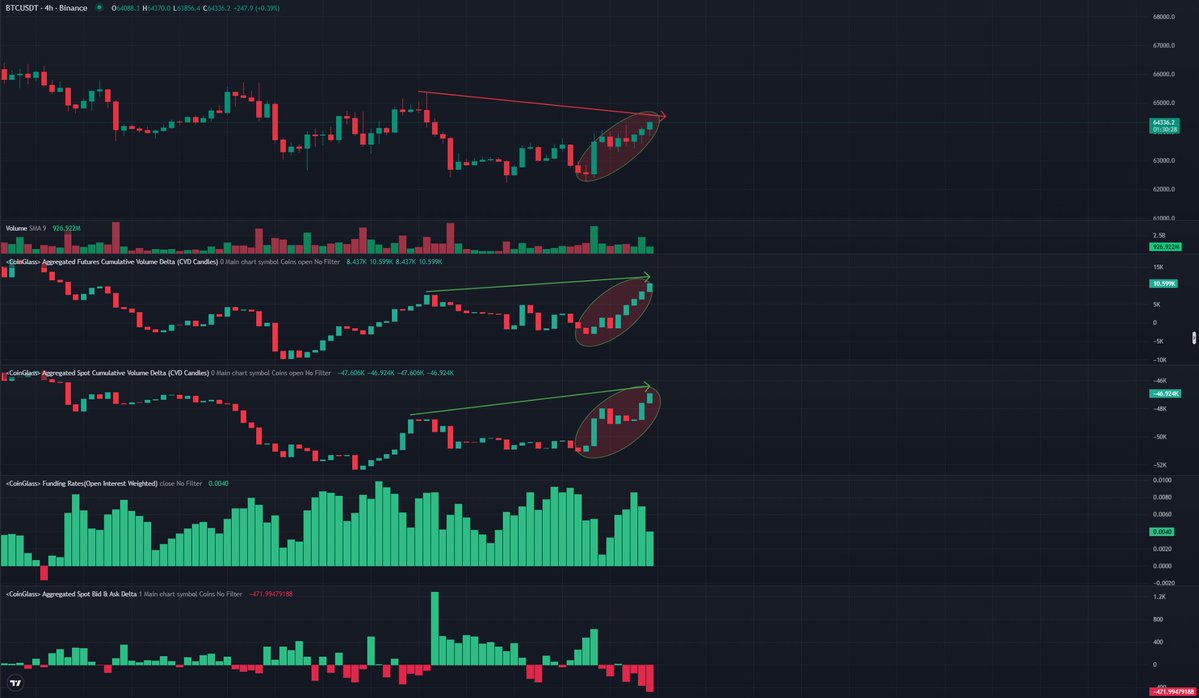
There's a fierce battle playing out between bulls and bears on $BTC right now, and it's genuinely interesting. There's been a strong shift in positioning over the last few days.
Here's the tension. Aggregated CVD, both spot and futures, keeps climbing. Buyers are stepping in consistently. But at the same time, bid & ask delta has turned sharply negative on both spot and futures. Those are the sell walls, and they're the only thing capping this move.
So it comes down to one question: can the bulls absorb all that resting sell-side liquidity, or do the bears simply run out of coins to offload? One side breaks.
Here's the part worth sitting with. Without those red walls, BTC would already be on its way to $67K. The demand is there. The walls are the only thing in the way. Watch whether they get eaten or whether they hold.
#Bitcoin #Crypto
Will history repeat? The same pattern has printed on $XAU in 2018 and 2022, and now the question is whether 2026 rhymes with them.
Each time, gold ground down into its weekly EMA and the descending trendline, tested it, and that test marked the turn. Right now XAU is doing exactly that again, pressing into its weekly EMA as the final resistance of this leg.
Here's the line that matters. If XAU breaks through and reclaims that level, it signals the bearish phase is done and #Gold is ready to rally again, just like the two prior cycles. Until that break happens, we're still in the bearish zone. No reclaim, no trend shift. Watch the weekly close.
#Gold #XAUUSD
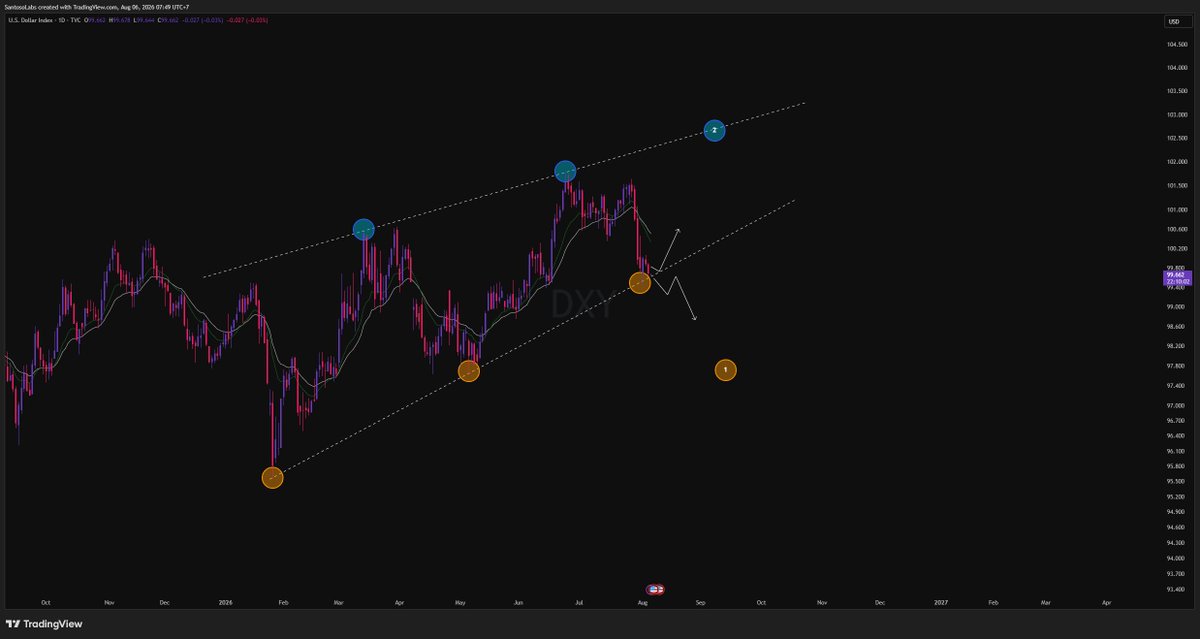
The dollar index $DXY is forming a rising wedge, and that's a bearish pattern. This one matters for every risk asset on the board.
Here's the read. If DXY breaks down out of the wedge, that's a green light for risk-on. Target on the breakdown is 97.7, and a weaker dollar tends to lift $BTC and equities with it.
The other side: if the wedge holds and DXY chooses to print one more wave up, that's the outcome risk assets don't want. Target on that path is 102.7, and a stronger dollar drains liquidity from crypto.
So watch DXY closely. It's one of the cleanest macro tells for where BTC heads next. Dollar down, we breathe. Dollar up, we bleed.
#Bitcoin #DXY
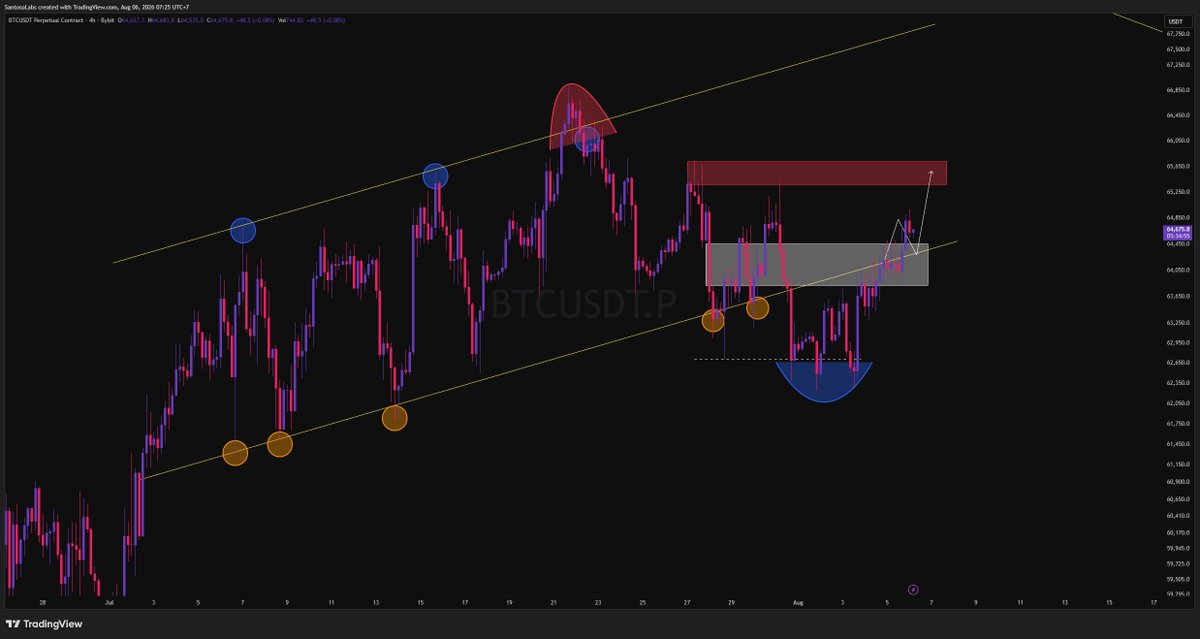
And yes, $BTC broke its resistance and reclaimed the bullish channel, playing out as scenario 2.
I'll be honest about the read though. When I first mapped this, scenario 1 was actually the stronger setup on the data. But analysis is never one factor in isolation, and one thing tipped it: the $SPX rally. Some of that liquidity spilled over into crypto and helped carry BTC through. That's exactly why no prediction is ever 100% right, especially on the LTF. We don't predict certainties, we play probabilities.
For now, the odds favor BTC tagging the $65.3K to $65.7K area. Invalidation is clean: if BTC drops back out of this ranging trendline, the setup is off. Watch that line and let price confirm. #Bitcoin #Crypto
Even gold is catching a bid from this $SPX rally. $XAU is now testing its long bearish trendline resistance, the same line that has capped price since the top.
Here's what makes this week important. If XAU can close above that resistance and hold it, that's one of the first real signals it's breaking out of its bearish zone. A weekly close is the confirmation that matters, not an intraweek wick.
Zoom into the LTF and the $4,200 area becomes the immediate test. But temper the excitement, the LTF oscillators are already overbought and running tired. So the question is whether XAU gets rejected here or pushes through again. Let the weekly close answer it before calling a trend shift.
#Gold #XAUUSD
US stocks are going wild, $SPX printing fresh all-time highs. And $BTC and alts? Sadly, this just isn't crypto's year.
The divergence says it all. When $SPX rips, crypto goes sideways. When SPX drops, crypto gets destroyed. Heads they win, tails we lose. That's the relationship right now.
This cycle feels like a prison, and everyone's silently agreed to the terms: three years bullish, one year bearish for crypto. And this cycle is no different from the ones before it. Same rhythm, same pain, same timing.
But here's the flip side. The bear is exactly when the best accumulation happens. The blueprint is simple, it always has been. The only real question is how you choose to play it. Patience now, or regret later.
#Bitcoin #Crypto #SPX
Worth keeping an eye on the USDJPY correlation with $BTC right now. Historically, when USDJPY corrects sharply, BTC tends to follow with a correction of its own not long after.
The chart shows it clearly. Each time USDJPY dropped from those marked zones, BTC printed a meaningful decline shortly behind it. This ties back to the yen carry trade, when USDJPY unwinds, risk assets like BTC feel the deleveraging.
USDJPY is turning down again now. So the question is simple: does the pattern repeat, or does BTC break correlation this time? Given where we are in the cycle, this is not a signal I'd ignore. Watch how BTC reacts in the days following this USDJPY move.
#Bitcoin #Crypto #USDJPY
$BTC finally broke the ascending trendline support built since early July. That break confirms the pattern as a bear flag, exactly the scenario I flagged.
Price rejected cleanly at the red zone I mapped, then slammed down hard. That was short positioning being loaded while baiting late longs into the move first.
Here's the near term read. If BTC can reclaim above $62.7K, there's potential for a retest of that broken trendline, now flipped to resistance, while the oversold LTF oscillators reset. If it can't reclaim, the downside stays live.
My expectation leans toward a reclaim first, mostly because we're heading into the weekend where volume thins out. But the bigger picture: the odds of seeing $60K to $61K are high right now. Lose that region and the lower area won't hold either.
Invalidation is clean. If price climbs back into the trendline it just broke, the bearish setup is off. Watch that line.
We're about to enter a new month, and a more brutal one, right alongside the judgment window. Welcome, and good luck out there.
#Bitcoin #Crypto
Congrats to everyone who followed along. What I mapped on $ETH played out. The first yellow zone got hit exactly as planned.
Now we watch this test. If it fails to hold, the second yellow zone becomes the next target. And if that one breaks too, $1,500 to $1,600 becomes unavoidable.
The structure has been clear this whole time. Every level I marked is doing its job in sequence.
Good luck out there, everyone.
#Ethereum #Crypto
The map on $BTC played out again. Just like the scenario I laid out, BTC went for a retest of the resistance it had broken, after successfully holding the $62.7K area.
Now the daily sits at a crucial spot. Bulls need to hold and break through this strong resistance at $64K. If they fail, we head back down to retry $62K, and the area below.
Honestly, the CT reaction lately is a bit funny to me. When price was ranging at $62K, half of them wanted to wash their hands of their calls, acting like $50K was still around the corner. Now that $62K holds, suddenly they were right all along and price won't go lower. Tomorrow it flips again. And the day after, it flips again.
What do these people actually stand for? They play it safe to protect their reputation, when the truth is there's far more they don't understand than they'll admit. At the very least, stop misleading the people who read your posts.
Have a conviction. Show your invalidation. Own it when you're wrong. That's the whole job.
#Bitcoin #Crypto
Why hasn't $BTC moved to $60K yet? The answer is: not yet, not never. There's a difference.
Look at the liquidation heatmap. That thick band of liquidity sitting around $60K to $62K is, in pure business terms, extremely attractive. Price doesn't ignore pools like that, it gravitates toward them. The magnet is still there.
So think smarter. A part of CT isn't as honest as they present themselves. When they wave you into buying right before a liquidity zone like this, you're the one being set up as exit liquidity for their exchange partners. That's not a conspiracy, that's the incentive structure.
They're not blind to this data. They just serve you the version of it that fits their interest. Read the map yourself, and stop taking narratives at face value. #Bitcoin #Crypto
Looking at the Hyperliquid liquidation map on $BTC, even across an unfair range from $40K to $100K, the long leverage is clearly the more massive side.
Sit with that for a second. Even with a range this stretched and skewed against the point, longs still dominate the book. Now go pull it up with a fair, symmetric range around current price and see for yourself just how extreme the long versus short imbalance actually gets. It's worse than most people assume.
This is the weight sitting on BTC's back for the long term. All that stacked long leverage is fuel that hasn't been cleared. And until it gets swept, it keeps dragging on any real sustainable move higher. You don't build a clean bottom on a book this lopsided. It has to flush first.
#Bitcoin #Crypto
Aggregated orderbook liquidity on $BTC is leaning more negative right now. This is worth watching, especially because price is sitting right at the resistance I mapped.
Negative orderbook liquidity here suggests sell-side pressure is building into that resistance. Sellers are stacking above. Now, a fair caveat: this is orderbook data, and resting orders can be pulled at any moment. It's not a filled position, it's intent.
But intent at a key level still matters. When the book skews negative right as price tests a zone you already expected to reject, that's confirmation worth respecting, not ignoring. Watch whether this supply holds price down or gets absorbed.
#Bitcoin #Crypto
Once again, the start of the month is getting a strong push from aggregated spot CVD on $BTC. Both futures and spot CVD are turning up together this time, and that's the part that matters.
Holding $64K and breaking the resistance above is now the bulls' job. If they can defend it, this is a genuine positive for the near term, since the move actually has spot behind it, not just leverage.
Worth noting the macro tie-in too. $SPX ripping to fresh highs is one of the triggers feeding this BTC bid. Risk-on flows spill over. The question is whether this holds or turns out to be pure FOMO once the momentum fades. Watch if spot keeps confirming or quietly rolls back over.
#Bitcoin #Crypto
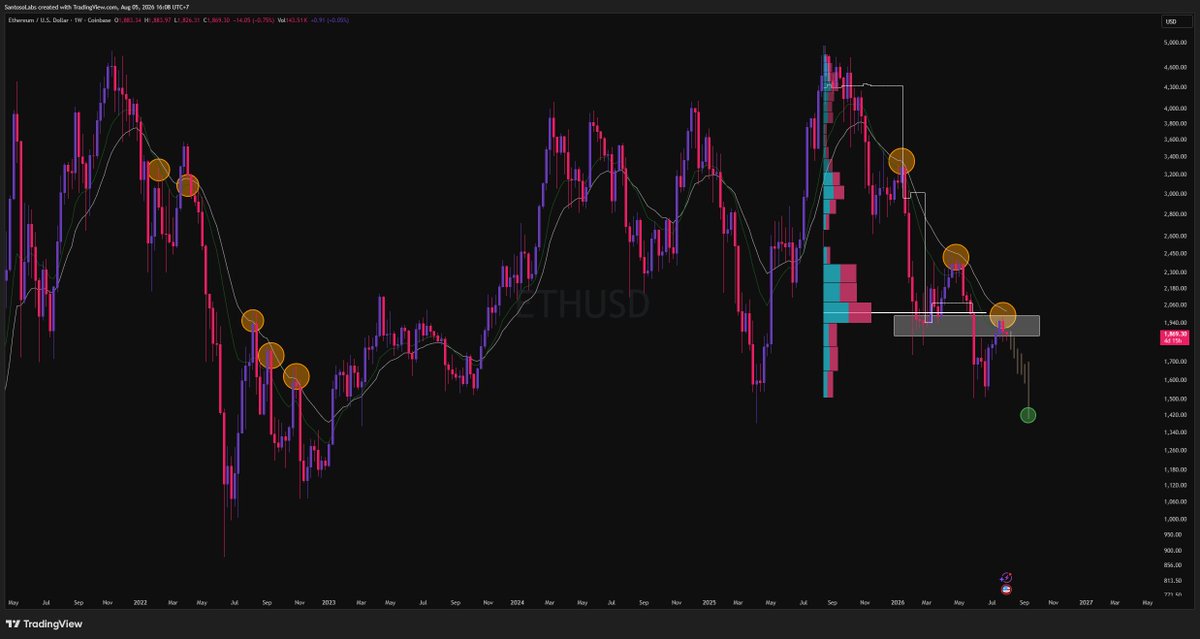
On the HTF, $ETH is still clearly inside a bearish zone. And the $1,900 to $2,000 area is where the real resistance sits.
This isn't one wall, it's a stack. The 13 and 21 EMAs, the POC, and the structural resistance all converge in that $1,900 to $2,000 band. When that many factors line up in one spot, reclaiming it isn't a small ask, it's the whole battle.
If ETH fails to take that zone back, the downtrend continues with a target of $1,400 to $1,500. Until price reclaims $2,000 and holds, the path of least resistance stays down. Watch that band closely, it decides the next leg.
#Ethereum #Crypto #ETH