Why #Rollbit is King and Why You Should be Paying Attention:
Building a Sustainable Ecosystem:
A sustainable ecosystem in the crypto space is not just about tokenomics or technology but a combination of community, transparency, innovation, and adaptability.
Rollbit seems to understand this blend. Their consistent efforts to innovate, while staying grounded, have shaped an ecosystem that's resilient and adaptable to Crypto market dynamics.
Key Elements of a Sustainable Ecosystem:
1) Community Engagement: A platform is as strong as its community. Rollbit has fostered a community that actively engages, contributes ideas, and remains loyal.
- Most rewarding crypto casino, Rollbit lives up to the title
2) Innovative Tokenomics: The $RLB token isn't just a currency; it's a token of trust, value, and participation in the platform's future.
- For the sake of brevity, I will not list all the reasons, but I believe a core reason was the means of distribution for RLB token (RLB acquired on reveal of V2 Sportsbots). Will touch more on this later
- Yes, Rollbit is a large holder of RLB, but they have acquired RLB as market participants, just like everyone else.
o Which implies, Rollbit isn't a success unless the market decides they are a success. This shouldn't be understated.
3) Adaptability: In an ever-evolving space, the ability to pivot and adapt is crucial. Rollbit has shown time and time again its readiness to evolve based on both market trends and community feedback.
- Again, many reasons to back this up, but migrating RLB token from Solana to Ethereum comes to mind.
4) Transparency: In a bold move towards transparency, Rollbit decided to move their "buy/burn" transactions entirely on-chain. This not only allows every transaction to be verifiable by anyone, but also establishes a trustless system where users don't have to rely on the platform's word. They can see the proof themselves. Such a step could have deep implications, possibly reducing operating expenses while increasing trust.
- Price action after this was announced implies that it was well received by the community. Probably brought in new users as well.
Proving Integrity Through Actions:
How a platform deals with its challenges speaks volumes about its integrity.
1) Distribution of $RLB Token: By ensuring a fair and widespread distribution, Rollbit has ensured decentralized empowerment, reducing the chances of monopolistic powers dictating terms.
- Large holders have come and gone, still growth continues (would argue this is a constant challenge of sustaining a market)
2) The Dutch Auction Debacle: Not every decision has been perfect. The Dutch auction had its flaws, but what's commendable is Rollbit's responsiveness to community concerns. Accepting mistakes and rectifying them showcases their commitment and the principles they hold themselves to.
- Metrics are great and all, but "doing the right thing" (especially in this space) should not be understated.
- Rollbit could have easily said "too bad, so sad," but they didn't. They chose to own their mistake and rectify the situation, for the community.
Consistently Building:
1) It doesn't seem to be just about creating a product for Rollbit, it seems to be about enhancing and innovating continually.
- If we were to take a snapshot of Rollbit as it is currently, the product is already pretty sound. Yet still more features to come (Dual Arena, Sportsbook, Several more traits to add utility to, & V2s to be tied fully into ecosystem)
2) Rollbit has been unwavering in its commitment to add layers of value to its platform, ensuring users always have something new to look forward to.
- To me, this implies passion and pride in what Rollbit is building.
- Doesn't seem to be just about money, if it were, then why rollout more features?
- You can tell @Razer_Rollbit & @Lucky_Rollbit are putting their own personal touches on the brand. Giving a "breath of fresh air" to the online casino landscape.🤝
Industry Past into Industry Future:
The online gambling industry, in many ways, has remained stagnant for decades, like stale bread. It's an industry that's often been termed "predatory" due to its rewards systems.
- Think about it: enticing deposit bonuses dangled in front of players, only for them to realize they need to wager thousands just to unlock those "rewards." Such tactics leave a bitter taste in my mouth and I am sure others feel the same.
The online gambling landscape is so ripe for innovation it's almost comical. An industry this vast and influential, and yet, so little progression. But here's the twist - gambling, when paired with the right innovation, might just be the key to achieving true sustainability in the crypto space.
- It is reassuring that Rollbit is at the forefront of this venture
As I reflect on "GamingFi's" potential future, I can't help but envision a merger of the best elements from both the gaming/gambling and finance sectors. With the innovations that Rollbit has introduced (and continues to introduce), we're seeing the early stages of this.
- Imagine the possibilities when in-game achievements translate directly to financial rewards, or when player progression in a game impacts their financial standing in the ecosystem. (talking about the highly anticipated Rollbit Dual Arena, but also what these "play-to-earn" Web3 game ecosystems should probably look like)
- Other projects should be paying attention if they are not already
It's not just about slot machines or table games anymore. We're looking at a future where the boundary between gaming/gambling and finance is so blurred; they're almost indistinguishable. Rollbit seems to be leading the charge in this direction, and if they play their cards right, they could redefine the entire landscape. And TBH, probably other industries, these industry "lines in the sand" seem to be blurring more and more each year.
For those unfamiliar with Rollbit, I urge you to dive in and explore. The community, in spite of the typical gambling and crypto casino stigmas, is incredibly supportive.
I've been trying to make "Bot Boys" a popular label for the community (apologies ladies), but you have to admit, it's catchy and has a nice ring to it. So, if you haven’t already, come join the Bot Boys (and Girls) and witness the revolution firsthand. #RollbitRising
In the meantime, welcome to the future 🌐🤖🤝
Bullish for non-US based companies.
"All policies, directives, and guidance issued pursuant to Executive Order 14067 and the Department of the Treasury’s Framework for International Engagement on Digital Assets are hereby rescinded or shall be rescinded by the Secretary of the Treasury, as appropriate, to the extent they are inconsistent with the provisions of this order."
@rollbit get Bengston on the phone
November Buy/Burn Metrics
Comparing October to November, Lets explore the numbers 👇
October Recap:
Casino Revenue: $21,696,905
Futures Revenue: $4,052,060
Sports Revenue: $2,016,030
Total Revenue: $27,764,995
Total Buyback: $3,913,704
RLB Bought: 52,849,813
RLB Burned: 47,564,832
Distributed to V1 Stakers: 5,284,981
AVG RLB Price of Buyback: $0.0749
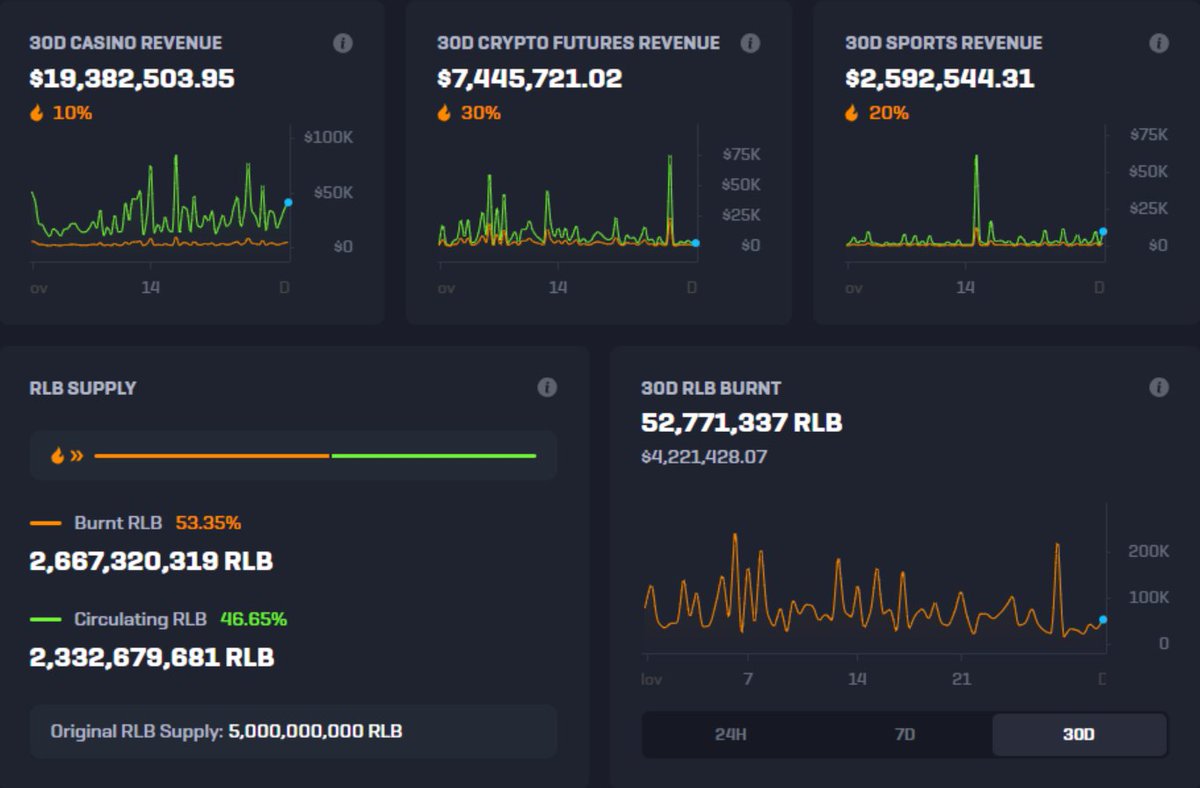
November Data:
Casino Revenue: $19,382,504
Futures Revenue: $7,445,721
Sports Revenue: $2,592,544
Total Revenue: $29,420,769 (+5.96% from Oct.)
Total Buyback: $4,690,476 (+19.84%)
RLB Bought: 58,634,819
RLB Burned: 52,771,337
Distributed to V1 Stakers: 5,863,482
AVG RLB Price of Buyback: $0.0834
Growth Metrics:
Total Revenue: ⬆️ +5.96%
Casino Revenue: ⬇️ -10.68%
Futures Revenue: ⬆️ +83.69%
Sports Revenue: ⬆️ +28.63%
Total Buyback: ⬆️ +19.84%
RLB Bought: ⬆️ +10.93%
RLB Burned: ⬆️ +10.96%
Distributed to V1 Stakers: ⬆️ +10.93%
AVG RLB Price of Buyback: ⬆️ +11.35%
Averages Data:
Average Hourly Buyback (USD): ⬆️ +23.65%
Average Hourly Buyback (RLB): ⬆️ +14.47%
Average Hourly Burn (RLB): ⬆️ +14.48%
Average Hourly Distributed (RLB): ⬆️ +14.48%
RLB Supply Metrics:
October:
- RLB Burnt: 2,613,479,691 RLB (52.27%)
- Circ. Supply: 2,386,520,309 RLB (47.73%)
November:
- RLB Burnt: 2,677,320,319 RLB (53.35%) ⬆️ +1.08%
- Circ. Supply: 2,332,679,681 RLB (46.65%) ⬇️ -1.08%
Min/Max Data:
Min Buyback: ⬇️ from $1,311 to $1,265
Max Buyback: ⬇️ from $56,395 to $49,626
Important to Note:
- Rollbit usually has a Christmas Event, can assume an increase in casino revenue for December. IYKYK
Implied Trajectory:
November's performance showcases a rebound in futures and sports betting sectors, which compensates for the slight dip in casino revenue.
Overall increase in total revenue, coupled with a rise in buyback activities, reflects a positive market response.
I would argue that growth in the futures sector is a good enough indicator for "more to come." Downtrend has been broken & tested. Christmas event incoming. Bull market. Upside implied.
But, time will tell.
In the meantime, welcome to the future.
October Buy/Burn Metrics
Comparing September to October. Let's explore the numbers 👇
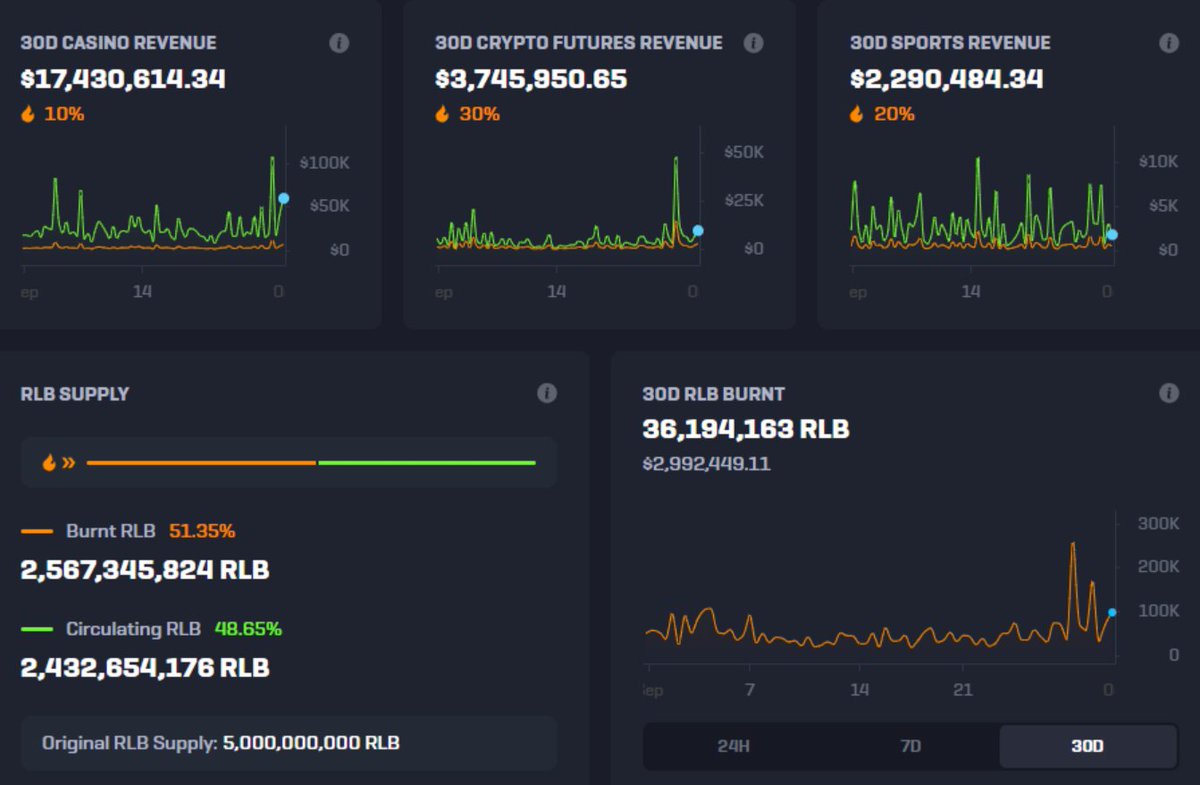
September Recap:
Casino Revenue: $17,430,614
Futures Revenue: $3,745,950
Sports Revenue: $2,290,484
Total Revenue: $23,467,048
Total Buyback: $3,324,943
RLB Bought: 40,215,736
RLB Burned: 36,194,162
Distributed to V1 Stakers: 4,021,573
AVG RLB Price of Buyback: $0.0849
October Data:
Casino Revenue: $21,696,905
Futures Revenue: $4,052,060
Sports Revenue: $2,016,030
Total Revenue: $27,764,995
Total Buyback: $3,913,704
RLB Bought: 52,849,813
RLB Burned: 47,564,832
Distributed to V1 Stakers: 5,284,981
AVG RLB Price of Buyback: $0.0749
Growth Metrics:
Total Revenue: ⬆️ +18.33%
Casino Revenue: ⬆️ +24.46%
Futures Revenue: ⬆️ +8.18%
Sports Revenue: ⬇️ -11.97%
Total Buyback: ⬆️ +17.73%
RLB Bought: ⬆️ +31.48%
RLB Burned: ⬆️ +31.40%
Distributed to V1 Stakers: ⬆️ +31.42%
AVG RLB Price of Buyback: ⬇️ -11.84%
Averages Data:
Average Hourly Buyback (USD): ⬆️ +14.08%
Average Hourly Buyback (RLB): ⬆️ +27.37%
Average Hourly Burn (RLB): ⬆️ +27.33%
Average Hourly Distributed (RLB): ⬆️ +27.35%
RLB Supply Metrics:
September:
- RLB Burnt: 2,567,433,380 RLB (51.35%)
- Circ. Supply: 2,432,566,620 RLB (48.65%)
October:
- RLB Burnt: 2,613,479,691 RLB (52.27%) ⬆️-0.92%
- Circ. Supply: 2,386,520,309 RLB (47.73%) ⬆️+0.92%
Min/Max Data:
Min Buyback: ⬇️ from $1,342 to $1,311
Max Buyback: ⬆️ from $21,649 to $56,395
Important to Note:
- A strong rebound in casino revenue drove overall growth this month, counteracting the decline in sports revenue.
- First increase in revenue since Nov. 23'
Implied Trajectory:
October's data paints a picture of recovery and resilience, particularly within the casino sector. Which maybe could signify a stabilizing/growing user engagement in key areas of the Rollbit ecosystem. The decline in sports revenue somewhat concerning, but probably reflecting seasonal fluctuations.
Moving forward, maintaining this momentum will be crucial, especially in leveraging the positive trends in casino and futures revenues to offset any seasonality in sports betting. This balanced approach will be essential for sustaining growth and stabilizing the RLB market value. Has RLB seen its bottom already?
Time will tell.
In the meantime, welcome to the future.
October Buy/Burn Metrics
Comparing September to October. Let's explore the numbers 👇
September Recap:
Casino Revenue: $17,430,614
Futures Revenue: $3,745,950
Sports Revenue: $2,290,484
Total Revenue: $23,467,048
Total Buyback: $3,324,943
RLB Bought: 40,215,736
RLB Burned: 36,194,162
Distributed to V1 Stakers: 4,021,573
AVG RLB Price of Buyback: $0.0849
October Data:
Casino Revenue: $21,696,905
Futures Revenue: $4,052,060
Sports Revenue: $2,016,030
Total Revenue: $27,764,995
Total Buyback: $3,913,704
RLB Bought: 52,849,813
RLB Burned: 47,564,832
Distributed to V1 Stakers: 5,284,981
AVG RLB Price of Buyback: $0.0749
Growth Metrics:
Total Revenue: ⬆️ +18.33%
Casino Revenue: ⬆️ +24.46%
Futures Revenue: ⬆️ +8.18%
Sports Revenue: ⬇️ -11.97%
Total Buyback: ⬆️ +17.73%
RLB Bought: ⬆️ +31.48%
RLB Burned: ⬆️ +31.40%
Distributed to V1 Stakers: ⬆️ +31.42%
AVG RLB Price of Buyback: ⬇️ -11.84%
Averages Data:
Average Hourly Buyback (USD): ⬆️ +14.08%
Average Hourly Buyback (RLB): ⬆️ +27.37%
Average Hourly Burn (RLB): ⬆️ +27.33%
Average Hourly Distributed (RLB): ⬆️ +27.35%
RLB Supply Metrics:
September:
- RLB Burnt: 2,567,433,380 RLB (51.35%)
- Circ. Supply: 2,432,566,620 RLB (48.65%)
October:
- RLB Burnt: 2,613,479,691 RLB (52.27%) ⬆️-0.92%
- Circ. Supply: 2,386,520,309 RLB (47.73%) ⬆️+0.92%
Min/Max Data:
Min Buyback: ⬇️ from $1,342 to $1,311
Max Buyback: ⬆️ from $21,649 to $56,395
Important to Note:
- A strong rebound in casino revenue drove overall growth this month, counteracting the decline in sports revenue.
- First increase in revenue since Nov. 23'
Implied Trajectory:
October's data paints a picture of recovery and resilience, particularly within the casino sector. Which maybe could signify a stabilizing/growing user engagement in key areas of the Rollbit ecosystem. The decline in sports revenue somewhat concerning, but probably reflecting seasonal fluctuations.
Moving forward, maintaining this momentum will be crucial, especially in leveraging the positive trends in casino and futures revenues to offset any seasonality in sports betting. This balanced approach will be essential for sustaining growth and stabilizing the RLB market value. Has RLB seen its bottom already?
Time will tell.
In the meantime, welcome to the future.
September Buy/Burn Metrics Comparing August to September. Let's explore the numbers 👇
August Recap:
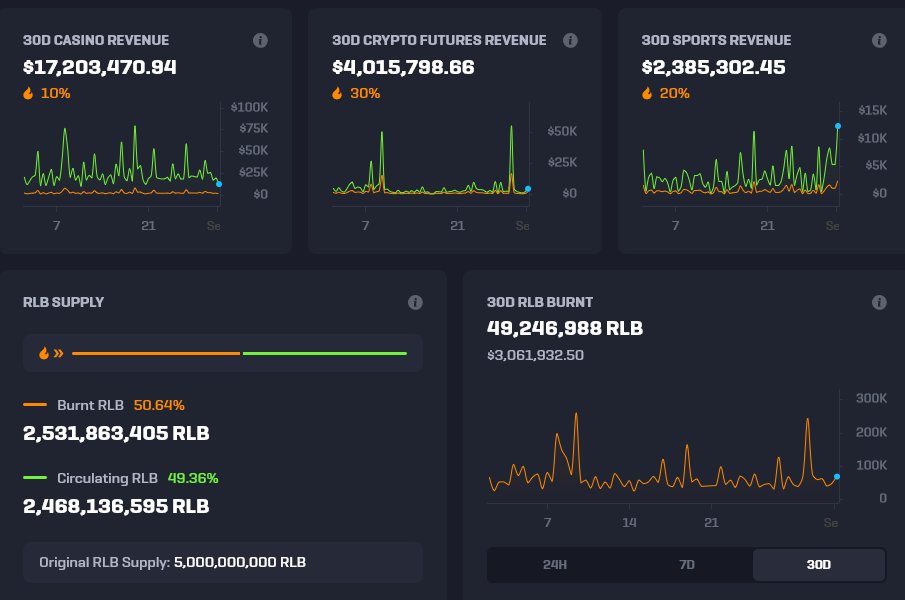
Casino Revenue: $17,203,470
Futures Revenue: $4,015,798
Sports Revenue: $2,385,302
Total Revenue: $23,604,570
Total Buyback: $3,636,428.45
RLB Bought: 57,880,836.94
RLB Burned: 52,092,753.33
Distributed to V1 Stakers: 5,788,083.55
AVG RLB Price of Buyback: $0.0635
September Data:
Casino Revenue: $17,430,614
Futures Revenue: $3,745,950
Sports Revenue: $2,290,484
Total Revenue: $23,467,048
Total Buyback: $3,324,943
RLB Bought: 40,215,736
RLB Burned: 36,194,162
Distributed to V1 Stakers: 4,021,573
AVG RLB Price of Buyback: $0.0849
Growth Metrics:
Total Revenue: ⬇️ -0.58%
Casino Revenue: ⬆️ +1.32%
Futures Revenue: ⬇️ -6.72%
Sports Revenue: ⬇️ -3.97%
Total Buyback: ⬇️ -8.57%
RLB Bought: ⬇️ -30.52%
RLB Burned: ⬇️ -30.52%
Distributed to V1 Stakers: ⬇️ -30.52%
AVG RLB Price of Buyback: ⬆️ +33.70%
Averages Data:
Average Hourly Buyback (USD): ⬇️ -5.65%
Average Hourly Buyback (RLB): ⬇️ -28.29%
Average Hourly Burn (RLB): ⬇️ -28.29%
Average Hourly Distributed (RLB): ⬇️ -28.29%
RLB Supply Metrics:
August:
RLB Burnt: 2,529,902,167 RLB (50.64%) ⬆️ +1.08% Circ. Supply: 2,470,097,833 RLB (49.36%) ⬇️ -1.08%
September:
RLB Burnt: 2,567,433,380 RLB (51.35%) ⬆️ +0.71%
Circ. Supply: 2,432,566,620 RLB (48.65%) ⬇️ -0.71%
Min/Max Data:
Min Buyback: ⬇️ from $1,534.47 to $1,342
Max Buyback: ⬇️ from $69,483.26 to $21,649
Important to Note:
- Despite a slight increase in casino revenue, overall revenue slightly decreased.
- Significant drop in the amount of RLB bought, burned/distributed, reflecting tighter buyback operations amid lesser total revenue.
- Notable increase in average buyback price, indicating higher costs per RLB.
Implied Trajectory:
September's data presents a mixed scenario. While there is a modest increase in casino revenue, the overall downward trend in futures and sportsbook continues. However, the rise in the average buyback price could signal strengthening demand/reduced supply effects. More of the same and continued downtrend in total revenue. RLB price action has seen some volatility to upside this month, expecting movement of overall market to determine if RLB upside will be sustained.
Time will tell.
In the meantime, welcome to the future
September Buy/Burn Metrics Comparing August to September. Let's explore the numbers 👇
August Recap:
Casino Revenue: $17,203,470
Futures Revenue: $4,015,798
Sports Revenue: $2,385,302
Total Revenue: $23,604,570
Total Buyback: $3,636,428.45
RLB Bought: 57,880,836.94
RLB Burned: 52,092,753.33
Distributed to V1 Stakers: 5,788,083.55
AVG RLB Price of Buyback: $0.0635
September Data:
Casino Revenue: $17,430,614
Futures Revenue: $3,745,950
Sports Revenue: $2,290,484
Total Revenue: $23,467,048
Total Buyback: $3,324,943
RLB Bought: 40,215,736
RLB Burned: 36,194,162
Distributed to V1 Stakers: 4,021,573
AVG RLB Price of Buyback: $0.0849
Growth Metrics:
Total Revenue: ⬇️ -0.58%
Casino Revenue: ⬆️ +1.32%
Futures Revenue: ⬇️ -6.72%
Sports Revenue: ⬇️ -3.97%
Total Buyback: ⬇️ -8.57%
RLB Bought: ⬇️ -30.52%
RLB Burned: ⬇️ -30.52%
Distributed to V1 Stakers: ⬇️ -30.52%
AVG RLB Price of Buyback: ⬆️ +33.70%
Averages Data:
Average Hourly Buyback (USD): ⬇️ -5.65%
Average Hourly Buyback (RLB): ⬇️ -28.29%
Average Hourly Burn (RLB): ⬇️ -28.29%
Average Hourly Distributed (RLB): ⬇️ -28.29%
RLB Supply Metrics:
August:
RLB Burnt: 2,529,902,167 RLB (50.64%) ⬆️ +1.08% Circ. Supply: 2,470,097,833 RLB (49.36%) ⬇️ -1.08%
September:
RLB Burnt: 2,567,433,380 RLB (51.35%) ⬆️ +0.71%
Circ. Supply: 2,432,566,620 RLB (48.65%) ⬇️ -0.71%
Min/Max Data:
Min Buyback: ⬇️ from $1,534.47 to $1,342
Max Buyback: ⬇️ from $69,483.26 to $21,649
Important to Note:
- Despite a slight increase in casino revenue, overall revenue slightly decreased.
- Significant drop in the amount of RLB bought, burned/distributed, reflecting tighter buyback operations amid lesser total revenue.
- Notable increase in average buyback price, indicating higher costs per RLB.
Implied Trajectory:
September's data presents a mixed scenario. While there is a modest increase in casino revenue, the overall downward trend in futures and sportsbook continues. However, the rise in the average buyback price could signal strengthening demand/reduced supply effects. More of the same and continued downtrend in total revenue. RLB price action has seen some volatility to upside this month, expecting movement of overall market to determine if RLB upside will be sustained.
Time will tell.
In the meantime, welcome to the future
August Buy/Burn Metrics
Comparing June to July. Let's explore the numbers 👇
July Recap:
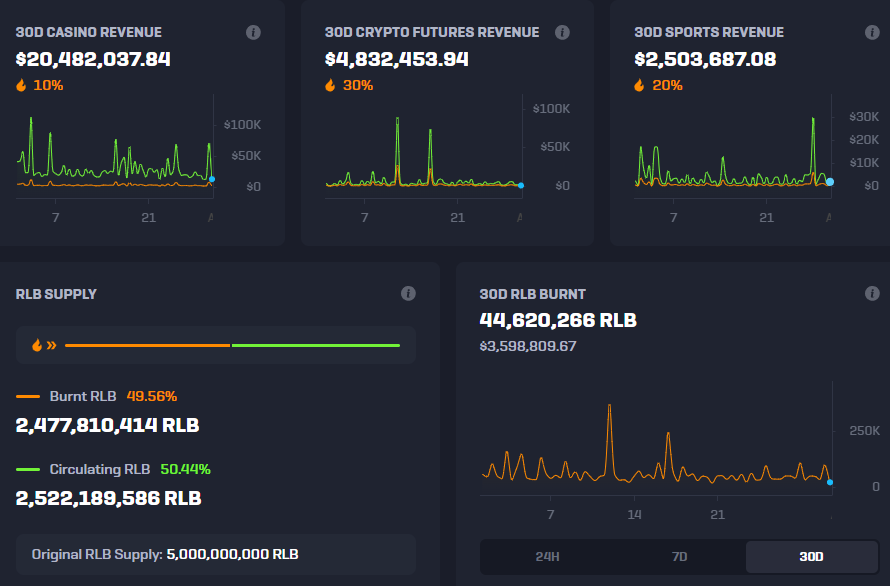
Casino Revenue: $20,482,037
Futures Revenue: $4,832,453
Sports Revenue: $2,503,687
Total Revenue: $27,818,177
Total Buyback: $3,998,677.41
RLB Bought: 49,578,072.83
RLB Burned: 44,620,265.72
Distributed to V1 Stakers: 4,957,807.29
AVG RLB Price of Buyback: $0.0810
August Data:
Casino Revenue: $17,203,470
Futures Revenue: $4,015,798
Sports Revenue: $2,385,302
Total Revenue: $23,604,570
Total Buyback: $3,636,428.45
RLB Bought: 57,880,836.94
RLB Burned: 52,092,753.33
Distributed to V1 Stakers: 5,788,083.55
AVG RLB Price of Buyback: $0.0635
Growth Metrics:
Total Revenue: ⬇️ -15.14%
Casino Revenue: ⬇️ -16.01%
Futures Revenue: ⬇️ -16.89%
Sports Revenue: ⬇️ -4.73%
Total Buyback: ⬇️ -9.06%
RLB Bought: ⬆️ +16.79%
RLB Burned: ⬆️ +16.72%
Distributed to V1 Stakers: ⬆️ +16.75%
AVG RLB Price of Buyback: ⬇️ -21.60%
Averages Data:
Average Hourly Buyback (USD): ⬇️ -12.00%
Average Hourly Buyback (RLB): ⬆️ +12.96%
Average Hourly Burn (RLB): ⬆️ +12.94%
Average Hourly Distributed (RLB): ⬆️ +12.96%
RLB Supply Metrics:
July:
RLB Burnt: 2,477,810,414 RLB (49.56%)⬆️ +.89%
Circ. Supply: 2,522,189,586 RLB (50.44%)⬇️ -.89%
August:
RLB Burnt: 2,529,902,167 RLB (50.64%) ⬆️ +1.08%
Circ. Supply: 2,470,097,833 RLB (49.36%) ⬇️ -1.08%
Min/Max Data:
Min Buyback: ⬆️ from $1,489.92 to $1,534.47
Max Buyback: ⬆️ from $54,528.30 to $69,483.26
Important to Note:
- Decrease across all revenue streams, notably in Casino and Futures.
- Despite lower buyback funds, the increase in the amount of RLB bought, burned, and distributed highlighting commitment to RLB's deflationary strategy. (50%+ supply has been burned)
- Expanded Faze partnership - https://t.co/Cc5gD075of
- @Razer_Rollbit addresses community concerns - https://t.co/aBuTKcAerA
Implied Trajectory:
August reveals a challenging market with reduced revenue, but shows a promising increase in RLB activities. Buyback activities could be crucial in maintaining investor confidence during market downturns. As RLB navigates through these fluctuations, the focus will likely remain on reinforcing the utility of RLB and broadening its adoption, potentially stabilizing and growing its market value.
Time will tell.
In the meantime, welcome to the future.
August Buy/Burn Metrics
Comparing June to July. Let's explore the numbers 👇
July Recap:
Casino Revenue: $20,482,037
Futures Revenue: $4,832,453
Sports Revenue: $2,503,687
Total Revenue: $27,818,177
Total Buyback: $3,998,677.41
RLB Bought: 49,578,072.83
RLB Burned: 44,620,265.72
Distributed to V1 Stakers: 4,957,807.29
AVG RLB Price of Buyback: $0.0810
August Data:
Casino Revenue: $17,203,470
Futures Revenue: $4,015,798
Sports Revenue: $2,385,302
Total Revenue: $23,604,570
Total Buyback: $3,636,428.45
RLB Bought: 57,880,836.94
RLB Burned: 52,092,753.33
Distributed to V1 Stakers: 5,788,083.55
AVG RLB Price of Buyback: $0.0635
Growth Metrics:
Total Revenue: ⬇️ -15.14%
Casino Revenue: ⬇️ -16.01%
Futures Revenue: ⬇️ -16.89%
Sports Revenue: ⬇️ -4.73%
Total Buyback: ⬇️ -9.06%
RLB Bought: ⬆️ +16.79%
RLB Burned: ⬆️ +16.72%
Distributed to V1 Stakers: ⬆️ +16.75%
AVG RLB Price of Buyback: ⬇️ -21.60%
Averages Data:
Average Hourly Buyback (USD): ⬇️ -12.00%
Average Hourly Buyback (RLB): ⬆️ +12.96%
Average Hourly Burn (RLB): ⬆️ +12.94%
Average Hourly Distributed (RLB): ⬆️ +12.96%
RLB Supply Metrics:
July:
RLB Burnt: 2,477,810,414 RLB (49.56%)⬆️ +.89%
Circ. Supply: 2,522,189,586 RLB (50.44%)⬇️ -.89%
August:
RLB Burnt: 2,529,902,167 RLB (50.64%) ⬆️ +1.08%
Circ. Supply: 2,470,097,833 RLB (49.36%) ⬇️ -1.08%
Min/Max Data:
Min Buyback: ⬆️ from $1,489.92 to $1,534.47
Max Buyback: ⬆️ from $54,528.30 to $69,483.26
Important to Note:
- Decrease across all revenue streams, notably in Casino and Futures.
- Despite lower buyback funds, the increase in the amount of RLB bought, burned, and distributed highlighting commitment to RLB's deflationary strategy. (50%+ supply has been burned)
- Expanded Faze partnership - https://t.co/Cc5gD075of
- @Razer_Rollbit addresses community concerns - https://t.co/aBuTKcAerA
Implied Trajectory:
August reveals a challenging market with reduced revenue, but shows a promising increase in RLB activities. Buyback activities could be crucial in maintaining investor confidence during market downturns. As RLB navigates through these fluctuations, the focus will likely remain on reinforcing the utility of RLB and broadening its adoption, potentially stabilizing and growing its market value.
Time will tell.
In the meantime, welcome to the future.
July Buy/Burn Metrics
Comparing June to July. Let's explore the numbers 👇
June Recap:
Casino Revenue: $19,938,472
Futures Revenue: $4,794,833
Sports Revenue: $2,695,288
Total Revenue: $27,428,593
Total Buyback: $3,917,596.65
RLB Bought: 57,147,218.04
RLB Burned: 51,432,496.34
Distributed to V1 Stakers: 5,714,721.77
AVG RLB Price of Buyback: $0.0689
July Data:
Casino Revenue: $20,482,037
Futures Revenue: $4,832,453
Sports Revenue: $2,503,687
Total Revenue: $27,818,177
Total Buyback: $3,998,677.41
RLB Bought: 49,578,072.83
RLB Burned: 44,620,265.72
Distributed to V1 Stakers: 4,957,807.29
AVG RLB Price of Buyback: $0.0810
Growth Metrics:
Total Revenue: ⬆️ +1.42%
Casino Revenue: ⬆️ +2.73%
Futures Revenue: ⬆️ +0.78%
Sports Revenue: ⬇️ -7.13%
Total Buyback: ⬆️ +2.07%
RLB Bought: ⬇️ -13.23%
RLB Burned: ⬇️ -13.26%
Distributed to V1 Stakers: ⬇️ -13.26%
AVG RLB Price of Buyback: ⬆️ +17.58%
Averages Data:
Average Hourly Buyback (USD): ⬆️ +2.21%
Average Hourly Buyback (RLB): ⬇️ -13.11%
Average Hourly Burn (RLB): ⬇️ -13.11%
Average Hourly Distributed (RLB): ⬇️ -13.11%
RLB Supply Metrics:
June:
RLB Burnt: 2,433,374,728 RLB (48.67%) - ⬆️ +1.01% Circ. Supply: 2,566,625,272 RLB (51.33%) - ⬇️ -1.01%
July:
RLB Burnt: 2,477,810,414 RLB (49.56%) - ⬆️ +.89%
Circ. Supply: 2,522,189,586 RLB (50.44%) - ⬇️ -.89%
Min/Max Data:
Min Buyback: ⬆️ from $1,457.48 to $1,489.92
Max Buyback: ⬇️ from $55,883.41 to $54,528.30
Important to Note:
- Increase in total revenue with slight gains in Casino and Futures Revenue.
- Overall increase in revenue and buyback funds
- Partnership w/ Southampton FC (Front of Shirt Partner)
Implied Trajectory:
July’s data presents a stable picture of the RLB ecosystem. Could be a highlight of the recent strategic partnership with Southampton FC. This collaboration marks a significant milestone, poised to enhance Rollbit's visibility and credibility in mainstream markets. The modest increase in total revenue, bolstered by gains in Casino and Futures segments, offers a solid foundation for growth.
The partnership with Southampton FC (and other partnerships) is expected to catalyze brand exposure, bringing RLB into the limelight and potentially increasing user engagement through sports betting. While the average buyback price has risen and the quantities of RLB bought and burned have declined, these are seen as short-term fluctuations in a generally optimistic outlook.
The partnerships with a renowned football clubs & Faze Clan not only enhances market presence but also sets the stage for innovative marketing strategies that could draw new users and retain existing ones.
Looking ahead, the synergy between Rollbit’s core offerings and the sports sector could drive significant growth. Enhancing RLB’s utility and attractiveness will be crucial for stabilizing and potentially elevating its value in the broader market.
Time will tell
In the meantime, welcome to the future
1 year ago we launched the RLB Dashboard! 🎉
With this monumental update, we switched $RLB's deflationary mechanic to 'Buy & Burn' 🔥
Here's some crazy statistics for the first year:
Casino revenue: $373,334,343.95
Trading revenue: $89,753,890.77
Sports revenue: $111,873,990.63
RLB bought: 707,524,539.11
RLB distributed to stakers: 70,752,453.91
RLB burnt forever: 636,772,085.20
49.84% of RLB's initial supply of 5 billion has been burnt, with only 50.16% of the supply remaining.
Rollbit is now one of the largest revenue generators in the entire crypto space 💸
We are proud to be the most transparent centralised casino, with no fake wager volume! 🔒
July Buy/Burn Metrics
Comparing June to July. Let's explore the numbers 👇
June Recap:
Casino Revenue: $19,938,472
Futures Revenue: $4,794,833
Sports Revenue: $2,695,288
Total Revenue: $27,428,593
Total Buyback: $3,917,596.65
RLB Bought: 57,147,218.04
RLB Burned: 51,432,496.34
Distributed to V1 Stakers: 5,714,721.77
AVG RLB Price of Buyback: $0.0689
July Data:
Casino Revenue: $20,482,037
Futures Revenue: $4,832,453
Sports Revenue: $2,503,687
Total Revenue: $27,818,177
Total Buyback: $3,998,677.41
RLB Bought: 49,578,072.83
RLB Burned: 44,620,265.72
Distributed to V1 Stakers: 4,957,807.29
AVG RLB Price of Buyback: $0.0810
Growth Metrics:
Total Revenue: ⬆️ +1.42%
Casino Revenue: ⬆️ +2.73%
Futures Revenue: ⬆️ +0.78%
Sports Revenue: ⬇️ -7.13%
Total Buyback: ⬆️ +2.07%
RLB Bought: ⬇️ -13.23%
RLB Burned: ⬇️ -13.26%
Distributed to V1 Stakers: ⬇️ -13.26%
AVG RLB Price of Buyback: ⬆️ +17.58%
Averages Data:
Average Hourly Buyback (USD): ⬆️ +2.21%
Average Hourly Buyback (RLB): ⬇️ -13.11%
Average Hourly Burn (RLB): ⬇️ -13.11%
Average Hourly Distributed (RLB): ⬇️ -13.11%
RLB Supply Metrics:
June:
RLB Burnt: 2,433,374,728 RLB (48.67%) - ⬆️ +1.01% Circ. Supply: 2,566,625,272 RLB (51.33%) - ⬇️ -1.01%
July:
RLB Burnt: 2,477,810,414 RLB (49.56%) - ⬆️ +.89%
Circ. Supply: 2,522,189,586 RLB (50.44%) - ⬇️ -.89%
Min/Max Data:
Min Buyback: ⬆️ from $1,457.48 to $1,489.92
Max Buyback: ⬇️ from $55,883.41 to $54,528.30
Important to Note:
- Increase in total revenue with slight gains in Casino and Futures Revenue.
- Overall increase in revenue and buyback funds
- Partnership w/ Southampton FC (Front of Shirt Partner)
Implied Trajectory:
July’s data presents a stable picture of the RLB ecosystem. Could be a highlight of the recent strategic partnership with Southampton FC. This collaboration marks a significant milestone, poised to enhance Rollbit's visibility and credibility in mainstream markets. The modest increase in total revenue, bolstered by gains in Casino and Futures segments, offers a solid foundation for growth.
The partnership with Southampton FC (and other partnerships) is expected to catalyze brand exposure, bringing RLB into the limelight and potentially increasing user engagement through sports betting. While the average buyback price has risen and the quantities of RLB bought and burned have declined, these are seen as short-term fluctuations in a generally optimistic outlook.
The partnerships with a renowned football clubs & Faze Clan not only enhances market presence but also sets the stage for innovative marketing strategies that could draw new users and retain existing ones.
Looking ahead, the synergy between Rollbit’s core offerings and the sports sector could drive significant growth. Enhancing RLB’s utility and attractiveness will be crucial for stabilizing and potentially elevating its value in the broader market.
Time will tell
In the meantime, welcome to the future
June Buy/Burn Metrics
Comparing May to June. Let's explore the numbers 👇
May Data:
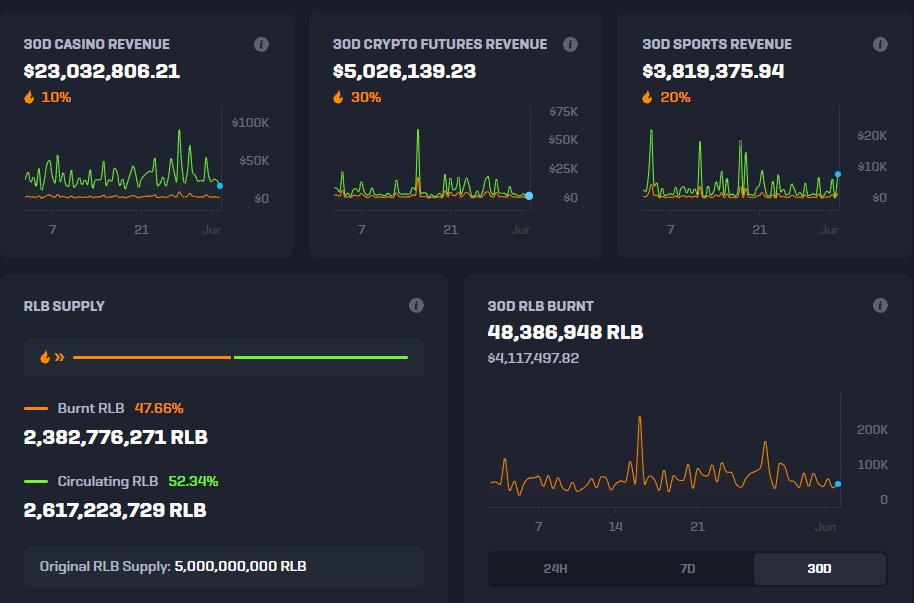
Casino Revenue: $23,032,806
Futures Revenue: $5,026,139
Sports Revenue: $3,819,375
Total Revenue: $31,878,320
Total Buyback: $4,571,177.74
RLB Bought: 53,713,287.83
RLB Burned: 48,341,958.94
Distributed to V1 Stakers: 5,371,328.66
AVG RLB Price of Buyback: $0.0864
June Data:
Casino Revenue: $19,938,472
Futures Revenue: $4,794,833
Sports Revenue: $2,695,288
Total Revenue: $27,428,593
Total Buyback: $3,917,596.65
RLB Bought: 57,147,218.04
RLB Burned: 51,432,496.34
Distributed to V1 Stakers: 5,714,721.77
AVG RLB Price of Buyback: $0.0689
Growth Metrics:
Total Revenue: ⬇️ -13.99%
Casino Revenue: ⬇️ -13.43%
Futures Revenue: ⬇️ -4.60%
Sports Revenue: ⬇️ -29.42%
Total Buyback: ⬇️ -14.31%
RLB Bought: ⬆️ +6.39%
RLB Burned: ⬆️ +6.41%
Distributed to V1 Stakers: ⬆️ +6.39%
AVG RLB Price of Buyback: ⬇️ -20.25%
Averages Data:
Average Hourly Buyback (USD): ⬇️ -14.29%
Average Hourly Buyback (RLB): ⬆️ +6.38%
Average Hourly Burn (RLB): ⬆️ +6.38%
Average Hourly Distributed (RLB): ⬆️ +6.38%
RLB Supply Metrics:
May:
- RLB Burnt: 2,382,809,519 RLB (47.66%)
- Circ. Supply: 2,617,190,481 RLB (52.34%)
June:
RLB Burnt: 2,433,374,728 RLB (48.67%) - ⬆️ +1.01%
Circ. Supply: 2,566,625,272 RLB (51.33%) - ⬇️ -1.01%
Min/Max Data:
Min Buyback: ⬇️ from $1,645.14 to $1,457.48
Max Buyback: ⬇️ from $242,577.21 to $55,883.41
Important to Note:
- Continued decline in total revenue
- Increase in RLB bought and burned despite lower revenues and buyback funds
- Expansion into UK & Asian Markets
Implied Trajectory:
June's data reflects an environment with further revenue declines. The reduction of average buyback price indicates a possible waning demand / valuation concerns.
However, the continued increase in the amount of RLB bought and burned despite declining revenues, emphasizes further supply reduction. Price action implies demand picking up/buyers stepping up at June's low of $0.051 with price sitting at $0.082, at time of writing
Looking forward, sustaining these burn rates amid falling revenues will be crucial. Enhancing RLB's utility and attractiveness in the broader market may be key to reversing this 8 month downtrend and stabilizing the token's value. As well as, expansion into other markets.
I personally believe that final capitulation happened in June and have bet accordingly.
Time will tell.
In the meantime, welcome to the future🤝
June Buy/Burn Metrics
Comparing May to June. Let's explore the numbers 👇
May Data:
Casino Revenue: $23,032,806
Futures Revenue: $5,026,139
Sports Revenue: $3,819,375
Total Revenue: $31,878,320
Total Buyback: $4,571,177.74
RLB Bought: 53,713,287.83
RLB Burned: 48,341,958.94
Distributed to V1 Stakers: 5,371,328.66
AVG RLB Price of Buyback: $0.0864
June Data:
Casino Revenue: $19,938,472
Futures Revenue: $4,794,833
Sports Revenue: $2,695,288
Total Revenue: $27,428,593
Total Buyback: $3,917,596.65
RLB Bought: 57,147,218.04
RLB Burned: 51,432,496.34
Distributed to V1 Stakers: 5,714,721.77
AVG RLB Price of Buyback: $0.0689
Growth Metrics:
Total Revenue: ⬇️ -13.99%
Casino Revenue: ⬇️ -13.43%
Futures Revenue: ⬇️ -4.60%
Sports Revenue: ⬇️ -29.42%
Total Buyback: ⬇️ -14.31%
RLB Bought: ⬆️ +6.39%
RLB Burned: ⬆️ +6.41%
Distributed to V1 Stakers: ⬆️ +6.39%
AVG RLB Price of Buyback: ⬇️ -20.25%
Averages Data:
Average Hourly Buyback (USD): ⬇️ -14.29%
Average Hourly Buyback (RLB): ⬆️ +6.38%
Average Hourly Burn (RLB): ⬆️ +6.38%
Average Hourly Distributed (RLB): ⬆️ +6.38%
RLB Supply Metrics:
May:
- RLB Burnt: 2,382,809,519 RLB (47.66%)
- Circ. Supply: 2,617,190,481 RLB (52.34%)
June:
RLB Burnt: 2,433,374,728 RLB (48.67%) - ⬆️ +1.01%
Circ. Supply: 2,566,625,272 RLB (51.33%) - ⬇️ -1.01%
Min/Max Data:
Min Buyback: ⬇️ from $1,645.14 to $1,457.48
Max Buyback: ⬇️ from $242,577.21 to $55,883.41
Important to Note:
- Continued decline in total revenue
- Increase in RLB bought and burned despite lower revenues and buyback funds
- Expansion into UK & Asian Markets
Implied Trajectory:
June's data reflects an environment with further revenue declines. The reduction of average buyback price indicates a possible waning demand / valuation concerns.
However, the continued increase in the amount of RLB bought and burned despite declining revenues, emphasizes further supply reduction. Price action implies demand picking up/buyers stepping up at June's low of $0.051 with price sitting at $0.082, at time of writing
Looking forward, sustaining these burn rates amid falling revenues will be crucial. Enhancing RLB's utility and attractiveness in the broader market may be key to reversing this 8 month downtrend and stabilizing the token's value. As well as, expansion into other markets.
I personally believe that final capitulation happened in June and have bet accordingly.
Time will tell.
In the meantime, welcome to the future🤝
May Buy/Burn Metrics
Comparing April to May. Let explore the numbers 👇
April Data:
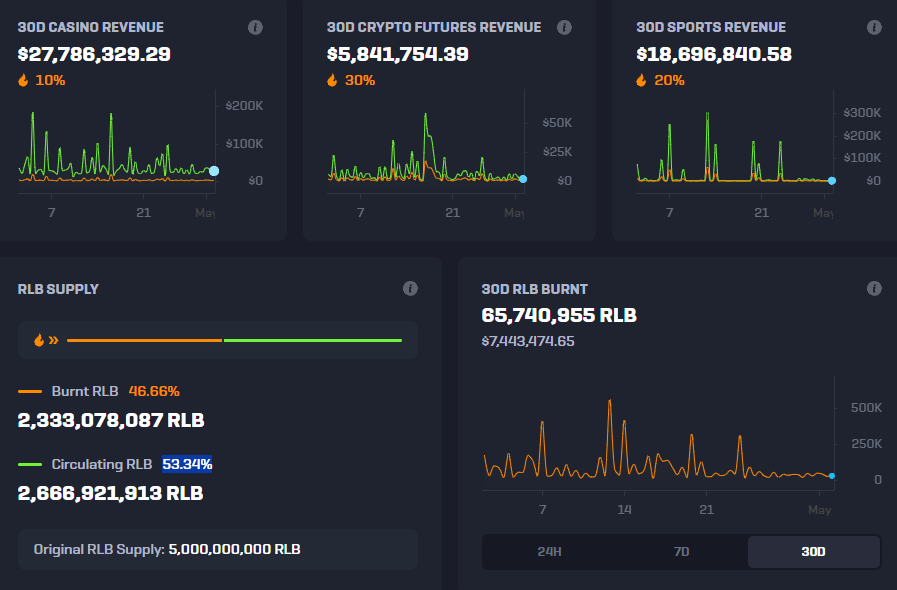
Casino Revenue: $27,786,329
Futures Revenue: $5,841,754
Sports Revenue: $18,696,840
Total Revenue: $52,324,924
Total Buyback: $8,285,300.80
RLB Bought: 73,156,322.93
RLB Burned: 65,840,690.68
Distributed to V1 Stakers: 7,315,632.25
AVG RLB Price of Buyback: $0.1157
May Data:
Casino Revenue: $23,032,806
Futures Revenue: $5,026,139
Sports Revenue: $3,819,375
Total Revenue: $31,878,320
Total Buyback: $4,571,177.74
RLB Bought: 53,713,287.83
RLB Burned: 48,341,958.94
Distributed to V1 Stakers: 5,371,328.66
AVG RLB Price of Buyback: $0.0864
Growth Metrics:
Total Revenue: ⬇️ -39.04%
Casino Revenue: ⬇️ -17.13%
Futures Revenue: ⬇️ -13.95%
Sports Revenue: ⬇️ -79.59%
Total Buyback: ⬇️ -44.85%
RLB Bought: ⬇️ -26.55%
RLB Burned: ⬇️ -26.60%
Distributed to V1 Stakers: ⬇️ -26.58%
AVG RLB Price of Buyback: ⬇️ -25.34%
Averages Data:
Average Hourly Buyback (USD): ⬇️ -44.79%
Average Hourly Buyback (RLB): ⬇️ -26.63%
Average Hourly Burn (RLB): ⬇️ -26.64%
Average Hourly Distributed (RLB): ⬇️ -26.64%
RLB Supply Metrics:
April:
- RLB Burnt: 2,333,078,087 RLB (46.66%)
- Circ. Supply: 2,666,921,913 RLB (53.34%)
May:
- RLB Burnt: 2,382,809,519 RLB (47.66%) +1.00%
- Circ. Supply: 2,617,190,481 RLB (52.34%) -1.00%
Min/Max Data:
Min Buyback: ⬆️ from $969.47 to $1,645.14
Max Buyback: ⬆️ from $90,387.05 to $242,577.21
Important to note:
- Significant declines across all revenue sources, most notable in the Sports sector.
- 10%+ of supply has been burned since B/B implementation (August 23')
Implied Trajectory:
May's data signals a substantial contraction in RLB's market activities, with sharp declines in revenue and related buyback activities. Decrease in sports betting revenue could reflect seasonality of sports, and (I believe) a high-roller either moved away from Rollbit's platform or isn't wagering with as much size.
Despite these declines, the persistent efforts in RLB buyback and burn are noteworthy, as B/B continues to support the token's deflationary strategy. However, the reduction in the average buyback price might raise concerns about the underlying demand and market valuation of RLB.
Key challenge will be to stabilize revenue streams and regain growth momentum, ensuring the sustainability of buyback and burn operations amidst fluctuating market conditions.
(I have no data to back this up, but opportunity cost seems to be a major contributor to RLB's sell pressure. CEX listing seems like the next logical step for price action catalyst, but doesn't seem like a lot of RLB holders are waiting on that news to break.)
Time will tell.
In the meantime, welcome to the future.
May Buy/Burn Metrics
Comparing April to May. Let explore the numbers 👇
April Data:
Casino Revenue: $27,786,329
Futures Revenue: $5,841,754
Sports Revenue: $18,696,840
Total Revenue: $52,324,924
Total Buyback: $8,285,300.80
RLB Bought: 73,156,322.93
RLB Burned: 65,840,690.68
Distributed to V1 Stakers: 7,315,632.25
AVG RLB Price of Buyback: $0.1157
May Data:
Casino Revenue: $23,032,806
Futures Revenue: $5,026,139
Sports Revenue: $3,819,375
Total Revenue: $31,878,320
Total Buyback: $4,571,177.74
RLB Bought: 53,713,287.83
RLB Burned: 48,341,958.94
Distributed to V1 Stakers: 5,371,328.66
AVG RLB Price of Buyback: $0.0864
Growth Metrics:
Total Revenue: ⬇️ -39.04%
Casino Revenue: ⬇️ -17.13%
Futures Revenue: ⬇️ -13.95%
Sports Revenue: ⬇️ -79.59%
Total Buyback: ⬇️ -44.85%
RLB Bought: ⬇️ -26.55%
RLB Burned: ⬇️ -26.60%
Distributed to V1 Stakers: ⬇️ -26.58%
AVG RLB Price of Buyback: ⬇️ -25.34%
Averages Data:
Average Hourly Buyback (USD): ⬇️ -44.79%
Average Hourly Buyback (RLB): ⬇️ -26.63%
Average Hourly Burn (RLB): ⬇️ -26.64%
Average Hourly Distributed (RLB): ⬇️ -26.64%
RLB Supply Metrics:
April:
- RLB Burnt: 2,333,078,087 RLB (46.66%)
- Circ. Supply: 2,666,921,913 RLB (53.34%)
May:
- RLB Burnt: 2,382,809,519 RLB (47.66%) +1.00%
- Circ. Supply: 2,617,190,481 RLB (52.34%) -1.00%
Min/Max Data:
Min Buyback: ⬆️ from $969.47 to $1,645.14
Max Buyback: ⬆️ from $90,387.05 to $242,577.21
Important to note:
- Significant declines across all revenue sources, most notable in the Sports sector.
- 10%+ of supply has been burned since B/B implementation (August 23')
Implied Trajectory:
May's data signals a substantial contraction in RLB's market activities, with sharp declines in revenue and related buyback activities. Decrease in sports betting revenue could reflect seasonality of sports, and (I believe) a high-roller either moved away from Rollbit's platform or isn't wagering with as much size.
Despite these declines, the persistent efforts in RLB buyback and burn are noteworthy, as B/B continues to support the token's deflationary strategy. However, the reduction in the average buyback price might raise concerns about the underlying demand and market valuation of RLB.
Key challenge will be to stabilize revenue streams and regain growth momentum, ensuring the sustainability of buyback and burn operations amidst fluctuating market conditions.
(I have no data to back this up, but opportunity cost seems to be a major contributor to RLB's sell pressure. CEX listing seems like the next logical step for price action catalyst, but doesn't seem like a lot of RLB holders are waiting on that news to break.)
Time will tell.
In the meantime, welcome to the future.
April Buy/Burn Metrics:
Comparing March to April. Lets explore the numbers👇
March Recap:
Casino Revenue: $34,722,304
Futures Revenue: $8,287,172
Sports Revenue: $20,134,834
Total Revenue: $63,144,312
Total Buyback: $10,180,230.40
RLB Bought: 87,613,039.39
RLB Burned: 78,851,735.32
Distributed to V1 Stakers: 8,761,303.96
AVG RLB Price of Buyback: $0.1142
April Data:
Casino Revenue: $27,786,329
Futures Revenue: $5,841,754
Sports Revenue: $18,696,840
Total Revenue: $52,324,924
Total Buyback: $8,285,300.80
RLB Bought: 73,156,322.93
RLB Burned: 65,840,690.68
Distributed to V1 Stakers: 7,315,632.25
AVG RLB Price of Buyback: $0.1157
Growth Metrics:
Total Revenue: ⬇️ -17.13%
Casino Revenue: ⬇️ -20.02%
Futures Revenue: ⬇️ -29.53%
Sports Revenue: ⬇️ -7.15%
Total Buyback: ⬇️ -18.62%
RLB Bought: ⬇️ -16.56%
RLB Burned: ⬇️ -16.49%
Distributed to V1 Stakers: ⬇️ -16.49%
AVG RLB Price of Buyback: ⬆️ +1.31%
Averages Data:
Average Hourly Buyback (USD): ⬇️ -16.47%
Average Hourly Buyback (RLB): ⬇️ -14.28%
Average Hourly Burn (RLB): ⬇️ -14.26%
Average Hourly Distributed (RLB): ⬇️ -14.29%
RLB Supply Metrics:
March:
- RLB Burnt: 2,110,052,172 RLB (43.79%)
- Circulating Supply: 2,889,947,828 RLB (56.21%)
April:
- RLB Burnt: 2,333,078,087 RLB (46.66%) - ⬆️ +2.87%
- Circulating Supply: 2,666,921,913 RLB (53.34%) - ⬇️ -2.87%
Important to Note:
- Notable declines across all revenue sources with a significant reduction in buyback and burn activities, despite a slight increase in the average buyback price.
- These reductions reflect overall challenging market environment, affecting liquidity.
- Burn of 71.7 million RLB on Solana chain
Implied Trajectory:
April's data shows a contraction in RLB's B/B operations, which can be explained by overall market downturn. Also supported by a decrease in revenue and corresponding buyback activities. The reduction in casino and futures revenues is concerning, but makes sense as Rollbit has been a guaranteed source of liquidity. Holders taking liquidity from RLB to rotate in other areas of the market. We have seen this behavior in cycles past.
Looking ahead, the challenge for RLB will be to navigate this contracting market while striving to maintain or increase the value of its token through strategic buyback and burn initiatives. Wouldn't be surprised to see an increase in casino revenue next month if market chops sideways from here.
Is it over, or is this good entry? Time will tell!
In the meantime, welcome to the future!
February Buy/Burn Metrics:
Comparing February to March. Lets explore the numbers👇
February Recap:
Casino Revenue: $34,662,372
Futures Revenue: $5,907,895
Sports Revenue: $22,410,978
Total Revenue: $62,981,245
Total Buyback: $9,577,694.18
RLB Bought: 71,636,558.50
RLB Burned: 64,472,902.60
Distributed to V1 Stakers: 7,163,655.85
AVG RLB Price of Buyback: $0.1350
March Data:
Casino Revenue: $34,722,304
Futures Revenue: $8,287,172
Sports Revenue: $20,134,834
Total Revenue: $63,144,312
Total Buyback: $10,180,230.40
RLB Bought: 87,613,039.39
RLB Burned: 78,851,735.32
Distributed to V1 Stakers: 8,761,303.96
AVG RLB Price of Buyback: $0.1142
Growth Metrics:
Total Revenue: ⬆️ +0.26%
Casino Revenue: ⬆️ +0.17%
Futures Revenue: ⬆️ +40.29%
Sports Revenue: ⬇️ -10.17%
Total Buyback: ⬆️ +6.29%
RLB Bought/Burned/Distributed: ⬆️ +22.30%
AVG RLB Price of Buyback: ⬇️ -15.41%
Averages Data:
Average Hourly Buyback (USD): ⬆️ +1.97%
RLB Burn Metrics:
February RLB Burnt: 2,110,052,172 RLB (42.20%)
March RLB Burnt: 2,189,903,907 RLB (43.79%) 🔥 1.59%
Min/Max Data:
Min Buyback: ⬆️ from $2,045.04 (Feb) to $2,630.90 (March)
Max Buyback: ⬆️ from $84,903.34(Feb) to $423,034.55(March)
Important to Note:
- SC 30D numbers, metrics 31D numbers
- AMA announced KYC requirement for Revshare claims
-Increase in RLB B/B, Max buyback number correlates with overflow buyback
Implied Trajectory:
March's data suggests a nuanced trajectory for RLB. The significant growth in Futures Revenue from previous month and the overall increase in buyback activities highlight RLB's continued volume throughout all revenue streams. The increase in the volume of RLB bought and burned indicates an increase in overall growth, but minimal price appreciation. The decrease in RLB's average buyback price raises questions about market valuation and demand dynamics.
The ability to sustain increased B/B rates could be pivotal for RLB's appreciation. Yet, the challenge lies in correlation between the supply-side strategies and demand-side growth.
Could this final capitulation? 🤔
In the meantime, welcome to the future!
In 5 days, even more RLB supply is going to be burnt by team @rollbitcom
If you have any on SOL, would highly recommend migrating before it’s too late
If you’re an rlb holder, get ready to see a mega burn