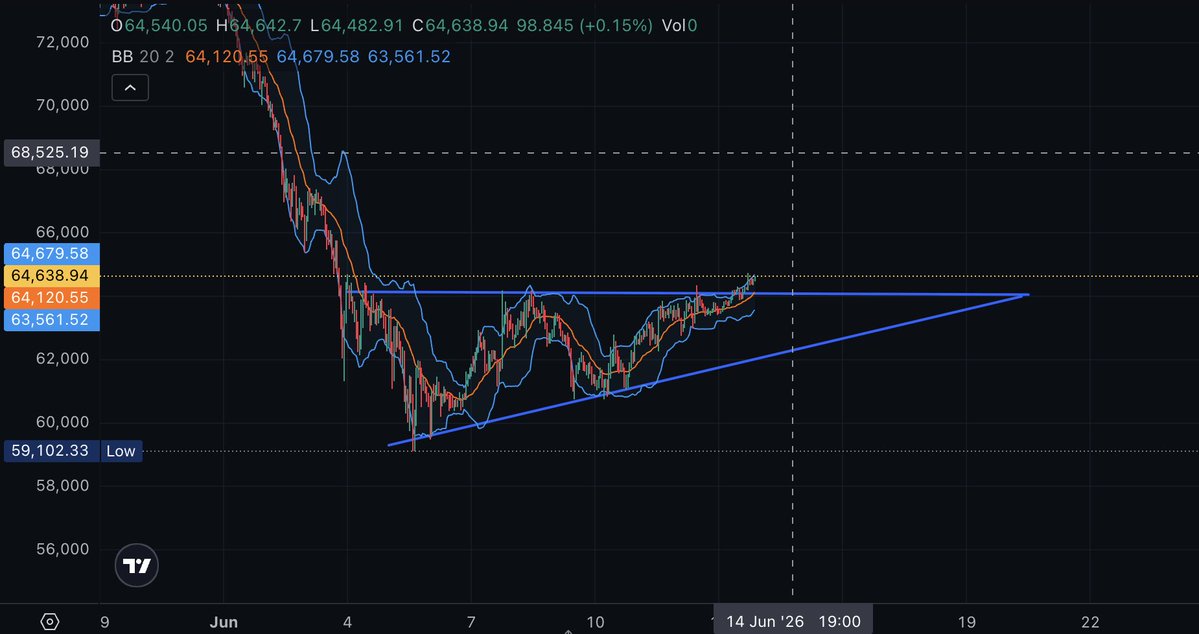
Right now I am heavily skewed long in short-mid-long term plays again. I am expecting pump action out of this range. $ETH, $SOL, and $BTC. On #ETH & #BTC in particular this is the kind of ascending triangle i wanted to see mark the bottom of the drop. #BTC starting to break out.
Short-mid term prospects on bitcoin:native , solana:So11111111111111111111111111111111111111112 , and ethereum:native have flipped bullish. The last impulsive move down was weak and seller exhaustion on a macro scale is setting in.
Here are solana:So11111111111111111111111111111111111111112 & bitcoin:native . These patterns suggest the price is will rise in near future. These are the areas where heavy accumulation should take place. We have likely seen the bottom of th bear market. The war in #iran will likely start winding down, #crypto will snap higher.
These trades are structured like scalps but I intend to ride them into trends. Hoped my previous positions carried further but my liberal profit taking secured impressive profits none the less.
I restructured long positions on $sol at ~ 64 with the expectation that the price will not fall below 58 and 1585 on $eth with the expectation that the price will not fall below 1450. The push down to 60 on sol lacked the strength of the push to 67 in Feb. same deal with $Eth.
I’ve reorganized longs with profits from the previous trade. My assumption is that the short-intermediate floor is right around here. -35% in the last ~ 3 weeks. I’ve been absent for the last several weeks because I had the feeling this was something I needed to see shake out.
I’ve been quietly observing the price action as of late. Short to mid term is busted but I’m still skewed long. I have taken the foot off of full throttle until things become more recognizable. I was trading with peak aggression on every time frame for 8 weeks.
The odds of bitcoin:native continuation higher from here are heavily skewed long. In excess of 70%. Full ascending triangle validation into backtest of the breakout spot via controlled descending channel. Bull flag continuation higher after upside break is as high odds as you can get.
The odds of bitcoin:native continuation higher from here are heavily skewed long. In excess of 70%. Full ascending triangle validation into backtest of the breakout spot via controlled descending channel. Bull flag continuation higher after upside break is as high odds as you can get.
The great thing about patterns across markets is they do not care about or consider your flawed understanding of how the world works. The pattern reflects the buildup of emotion and tells you which way that emotion will materialize before it happens. That is all.
The "dollar is dead" sentiment taken to the extreme has resulted in the widespread destruction of those positioning against it. Like the Nebraska farmers in the 1970s. The farmers got squeezed and collapsed the entire state financial infrastructure. By the time you see the problem, the market has already reacted.
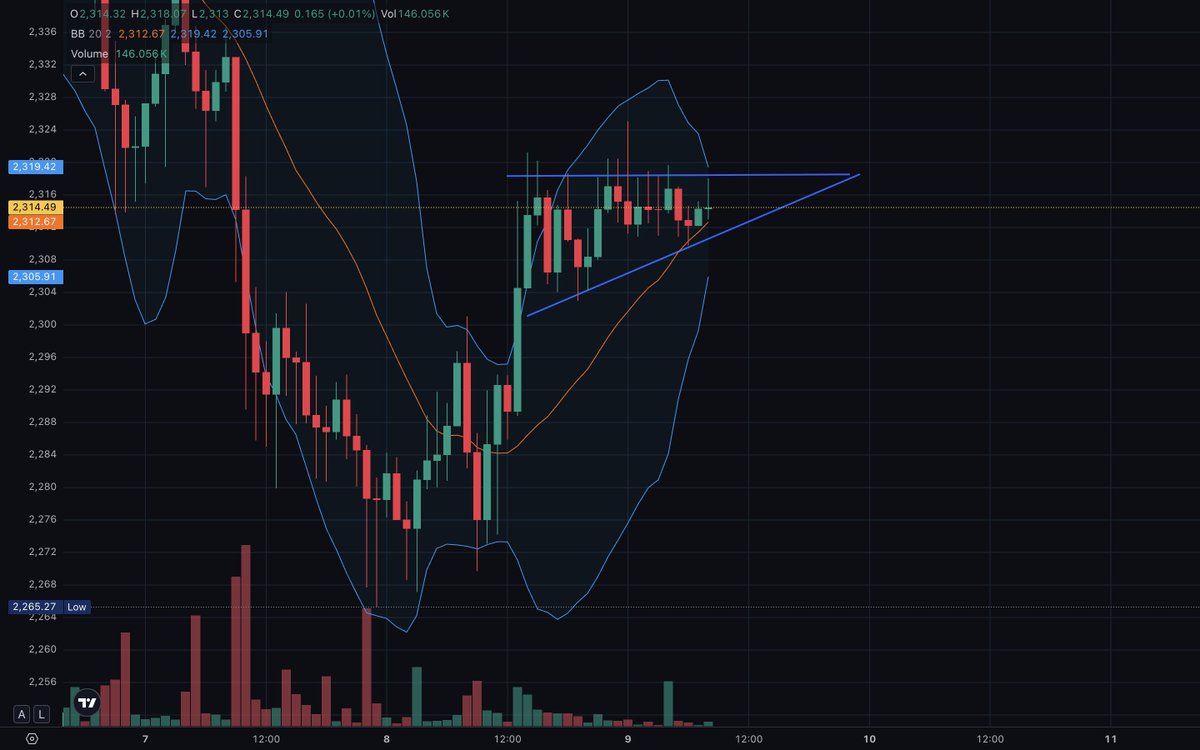
On ethereum:native 1h time frame we have a clear bottom formation into an ascending triangle. Again, continuation is favored. On ethereum:native , bitcoin:native , and solana:So11111111111111111111111111111111111111112 I am given very little reason to believe a deeper retracement will occur.
On bitcoin:native the technical set up for continuation higher is as obvious as it gets on every time frame. 30min, 4h, 1d. micro-mid-macro set up favors continuation. The invalidation is tight, bitcoin:native cannot start closing candles under 79k.
bitcoin:native appears to have printed another bull flag with the beginnings of a break to the upside. Things still don't appear to be slowing down. Clean backtest of the 1h ascending triangle. Should make a move higher from here.
The funny thing about black swans is they happen during times people least expect. They don't cater to groupies looking for a perfect entry. The market can and will remain irrational longer than you can be solvent. The rationality will come back right as you break.
$Sol still on fire because the nearest resistance is 95-100 band. It's getting there, and I am shoveling out of this short term position now. Will not finish exiting until it goes over 95. My mistake is not going heavier on leverage.
Here we have solana:So11111111111111111111111111111111111111112 & bitcoin:native on the 1h chart. SOL has maintained it strength and positioning against a bitcoin:native & ethereum:native pullback. SOL has the moving average support and a stronger bullish continuation pattern. BTC may have formed a bull flag type of pattern, though not perfect.
When you nail the bottom you can set the margin of error extremely small, crank the leverage, and go up 400% before anyone gets a clue. Sold down 40% of these positions at this stage. Will be done selling down this position after full mean reversion ~ 90-95k $BTC
1) My cost basis on $BTC is 67.5k, for #ETH it is - 2000, for #SOL it is 80.6. I am putting this out there so my record is public because I believe in my thesis so much that I will publicly die on this hill if the 1% chance I am wrong happens. heavy leverage. Razor thin margin.