📌 What 20+ Years in Indian Markets Taught Me
The index hides more than it reveals. Look underneath.
Flows matter before headlines do.
Valuations don't matter — until they suddenly matter a lot.
The crowd is right in trends, and wrong at turning points.
Risk shows up in structure before it shows up in sentiment.
-----------------------
🔍 I use this account to share:
📊 Market Structure
💰 Flows
🌐 Macro Risk
📐 Valuation Context
Frameworks over tips. Personal views only.
⚠️ Not SEBI registered. Not investment advice.
@SanaSecurities@SanaSecurities Of course.
FIIs get an LTCG discount so they'll kindly stop leaving.
DIIs & retail get a higher STT because — according to the govt — we're all enjoying "very low" tax rates. 🙃
Don't worry, there's still "plenty of room" to tax us more. How generous.
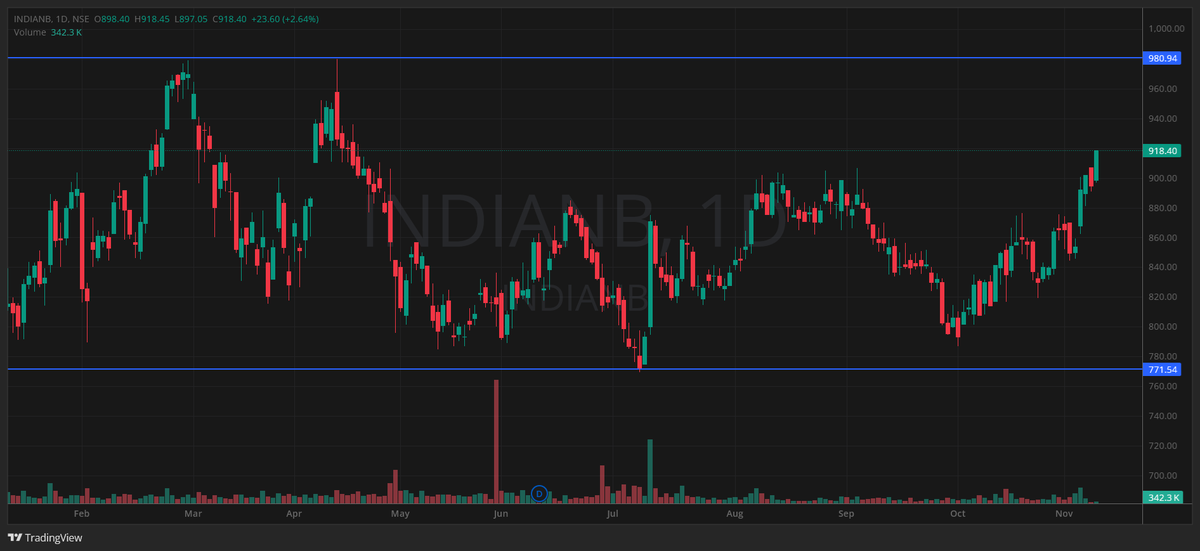
Indian Bank at day high of 914 — still riding the Q2 wave since results on 15 Oct (PAT +13.92% YoY to ₹3,540 cr). 💪
Double top at 979–980 (Feb & Apr '26) is the level to watch.
Heading back to test 980? What's your call? 👇
#IndianBank#PSUBanks#Breakout
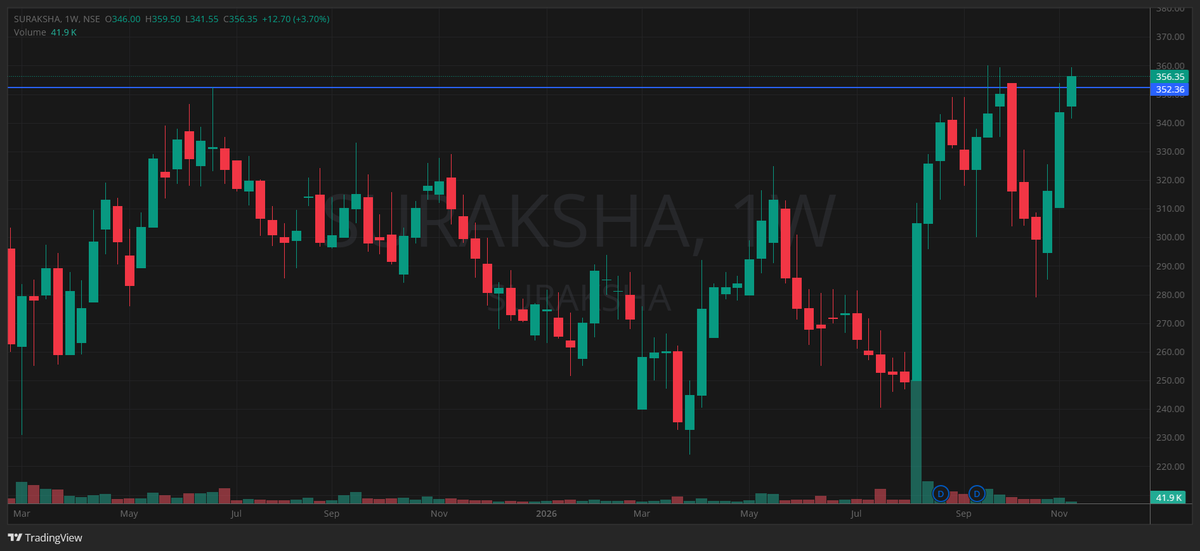
Suraksha Diagnostic Ltd has tested and broken above its 23rd June 2025 high of ₹352.50, now trading near ₹356.
Breakout or fakeout? Will it sustain above this level? 🤔
#SurakshaDiagnostic#StockMarket#Breakout#NSE
The Sovereign De-Dollarisation Playbook: what it needs, and who has it
Step 1: Reduce reliance on paper claims
China: US Treasury holdings have declined over time
India: reserves still mostly dollar assets
Step 2: Build a hard asset buffer at the central bank
China: 24 straight months of gold buying, 78.3m oz
India: RBI also buying, and has repatriated gold from overseas vaults
Step 3: Let the private balance sheet hold the hedge too
China: open import channels, insurers allowed gold pilots, no discouragement of households
India: appeals to cut buying, heavy duties, curbs on gold fund routes
Step 4: Anchor the currency story
China: gold supports the yuan's credibility as an alternative reserve currency
India: rupee defended by suppressing imports, not by building a hedge
Result
China: hedge at the state and citizen level -> long-term positive
India: hedge at one level -> long-term negative
Test: a de-dollarisation strategy that stops at the central bank is only half a playbook.
China's playbook: cut paper dollar exposure, add gold at the central bank, keep the door open for households and insurers. 24 straight months, 78.3m oz.
India's playbook: ask households to buy less gold.
One builds sanction-proof wealth. The other trims it.
Long term, which side of this are you on?
China's playbook: cut paper dollar exposure, add gold at the central bank, keep the door open for households and insurers. 24 straight months, 78.3m oz.
India's playbook: ask households to buy less gold.
One builds sanction-proof wealth. The other trims it.
Long term, which side of this are you on?
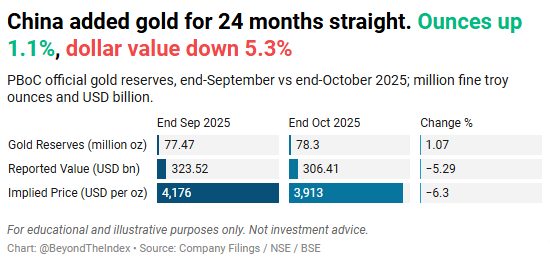
China bought 0.83m oz in October. Reported value of the gold still fell $17bn.
Which tells you the PBoC isn't buying on price.
Month 24 of buying, and they didn't care that the metal dropped ~9% MoM on the implied numbers.
Price-insensitive buyer.
Is that a floor or a trap for everyone else?
Why China keeps buying gold when it already mines the most of it?
Short answer: mining and reserve-building solve different problems.
Domestic output: China is the world's largest gold miner, but the supply goes mostly to jewellery and industry, not the central bank
Dollar exposure: the bulk of FX reserves sit in USD assets. Gold can't be frozen, sanctioned or defaulted on
Sanctions lesson: Russia's reserves were frozen in 2022. Every central bank with a rival-power problem noticed
Diversification: gold has no counterparty. Treasuries do
De-dollarisation: gradual, quiet, and gold is the least political way to do it
Trade settlement: gold helps if yuan settlement and alternative payment rails grow
Oct 2025 data:
Holdings: 77.47m oz -> 78.30m oz
Value: $323.52bn -> $306.41bn
Streak: 24 consecutive months
Worth saving for the next time a "why are central banks buying" thread comes up.
Why China keeps buying gold when it already mines the most of it?
Short answer: mining and reserve-building solve different problems.
Domestic output: China is the world's largest gold miner, but the supply goes mostly to jewellery and industry, not the central bank
Dollar exposure: the bulk of FX reserves sit in USD assets. Gold can't be frozen, sanctioned or defaulted on
Sanctions lesson: Russia's reserves were frozen in 2022. Every central bank with a rival-power problem noticed
Diversification: gold has no counterparty. Treasuries do
De-dollarisation: gradual, quiet, and gold is the least political way to do it
Trade settlement: gold helps if yuan settlement and alternative payment rails grow
Oct 2025 data:
Holdings: 77.47m oz -> 78.30m oz
Value: $323.52bn -> $306.41bn
Streak: 24 consecutive months
Worth saving for the next time a "why are central banks buying" thread comes up.
LIC's CEO says IRDAI's proposed commission caps will have "the least impact" on LIC.
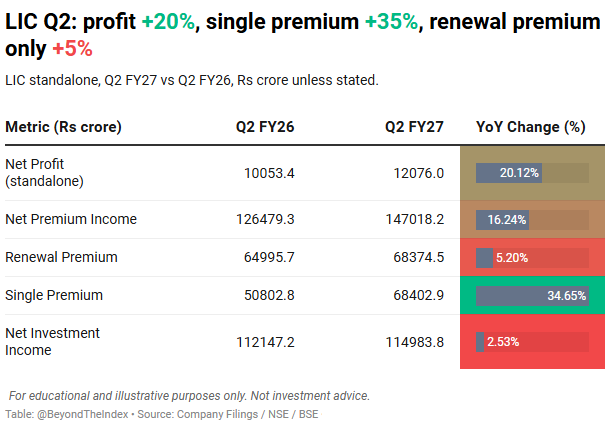
Q2 renewal premium: +5%. Single premium: +35%. Net profit +20%.
The cost story is fine. But growth is coming from the less sticky part of the premium mix. Is the commission cap the real risk to LIC, or is it single premium dependence?
LIC on IRDAI's proposed commission caps, CEO interview, summarised.
On the regulation
- IRDAI consultation paper aims to cut distribution expenses
- LIC says it already runs internal caps on commission and distribution cost
- "More or less compliant", except some product lines and some premium-paying terms under regular premium plans
- Possible action: withdraw, refile or modify products
- Impact on LIC: "least", in his words. Higher-cost insurers face more pressure
- Feedback already submitted to the regulator
On margins
- VNB margin: 22.3%
- Drivers cited: product mix, higher non-par ticket sizes, protection and savings focus
- Target mix: roughly one-third non-par, two-thirds par (as stated in the interview)
FY27 priorities
- Individual term, savings, annuity, ULIPs, health
- Launches: Health Shield, New Cancer Cover, Jeevan Raksha (pure term)
- Bima Sakhi in every panchayat, ~66% covered so far
Q2 FY27 standalone (Rs crore)
- Net profit: 12,076.02 vs 10,053.39 (+20.12%)
- Net premium: 1,47,018.18 vs 1,26,479.26 (+16.24%)
- Renewal premium: 68,374.53 vs 64,995.67 (+5.2%)
- Single premium: 68,402.86 vs 50,802.84 (+34.7%)
- Net investment income: 1,14,983.77 vs 1,12,147.16 (+2.5%)
Open question: which product lines and premium-paying terms are non-compliant, and how large are they in new business?
LIC on IRDAI's proposed commission caps, CEO interview, summarised.
On the regulation
- IRDAI consultation paper aims to cut distribution expenses
- LIC says it already runs internal caps on commission and distribution cost
- "More or less compliant", except some product lines and some premium-paying terms under regular premium plans
- Possible action: withdraw, refile or modify products
- Impact on LIC: "least", in his words. Higher-cost insurers face more pressure
- Feedback already submitted to the regulator
On margins
- VNB margin: 22.3%
- Drivers cited: product mix, higher non-par ticket sizes, protection and savings focus
- Target mix: roughly one-third non-par, two-thirds par (as stated in the interview)
FY27 priorities
- Individual term, savings, annuity, ULIPs, health
- Launches: Health Shield, New Cancer Cover, Jeevan Raksha (pure term)
- Bima Sakhi in every panchayat, ~66% covered so far
Q2 FY27 standalone (Rs crore)
- Net profit: 12,076.02 vs 10,053.39 (+20.12%)
- Net premium: 1,47,018.18 vs 1,26,479.26 (+16.24%)
- Renewal premium: 68,374.53 vs 64,995.67 (+5.2%)
- Single premium: 68,402.86 vs 50,802.84 (+34.7%)
- Net investment income: 1,14,983.77 vs 1,12,147.16 (+2.5%)
Open question: which product lines and premium-paying terms are non-compliant, and how large are they in new business?
Aadhar Housing Q2: AUM +18%, disbursements +22%, PAT +16%.
Provisions jumped 84% to Rs 24 cr while GNPA improved 8 bps to 1.34%. Credit cost is rising even though the reported asset quality looks clean.
Is that prudence, or are they building a buffer for something they can see coming?
Happy Forgings Q2: revenue +33%, PAT +33%, OPM flat at 30.6%.
Loan funds went from Rs 193 cr to Rs 543 cr in a year. Cash halved. Debtors +28%.
Great growth, but it's being financed by the balance sheet.
Is Rs 500 cr more capex the right call at a peak cycle?
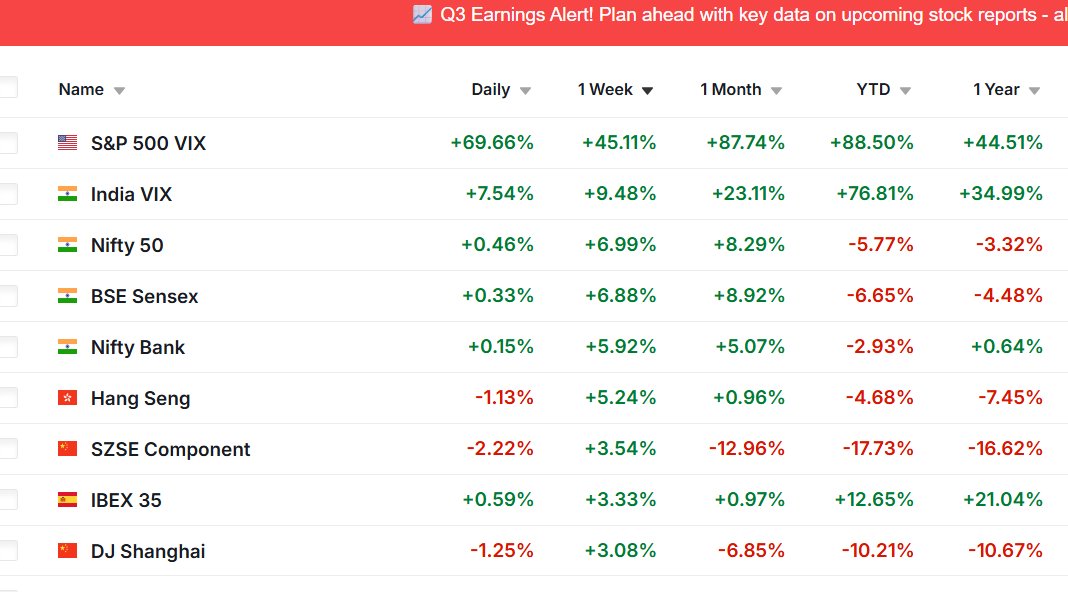
Nifty is now the world's BEST performing index on a weekly and monthly basis!
NOTE THIS: Dalal Street is UP today at a time when there is CARNAGE SELLING across Asia!
Fii Net investment of 14,900 cr HELPS!
Indian aviation’s next growth trigger may not come from airports.
It may come from geopolitics.
A de-escalation in West Asia could lower fuel and rerouting costs, restore flight schedules and bring back passengers priced out by expensive fares.
The “peace dividend” could become aviation’s recovery trade.
US midterms ne mood badla hai, India ke risks nahi.
Crude gira, rupee ko support mila aur FPI flows wapas aa sakte hain.
Lekin Russian oil par tariff risk, trade uncertainty aur West Asia abhi bhi major concerns hain.
India ko breathing room mila hai.
Clean runway nahi.
India may get a breather from the US midterm outcome.
Lower crude can ease pressure on inflation, the current account and the rupee. FPI flows may also improve.
But the risks haven’t disappeared:
• Russian oil tariff threats remain reversible
• Trade policy still rests largely with the White House
• West Asia can send crude higher again
This is relief—not resolution.
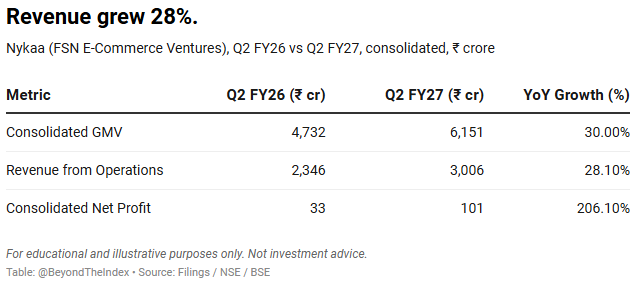
Nykaa added ₹660 cr of revenue YoY in Q2 and kept ₹68 cr of it as profit.
That's ~10% incremental margin.
Headline PAT margin is still 3.4%.
The stock trades on one of those numbers. Not sure the market has decided which.
Nykaa Q2 FY27, the numbers worth keeping, including the ones you have to work out yourself:
GMV: ₹6,151 cr, +30% YoY
Revenue: ₹3,006 cr, +28% YoY
PAT: ₹101 cr vs ₹33 cr
Derived:
- Beauty GMV ₹4,454 cr = ~72% of total GMV
- Non-beauty GMV (fashion + others) ≈ ₹1,697 cr
- Revenue/GMV ≈ 48.9%, down slightly from ~49.6% a year ago
- PAT margin 3.4% vs 1.4%
- Incremental PAT margin ≈ 10%
Why revenue grew slower than GMV: more of the growth is coming from marketplace-style GMV, where Nykaa books only part of the sale as revenue.
Still to check in the full filing:
- Other income as a share of PBT
- PAT attributable to owners vs consolidated (minority interest)
- Marketing as % of revenue. Management credits marketing and overhead efficiency, so verify the number
- Fashion segment EBITDA trend
- ESOP cost line
GE Vernova T&D India now has a Power Grid Letter of Award for one of the larger transmission packages in the current cycle: a 6,000 MW, ±800 kV HVDC LCC terminal station (2x3,000 MW) to carry renewable power from Barmer II in Rajasthan to South Kalamb in Maharashtra.
Why it stands out:
- ±800 kV is the top voltage class used in India's HVDC buildout, and very few vendors can deliver LCC terminal stations at this scale.
- The project links desert solar and wind capacity to load centres in western India, where AC transmission alone struggles.
- The award moves the company deeper into HVDC work, beyond its core substation and AC equipment business.
Disc: Illustrative GVT&D analysis for educational purposes; not a recommendation. Holding: No. Market risks & SEBI RA discl. in bio.
Nykaa Q2 FY27, the numbers worth keeping, including the ones you have to work out yourself:
GMV: ₹6,151 cr, +30% YoY
Revenue: ₹3,006 cr, +28% YoY
PAT: ₹101 cr vs ₹33 cr
Derived:
- Beauty GMV ₹4,454 cr = ~72% of total GMV
- Non-beauty GMV (fashion + others) ≈ ₹1,697 cr
- Revenue/GMV ≈ 48.9%, down slightly from ~49.6% a year ago
- PAT margin 3.4% vs 1.4%
- Incremental PAT margin ≈ 10%
Why revenue grew slower than GMV: more of the growth is coming from marketplace-style GMV, where Nykaa books only part of the sale as revenue.
Still to check in the full filing:
- Other income as a share of PBT
- PAT attributable to owners vs consolidated (minority interest)
- Marketing as % of revenue. Management credits marketing and overhead efficiency, so verify the number
- Fashion segment EBITDA trend
- ESOP cost line
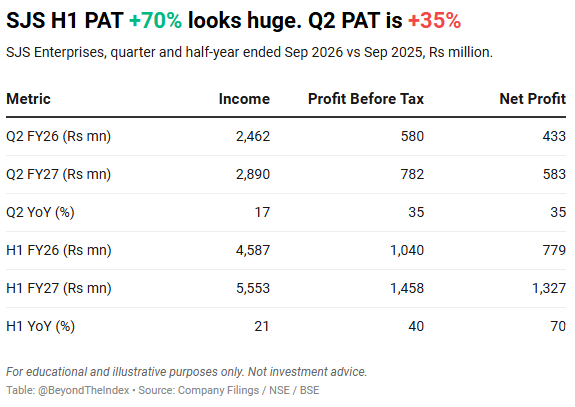
SJS H1 PAT +70%. Q2 PAT +35%.
H1 PBT is 1,458 mn. H1 PAT is 1,327 mn. Q1 PAT alone (~744) was higher than Q1 PBT (~676).
So which one is the growth rate for SJS, 70% or 35%?
SJS Enterprises, Sep 2026 vs Sep 2025 (Rs mn)
Quarter:
Income: 2,462 -> 2,890 (+17.4%)
PBT: 580 -> 782 (+34.7%)
PAT: 433 -> 583 (+34.8%)
Half-year:
Income: 4,587 -> 5,553 (+21.1%)
PBT: 1,040 -> 1,458 (+40.3%)
PAT: 779 -> 1,327 (+70.4%)
Margins (Q2):
- PBT: 23.6% -> 27.1%
- PAT: 17.6% -> 20.2%
Derived Q1 FY27 (H1 minus Q2):
- Income ~2,663
- PBT ~676
- PAT ~744 (above PBT)
What to take from it:
- Q2 is a clean quarter: PBT and PAT both +35%, tax gap normal (~25%)
- Q1 PAT > PBT means a tax credit or exceptional item below PBT
- H1 PAT +70% is not a run-rate
- Profit Before EO = PBT in both periods, so no exceptional item above PBT
Check in the filing: deferred tax, minority interest, any share of associates.
SJS Enterprises, Sep 2026 vs Sep 2025 (Rs mn)
Quarter:
Income: 2,462 -> 2,890 (+17.4%)
PBT: 580 -> 782 (+34.7%)
PAT: 433 -> 583 (+34.8%)
Half-year:
Income: 4,587 -> 5,553 (+21.1%)
PBT: 1,040 -> 1,458 (+40.3%)
PAT: 779 -> 1,327 (+70.4%)
Margins (Q2):
- PBT: 23.6% -> 27.1%
- PAT: 17.6% -> 20.2%
Derived Q1 FY27 (H1 minus Q2):
- Income ~2,663
- PBT ~676
- PAT ~744 (above PBT)
What to take from it:
- Q2 is a clean quarter: PBT and PAT both +35%, tax gap normal (~25%)
- Q1 PAT > PBT means a tax credit or exceptional item below PBT
- H1 PAT +70% is not a run-rate
- Profit Before EO = PBT in both periods, so no exceptional item above PBT
Check in the filing: deferred tax, minority interest, any share of associates.