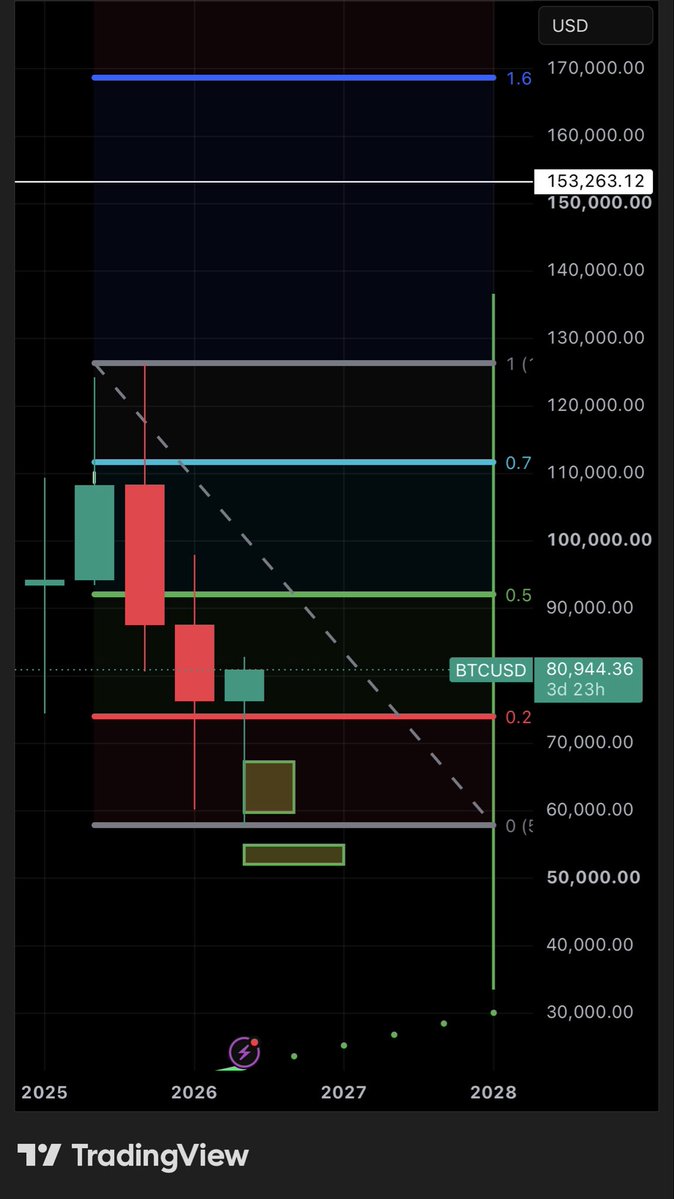
Look left and you will find a Spinning Top created in January which broke out towards a new ATH. This will serve as the resistance towards a new bull market.
• 300+ days of market restructuring itself. Fake outs are very common. But after consolidating for 10 weeks. The market technically went into reset mode. This is a very good piece of information. We broke out the bear flag pattern.
• Bullish divergence can take between months to years to complete. Current formation date start time is January 2026 and counting.
• NOTHING IS GUARANTEED
• A KEY detail to note with the head and shoulders is once the pattern is active. It is very notorious for testing the baseline of the shoulders. Usually the right side.
• Reclaiming the 50 MA is only the first test. Holding it as support and slowly continuing the uptrend is the key to flipping the switch. The market as of now has respected the ranges between 57-60k.
• Main thing to note is the market rested for 10 weeks with no general direction. This allows the market to build structure and POSSIBLY form a launchpad for an uptrend.
• No matter what indicators you have it doesn’t mean a single thing till price action proves otherwise.
4. RSI on the 3 days chart. This recorded the second biggest drop in the history. Indicating a bottom beginning to carve out. And accumulation by the Institutions. But a bottom can form a lower low while RSI forms a higher low. Which is bullish. 2023 is an example.
3. Expect a little more sideway action. After a major rally up or down. The market begins to relax and form structure. It’s a critical part of Bitcoins journey.
2. Bitcoin Monthly Stochastic RSI is currently 151 days in. This is basically the half way point + or - 1 month. The cycle is still intact as of this moment. Until a clear breakout we will continue our journey to the bottom.