#BTC
Bitcoin is still in a transitional phase and at critical technical juncture
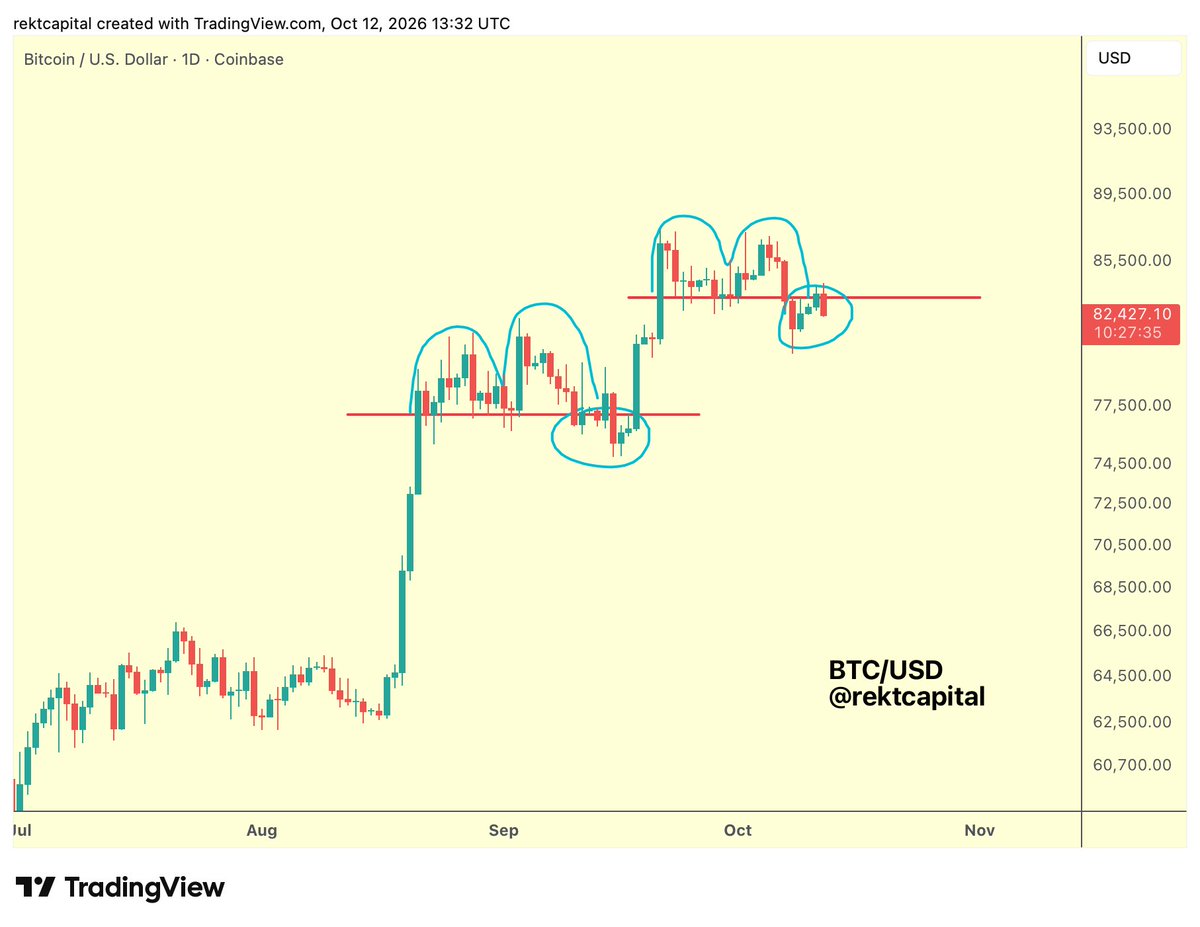
~$82500 is the deciding price point when it comes to where Bitcoin builds out its next market structure
$BTC #Bitcoin
#BTC
The Bitcoin EMA Crossover of the purple 50-week and green 21-week EMAs is getting closer and is likely due to occur over the next several weeks
But even after such Crossovers, Bitcoin would still have the capacity for a early-stage Bull Market pullback
In fact, in 2023 Bitcoin deviated below the two EMAs to form a pullback bottom (blue box) after the Crossover occurred (orange circle)
If history repeats, Bitcoin could deviate below the two EMAs once again in search of a pullback bottom
$BTC #Bitcoin
#BTC
Interestingly, the two EMAs (purple 50-week EMA & green 21-week EMA) are converging and slowly building confluence in the mid- to high $70,000s
Over time, this confluence will occur at higher prices given the dynamic nature of the EMAs
More, a Golden Cross is set to occur over the next several weeks
Historically, whenever a pullback has taken place into the two EMAs in early Bull Markets, the pullback bottom would not be too far off, especially whenever deviations below the EMAs would occur
After all, successful retesting of the two EMAs in new Bull Markets has sustained bullish momentum for price
$BTC #Bitcoin
#BTC
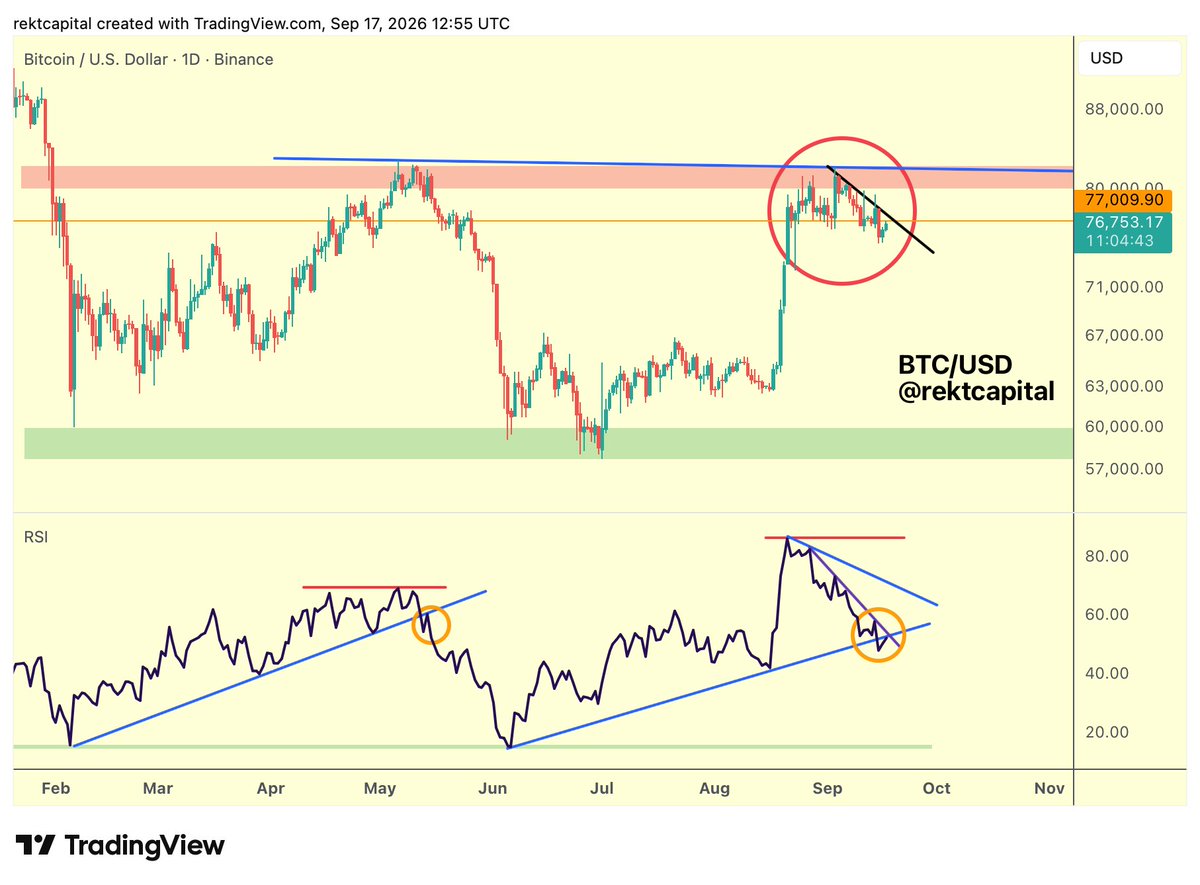
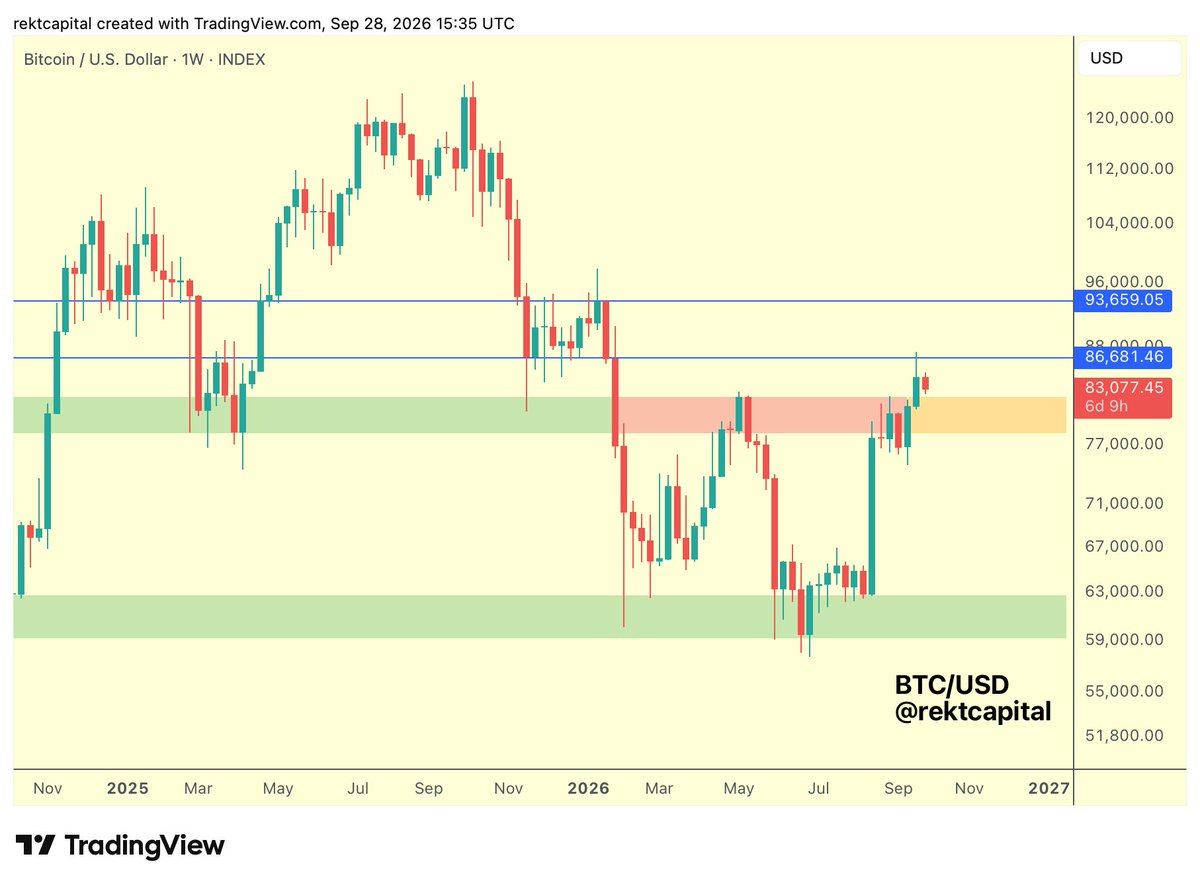
Bitcoin has Weekly Closed above the Range High resistance of the $60k-$80k Macro Range (green-orange)
As a result, Bitcoin will now be dipping into the Range High for a post-breakout retest in an effort to fully confirm the breakout
It is fair to say this current retest is a trend-defining one
Because it is the retest that will define whether Bitcoin is ready to fully exit its Bear Market Accumulation Range (i.e. $60-$80k) and rally into the next phase of its newfound Macro Uptrend
Or whether Bitcoin isn't quite ready for that breakout and has to instead revert back into the Macro Range for additional consolidation
The retest is soon to be in progress
$BTC #Bitcoin
The early-stage #BTC Bull Market Re-Accumulation Range in 2023 developed slightly above the 2022 inverse Head and Shoulders Accumulation Pattern
In this cycle, the ~$82500 level is the analogous level to the very top of the 2022 Accumulation Pattern
Turn $82500 into support -> Bitcoin would likely start building out its new ReAccumulation Range
Note: it's not yet clear where the top of that Range would be but its bottom would likely be $82500 or slightly above it (i.e. in 2023 it was slightly above the analogous level to $82500)
Fail to turn $82500 into support however and there’s a chance Bitcoin reverts back into the $60k - $80k Range and retraces within it
That intra-range pullback could take place in an effort to build out a Right Shoulder, if the intent is for Bitcoin to replicate an inverse Head and Shoulders Accumulation Pattern similar to 2022-2023 (and this is an assumption based on emerging market structure)
These are conditional scenarios based on $82500 as a technical level because it is the pivot point for the next phase in the cycle
Of course, if $82500 holds as support then the breakout from the ~$60k-$82500 Macro Range will be confirmed, obviously invalidating a reversion back into the Range
But for as long as $82500 fails to hold as support, that Right Shoulder to a potential inverse Head & Shoulders becomes quite compelling (there's a good chance that the Right Shoulder would be a little higher than the Left Shoulder, like in 2023)
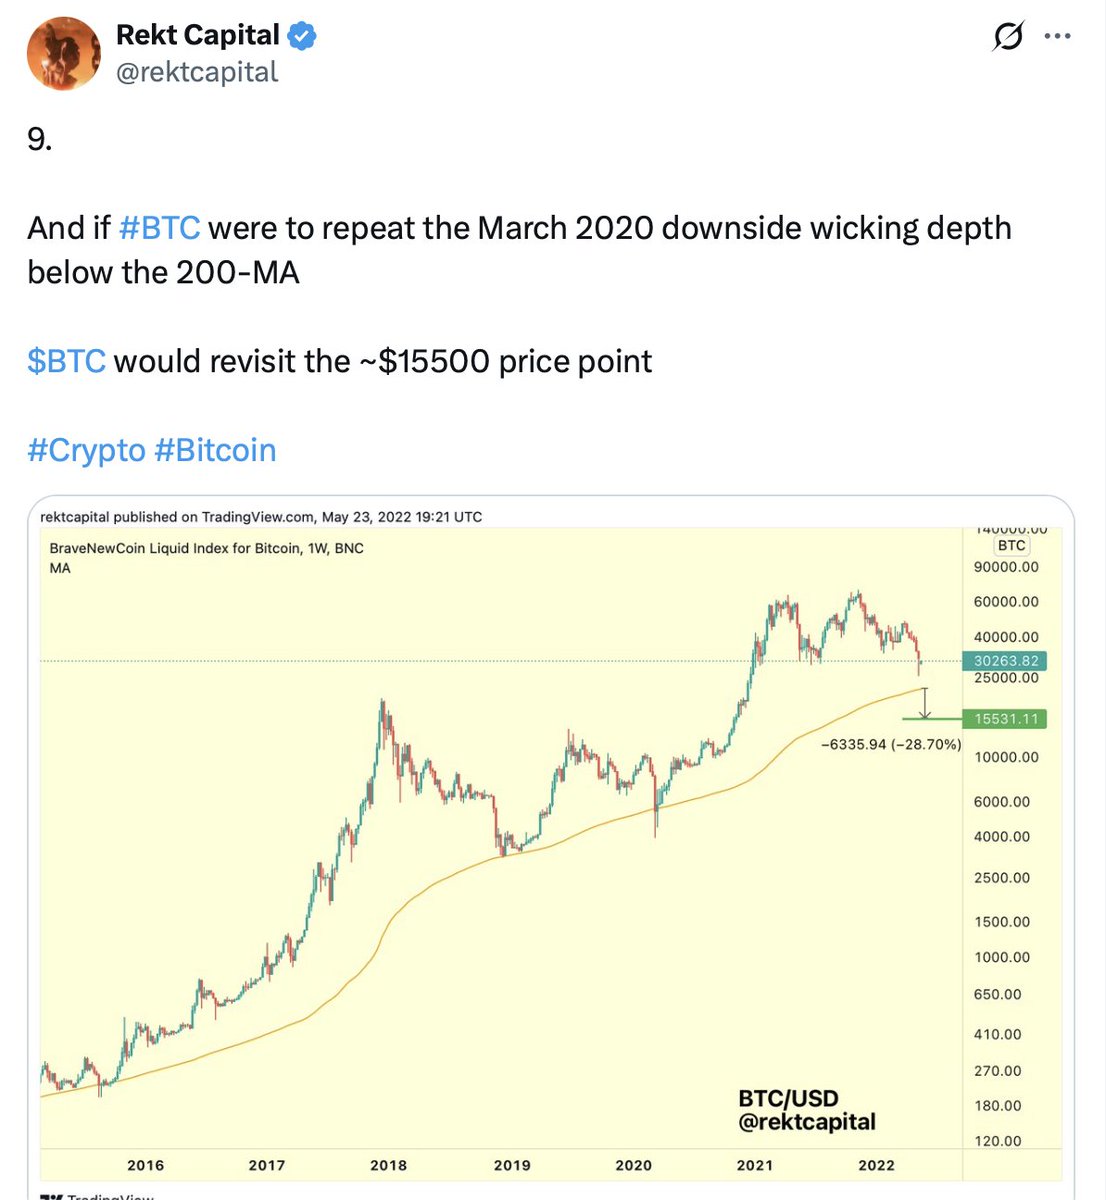
Attached are charts from the prior cycle where I clearly outlined the 2022 bottom at ~$15500 via downside deviations below the 200-week SMA (which kickstarted the Head of the inverse H&S in that cycle) and another couple of charts outlining the full development of the Right Shoulder and its bottom in 2023
Based on those charts and same guiding principles, the analogous levels are outlined in today's chart
What's interesting about a potential future Right Shoulder development is that it could coincide with a mid-term retest of the Macro Downtrend (black; we've only seen such a mid-term retest in 2015)
In sum:
Is Bitcoin entering a future Re-Accumulation Range? Or does price still have a chance at entertaining a low still within the Macro Accumulation Range?
Either Bitcoin transitions into a new Re-Accumulation Range by keeping $82500 as support...
Or we could see one final pullback in an early-stage Bull Cycle into what could be a Macro Higher Low
(Side note: equal lows would be compelling but are less likely, and Lower Lows admittedly are the low probability event, but not absolutely impossible should a Black Swan take place. And if a Black Swan takes place in Q4 and BTC drops to new lows, then it would resynchronise with the 4-Year Cycle. Again, low probability but not absolutely impossible)
Overall, Bitcoin is showing signs of macro trend transition and so if the transition into an early-stage Bull Market is indeed occurring, then the main trend will of course be upside for the next few years
But in saying that, it's always wise to strategise ways on how price could perform a Bull Market pullback, especially whenever price is at key technical junctures like ~$82500
$BTC #Bitcoin
#BTC
Each time Bitcoin turned ~$93k into new support, price would rally to at least ~$109k
In saying that, I'd be surprised for $93k to get retested into new support this year
Reason being is that ~$93k is this cycle's major Four Year Cycle resistance and so revisiting it is a technical feat that has historically taken place in a Pre-Halving year
But - stranger things have happened, and they have happened very recently:
Since the Macro Downtrend breach, Bitcoin looks to have pretty much confirmed its Bear Market Bottom 33% quicker by standards of history
And this earlier bottom has in large part influenced Bitcoin breaking its Macro Downtrend almost 600 days ahead of its usual schedule
Which historical price principle is Bitcoin going to invalidate next?
$BTC #Bitcoin
#BTC
Bitcoin is finding resistance at ~$86700 but nothing too convincing for the time being
For bullish continuation and to avoid reverting back into the $60k-$80k Range, Bitcoin would need to stay above or at minimum successfully retest ~$82k on any future dip
$BTC #Bitcoin
In #BTC Bull Markets you’re always one -10% to -30% pullback away from a great entry
And if such a retrace were to occur in the near future then there’s a good chance Bitcoin would revisit prices not very, very far away from the $58k lows
You don’t have to buy the absolute lows to do well in a Bitcoin Bull Market
After all, the very few who manage to buy the absolute lows may also mistime the Bull Market top and sell too early
The aim is to capture the majority of the trend and the key going forward will be to buy on any deeper future pullbacks
$BTC #Bitcoin
Strategy has acquired 950 $BTC and repurchased $174M of $STRC. As of 9/20/26, we hold 846,000 BTC and $6.09B of USD Assets. $MSTR https://t.co/hP4yLlKlOE
#BTC
The reality is that if Bitcoin has already bottomed in its Bear Market but price fails to breakout from its current $60000-$80000 Range...
Then that will simply mean that this $60000-$80000 is the Macro Accumulation Range ahead of the next Bitcoin Bull Cycle
bitcoin:native #Bitcoin
#BTC
Bitcoin has officially Monthly Closed beneath the Macro Downtrend for August
However, given that this Macro Trendline is a dynamic resistance, by virtue of the passing of time price has moved beyond the Downtrend
More, price has Monthly Closed above the April/May 2026 candle-bodied highs, which are now perfectly confluent with the Macro Downtrend
Bitcoin now has a chance to post-breakout retest both the Macro Downtrend and these April/May Monthly highs in an effort to turn them into new support
bitcoin:native #Bitcoin
#BTC
Back in May 2026, Bitcoin indeed rejected from $82.5k, falling short of the green 21-Month EMA resistance
As anticipated, Bitcoin rejected from here, broke down from the purple 50-Month EMA and enter Bearish Acceleration over time (see post below)
And now months later, Bitcoin is back at these very same levels, once again
Break the Downtrend and Bitcoin will confirm entry into a new technical Macro Uptrend
Reject from here however and price will maintain its series of Lower Highs
History suggests there's still time for price to continue its Downtrend
Even though understandably it's tempting to throw long-standing Bitcoin price principles out the window, especially after such an impressive move like this
But as long as price continues to print Lower Highs, then this move could be rendered as a Relief Rally
Overall, the Macro Downtrend is the line in the sand
$BTC #Crypto #Bitcoin
#BTC
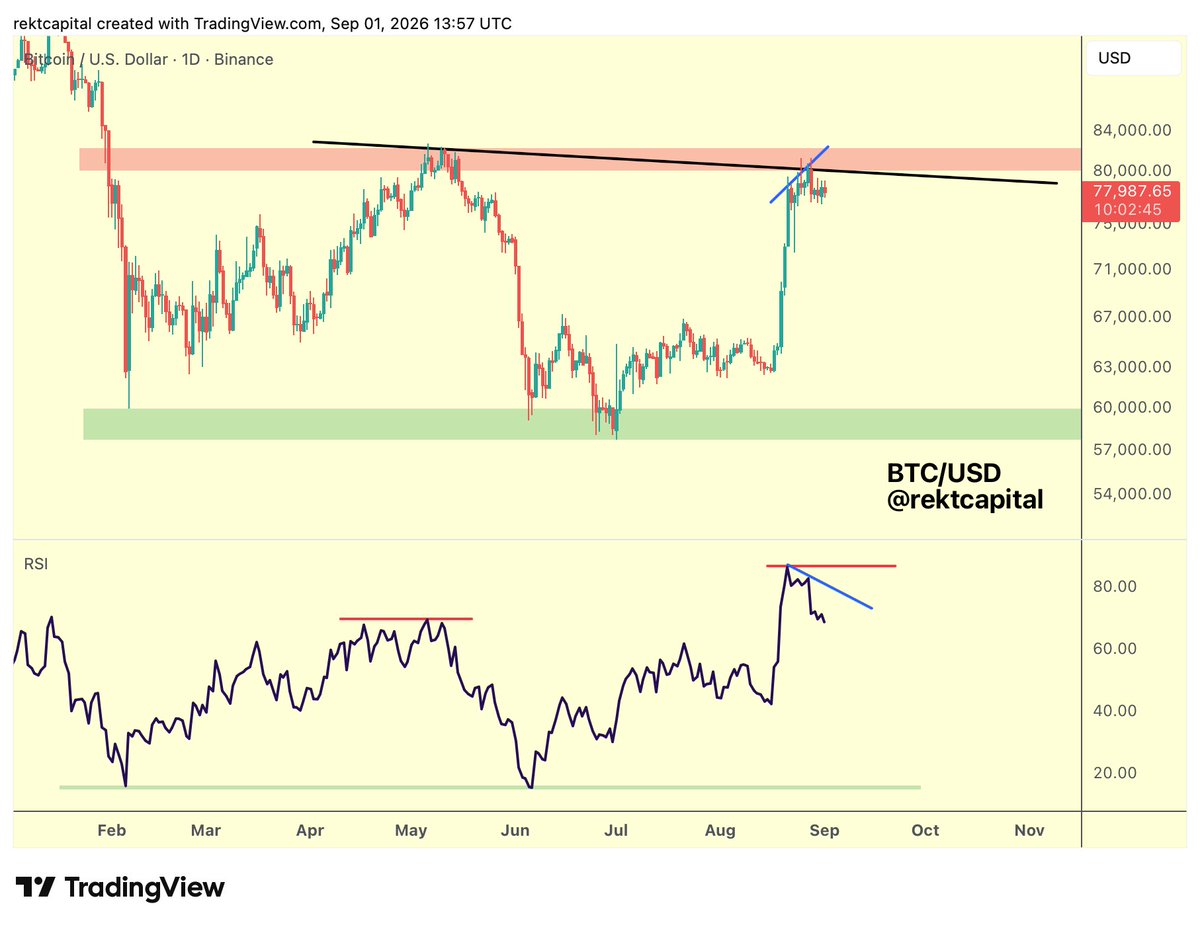
Bitcoin continues into what is becoming an overextended rally, approaching major confluent resistance
The next few weeks will be crucial
For bull bias to be maintained, quite simply Bitcoin needs to keep its highs and build a Re-Accumulation Range
Which would be the opposite to what Bitcoin has done on previous fake-breakouts from price clusters (orange)
Over the next crucial weeks, Bitcoin will need to avoid giving back all these gains like on previous overextensions out from these price clusters
Bear Market Rallies haven't been able to persist at new local highs post-fake-breakout
Time will verify newfound strength or lack thereof
$BTC #Bitcoin