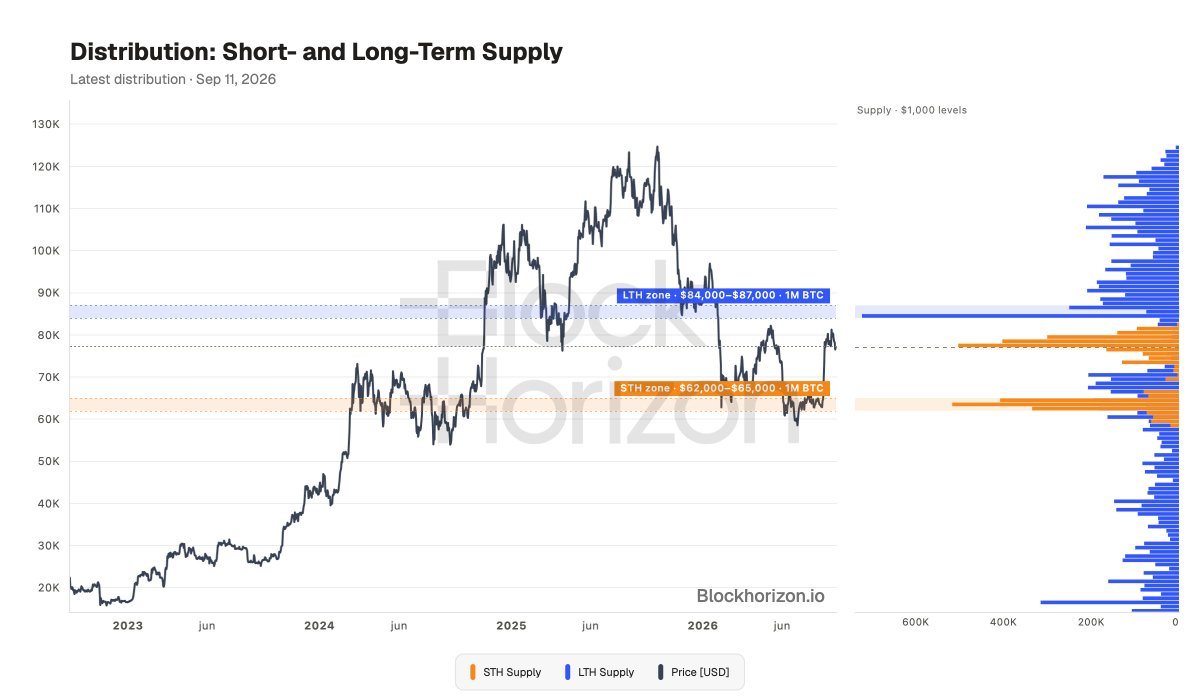
3 new distribution charts are live on BlockHorizon, public and free for everyone:
▸ Short- and Long-Term Supply
▸ Overhead Supply
▸ Cost Basis Percentiles
Where BTC supply sits by cost basis, how much is above spot, and what share is in profit.
We keep upgrading the platform 💪
@100trillionUSD For anyone digging deeper: compare this with earlier dates in the interactive chart. You can follow how the distribution developed into the setup we see today.
@100trillionUSD The interesting part now is whether those wall grow, shrink, or shift before price reaches them.
Plenty to watch beyond the breakout itself 👀
@jerrywendell_ @100trillionUSD Server load is still low with already a couple of thousand users now. We can't see load/cost getting anywhere near material until 100k+ users.
@Changehero_io@100trillionUSD When you sign in you can change all charts on your dashboard. Not signed in you see the most popular charts (and yes S2F is still popular).
🚨 5 new Bitcoin charts are now live on BlockHorizon, all completely free:
• Cost Basis Heatmap
• Realized Cap HODL Waves
• Coin Vintages
• HODL Waves
• Cushion Depth Fan
Bitcoin back at $64k
ABOVE realized price ($53k) — 1,271 days, the longest streak ever
BELOW STH cost basis ($69k) ... the ceiling
ALL previous bear markets bottomed BELOW realized price. This one hasn't even touched it.
New low incoming, or different this time?👇
For the first time this cycle, the MAJORITY of coins are underwater. The profit/loss line just flipped to loss-majority.
Historically, when ≤50% of $BTC supply is in profit (n=1,014 days):
Forward 365d median return: +94.2%
We're there now at 47.15%.
Not a confirmed bottom - prior cycle lows went to 36-44.5% - but this is the zone buyers get paid from.🟢