Welcome to the NEM Breakout of the Month Club. The rule is to buy the "next month" just out of the money call option upon any short-term breakout in Newmont Mining. Year-to-date these signals have come about monthly and have been good for between 10% to 15% share price appreciation in NEM, into next month option expiration. That equates to at least a 100% gain in the underlying calls and occasionally a spectacular 3X to 5X return. Wash, rinse, repeat. You're only job: EXECUTE.
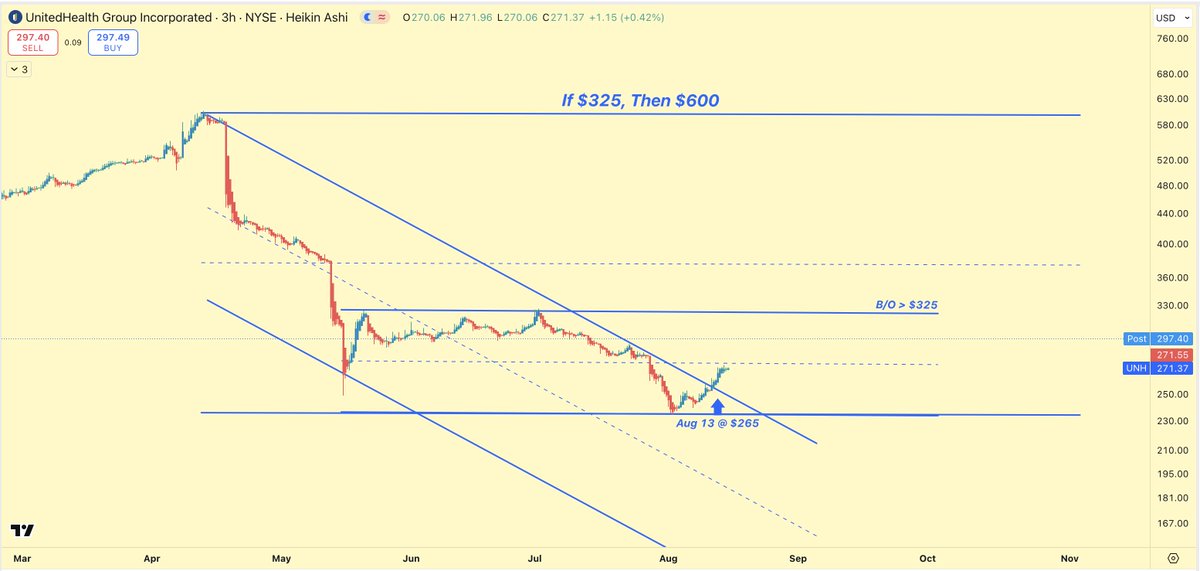
The real move will after the BRK dust settles. Dec OTM calls - but only if share price closes above $325. Pattern recognition - Parallel Channels - Breakouts - Fractals - OTM Options, with lots of time.
Our $ETHA Sep calls are up over 300% in less than a month. Ethereum running higher is just our latest example of the power of third waves at multiple degrees of trend. This is the second Elliott Wave based price pattern that is determinative in our trading, the first being our main squeeze, the all knowing, all powerful, Wave 5 price set-ups, worth the price of admission, in and of itself.
At our target price of ETHA $50, these calls will be worth $20, up over 10X from our July 17th entry. The only real question is whether its seen by Sep 19th or if we will have to roll into October. Stay tuned.
At https://t.co/ZY3CROuptF we trade stocks and crypto via options, because price patterns, reflective of marketplace psychology, repeat, no matter what the underlying tradable, while the inherent leverage of options is simply icing on the cake.
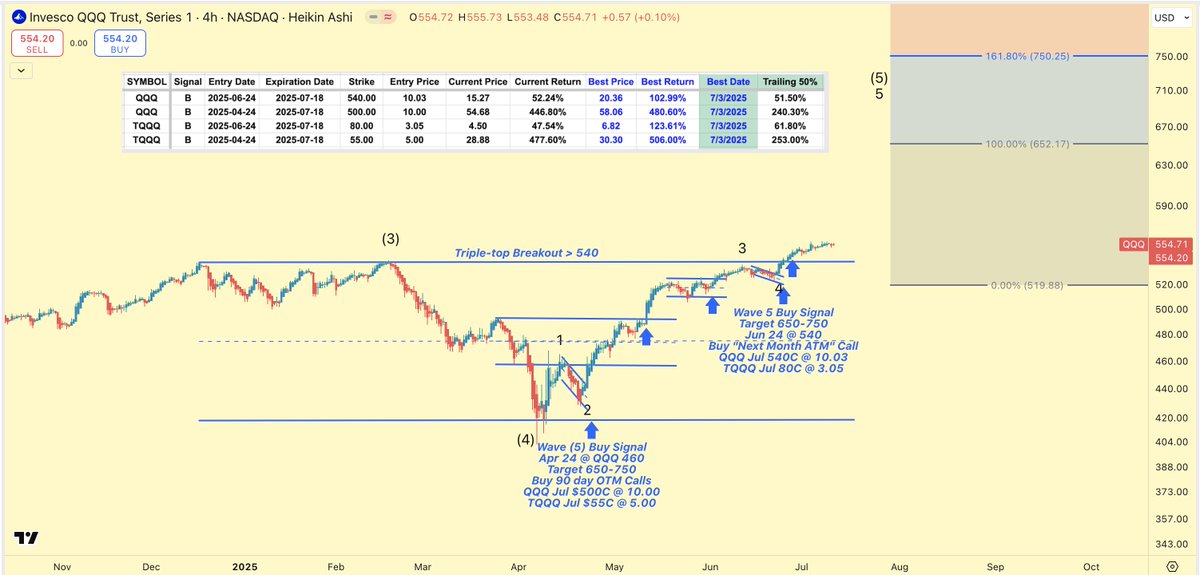
Wave 5 Trading Signals: QQQ
Learn all about them here: https://t.co/wdRVwliv0l
More about us and/or subscribe to our trading signals here: (Use sign-up code GOPRO@50% for nice surprise)
https://t.co/lg5SeHbWHI
Our Motto & Brand: "Find something that works, then trade it."
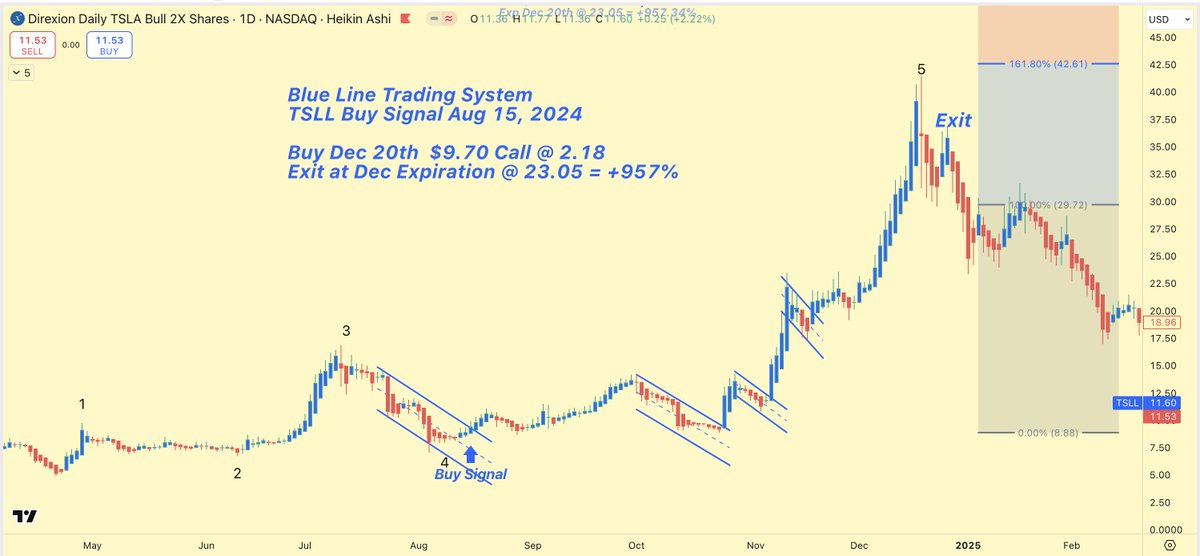
Option Traders: Our top trade of 2024: We turned $2.18 into $23.05 with TSLL Calls (+957%)! Our most recent trade: ORCL calls +154% since Jun 30th. 47 yrs of option trading, publishing real time trades since 2010, 139% avg. return since Jan 2024. Get Premium alerts for $49.50 (50% OFF) with sign-up code: GOPRO@50% – ends Sunday, midnight, my time, not yours!
Join: https://t.co/AHVQY6UBJ8
ORCL - Update
https://t.co/yEq76bgHow
PRO Service Update
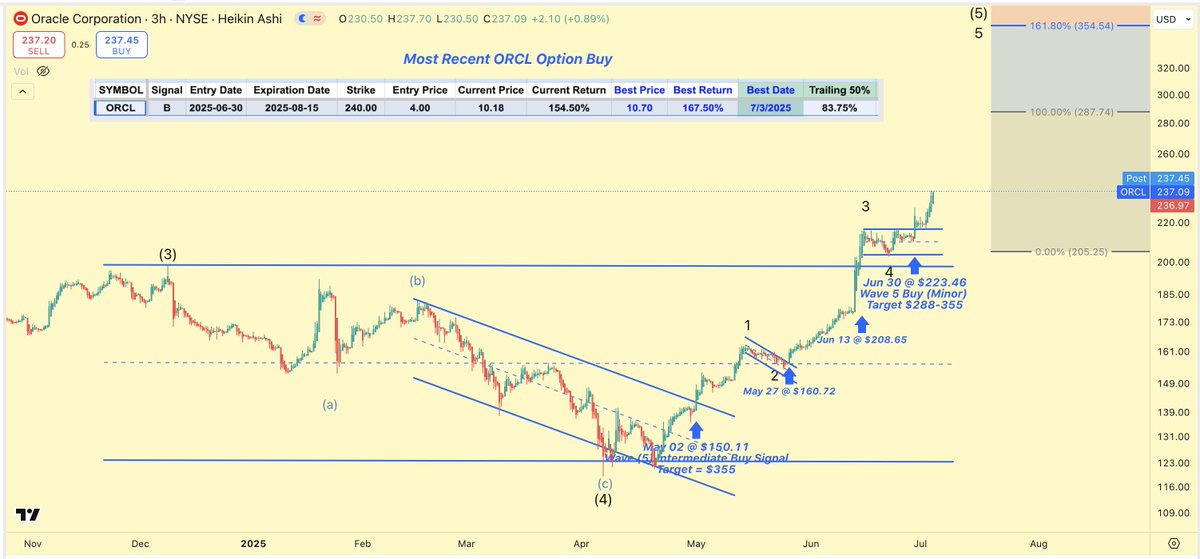
ORCL was a, "New Pick," in the PRO Service on Jun 30th @ $224, now trading just three days later as high as $235 with the recommended calls up over 100%. Accordingly, the stop is now a 50% trailing stop as per our trade management rules. Historically, runs like this right out of the gate bode well for trades.
Longer-term, our Wave 5 target calls for significantly higher prices in to the 3rd and 4th quarter of 2025. If the trailing stop gets hit, exit, but be ready to jump back in on a fresh breakout.
Note: Four bona fide breakouts since May 2, 2025, with two of them qualifying as Wave 5 Break-outs, one an Intermediate Term Wave (5) and the second an Minor Wave 5, which triggered this trade on Monday.
https://t.co/yEq76bgHow
$TSLA $TSLL
The Buy Signals on this twelve-month chart of $TSLA, are all basis our Volatility Breakout System and modified, dummied down version of the Elliott Wave theory. Key takeaway is a single pattern, what I refer to as my "Wave 5 Buy Signal" which is a misnomer insofar as although they all start out looking as Wave 5's half turn out to be Wave 3's and some, Wave 3 of 3's. But this isn't about Elliott Wave theory, this is about capturing massive option gains in TSLA, however it can be done. The most recent signal was generated as TSLA broke above its intermediate term trend channel coming down from the Dec 2024 all time high while simultaneously breaking out out above the horizontal trend channel spanning March-April, 2025. I've annotated the chart with my tentative EW count, a series of Waves 1-2 that portend a move not only above the Dec 2024 all time high @ 488.50, but to levels well above. My time line is by 4th quarter, 2025, but knowing TSLA's history, it could reach those levels by Labor Day. A protective stop can be used either via money management, or a $TSLA close under $300...but that's another post altogether.
$TSLA $TSLL
There are five Buy Signals on this six-month chart of $TSLA, four of which were massive winners vis a vis call options. Key takeaway is a single pattern, what I refer to as my "Wave 5 Buy Signal" which is a misnomer insofar as although they all start out looking as Wave 5's half turn out to be Wave 3's and some, Wave 3 of 3's. But this isn't about Elliott Wave theory, this is about capturing massive option gains in TSLA, however it can be done. The most recent signal was generated as TSLA broke above its intermediate term trend channel coming down from the Dec 2024 all time high while simultaneously breaking out out above the horizontal trend channel spanning March-April, 2025. I've annotated the chart with my tentative EW count, a series of Waves 1-2 that portend a move not only above the Dec 2024 all time high @ 488.50, but to levels well above. My time line is by 4th quarter, 2025, but knowing TSLA's history, it could reach those levels by Labor Day. A protective stop can be used either via money management, or a $TSLA close under $300...but that's another post altogether.
$TSLA $TSLL
There are five Buy Signals on this six-month chart of $TSLA, four of which were massive winners vis a vis call options. Key takeaway is a single pattern, what I refer to as my "Wave 5 Buy Signal" which is a misnomer insofar as although they all start out looking as Wave 5's half turn out to be Wave 3's and some, Wave 3 of 3's. But this isn't about Elliott Wave theory, this is about capturing massive option gains in TSLA, however it can be done. The most recent signal was generated as TSLA broke above its intermediate term trend channel coming down from the Dec 2024 all time high while simultaneously breaking out out above the horizontal trend channel spanning March-April, 2025. I've annotated the chart with my tentative EW count, a series of Waves 1-2 that portend a move not only above the Dec 2024 all time high @ 488.50, but to levels well above. My time line is by 4th quarter, 2025, but knowing TSLA's history, it could reach those levels by Labor Day. A protective stop can be used either via money management, or a $TSLA close under $300...but that's another post altogether.
#QQQ#optiontrading#VolatilityBreakouts
https://t.co/jFZ3X8wtLD
I fed this QQQ 180 Minute chart into Elon Musk's artificial intelligence engine, "Grok," which commented, in part, as follows:
"Fibonacci Extensions for Waves 3 and 5
Your use of Fibonacci extensions is spot-on for a bearish wave count:
Wave (3): You’ve marked Wave (3) as reaching 387.84, which corresponds to the 161.8% Fibonacci extension of Wave (1) projected downward from the Wave (2) high. This is a common target for Wave (3), as it’s often the longest wave in an impulse sequence. The price hitting this level supports the validity of your count.
Wave (5): You’ve projected Wave (5) to reach 333.32, based on the 261.8% Fibonacci extension. This is calculated by taking the length of Wave (1) to Wave (3) and projecting it downward from the Wave (4) high of 425.90. The 261.8% extension is a typical target for Wave (5), especially in a strong trending move, so this target is reasonable."