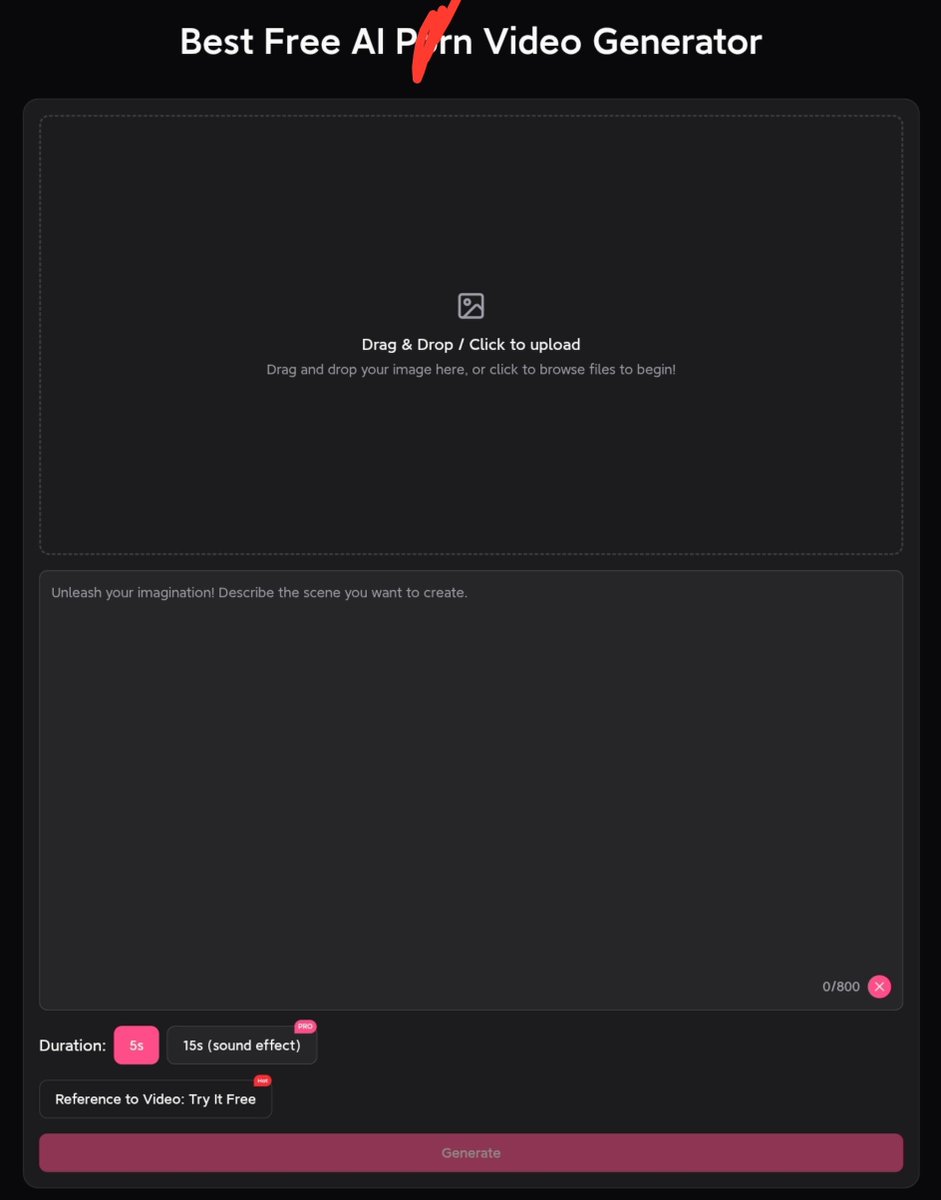
FOUND A FREE AI IMAGE-TO-VIDEO TOOL FOR ADULT CONTENT
https://t.co/D8ND9v1cdp
you can:
• upload an image
• describe the motion with a prompt
• generate an AI video
• download without a watermark
HOW TO USE:
1. upload your image
2. write a motion prompt
3. hit Generate
4. download the result
⚠️ 18+ only
only use fictional adult characters or images you have permission to use
try it: https://t.co/D8ND9v1cdp
Do you want TradingView charts for free? Their lite weight charts are open source.
https://t.co/PEXIjWYM8B
Give that to @OpenAI or @claudeai with this prompt; “You are a senior quant-platform engineer and graphics engineer.
Build an open-source, production-quality trading charting platform using open-source libraries. Do NOT use TradingView Advanced Charts, proprietary chart SDKs, embedded TradingView widgets, or paid charting components.
Use these as building blocks/reference implementations where useful:
- TradingView Lightweight Charts:
https://t.co/PEXIjWYM8B
- PixiJS:
https://t.co/9rUDbw7aOJ
- uPlot:
https://t.co/x3vTva9Clr
- Apache ECharts:
https://t.co/mJuK9ZP6Le
PRIMARY GOAL
Create a modular trading-chart engine that can eventually support a TradingView-style charting experience while allowing any market-data provider to be plugged in.
Do not make a demo. Build the foundation of a real charting product.
CORE CHART
Implement:
- Candlestick, bar, line, area, and Heikin-Ashi charts
- Volume
- Multiple synchronized panes
- Multiple price scales
- Timeframe switching
- Symbol switching
- Smooth mouse/touch pan and zoom
- Crosshair synchronized across panes
- Price/time tooltips
- Autoscaling
- Logarithmic and percentage scales
- Extended-hours sessions
- Session breaks
- Real-time candle updates
- Historical pagination when scrolling backward
- Efficient handling of hundreds of thousands of bars
INDICATOR ENGINE
Create an indicator architecture separate from the renderer.
Include initially:
- SMA
- EMA
- VWAP
- RSI
- MACD
- Bollinger Bands
- ATR
- Volume Profile
Indicators must be dynamically added/removed and able to render either over the price chart or in independent panes.
Design the API so community-created indicators can eventually be loaded as plugins.
DRAWING ENGINE
Implement an independent drawing-object system supporting:
- Trend line
- Horizontal line
- Vertical line
- Ray
- Rectangle
- Price range
- Date range
- Fibonacci retracement
- Parallel channel
Every drawing must support:
- Selection
- Dragging
- Resizing
- Deleting
- Style properties
- Serialization
- Restoration
- Undo/redo
Do not tightly couple drawings to Lightweight Charts internals.
DATA ARCHITECTURE
Do NOT hard-code a market-data provider.
Create interfaces such as:
- MarketDataProvider
- HistoricalBarsProvider
- RealtimeTradesProvider
- RealtimeQuotesProvider
Support normalized events such as:
- Trade
- Quote
- Bar
A market-data provider should be replaceable without changing the charting system.
Build a WebSocket ingestion layer capable of batching high-frequency updates before sending them to the renderer.
PERFORMANCE
Treat performance as a first-class requirement.
Use where appropriate:
- Canvas/WebGL/WebGPU
- Typed arrays
- Object pooling
- requestAnimationFrame batching
- Incremental calculations
- Web Workers for expensive indicators
- Viewport-based rendering
- Intelligent downsampling
Avoid rerendering React/Angular components on every market tick.
The architecture should remain responsive with large historical datasets and high-frequency real-time updates.
UI
Keep the interface minimal and professional.
Desktop-first layout:
Top:
- Symbol search
- Timeframe controls
- Chart type
- Indicators
Left:
- Drawing toolbar
Center:
- Main chart
Right:
- Optional watchlist/details panel
Bottom:
- Optional indicator panes
Use a dark neutral appearance.
Do not waste time building a marketing interface.
Focus on the charting engine.
ARCHITECTURE
Split the project into clear packages/modules such as:
- chart-core
- chart-renderer
- data-engine
- indicator-engine
- drawing-engine
- provider-sdk
- ui
Keep the core engine framework-agnostic wherever practical.
DELIVERABLES
Produce:
1. A working application.
2. Complete source code.
3. README explaining the architecture.
4. Data-provider interface documentation.
5. Indicator plugin documentation.
تغيّرات TradingView الأخيرة تستحق التوقف عندها قليلًا 👀
TradingView ما زالت من أقوى منصات التحليل الفني، لكن التغييرات الأخيرة المتعلقة بناشري المؤشرات المدفوعة Invite-Only تجعل البحث عن البدائل أمرًا يستحق الاهتمام.
وفق شروط TradingView الحالية:
عند تجاوز 100 مستخدم نشط لمؤشرات Invite-Only، تُفرض على الناشر رسوم تقنية قدرها:
💰 29.95 دولارًا شهريًا
عن كل مستخدم نشط.
وهنا تبدأ الأرقام تصبح كبيرة جدًا مع زيادة عدد المستخدمين.
لذلك بدأت أبحث بشكل جدي عن البدائل، ليس بهدف ترك TradingView لمجرد التغيير، وإنما لمعرفة إلى أين وصلت المنصات المنافسة.
والحقيقة أن بعض البدائل تطورت كثيرًا 👇
📊 Order Flow
🟩 Footprint
🔥 Heatmap
📚 DOM
🧪 Backtesting
🔎 Screener
🔔 Alerts
🤖 AI & MCP
واللافت أيضًا أن بعض المنصات بدأت تتقدم في جانب البرمجة والذكاء الاصطناعي.
TakeProfit مثلًا لديها لغة Indie المبنية بأسلوب قريب من Python، وتدعم MCP للمساعدة في نقل وتطوير أكواد Pine Script.
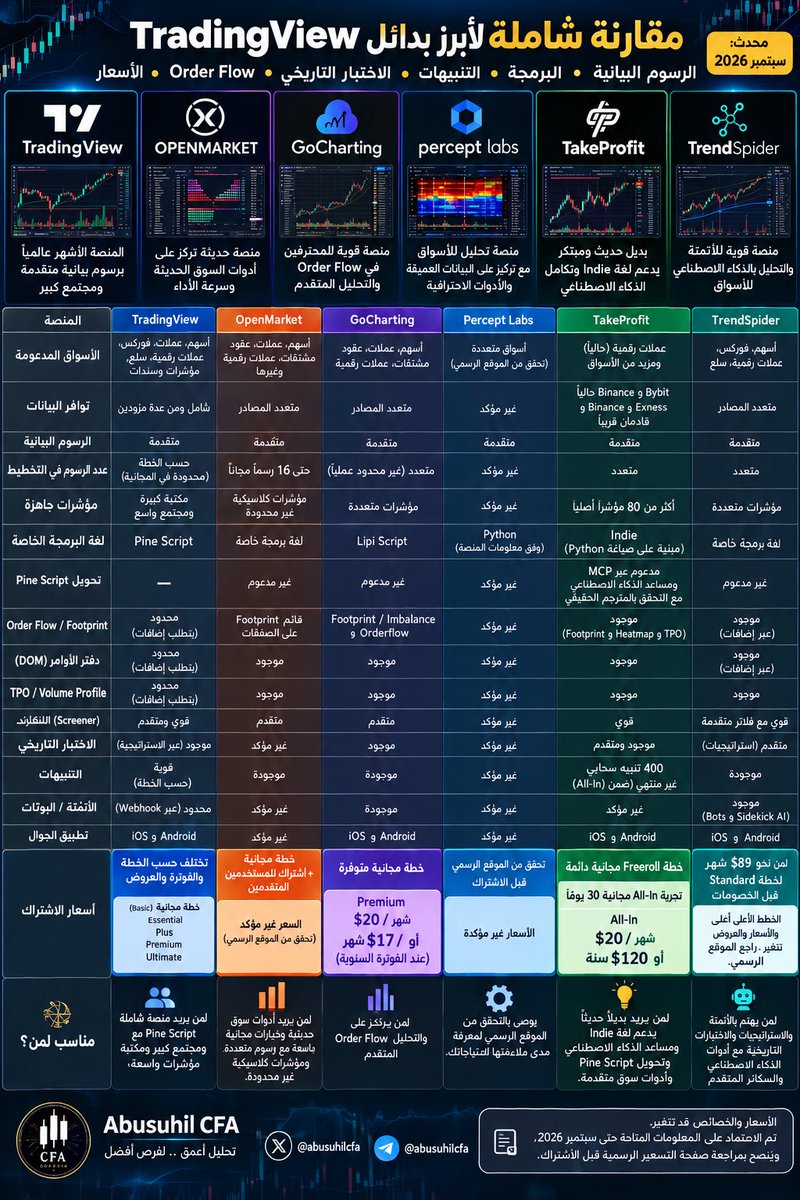
لذلك جمعت في الصورة المرفقة مقارنة بين عدد من أبرز البدائل:
• TakeProfit
• GoCharting
• TrendSpider
• OpenMarket
• Percept Labs
لا أقول إن البديل أصبح أفضل من TradingView في كل شيء…
لكن المنافسة أصبحت أقوى، وأعتقد أن الوقت مناسب لتجربة هذه المنصات ومعرفة ما يناسب احتياج كل مستخدم.
وفي النهاية…
المنافسة دائمًا في مصلحة المستخدم. 👍
من له تجربة مع احد المنصات البديلة يعرضها مشكورا.
#TradingView
#TakeProfit
#GoCharting
#TrendSpider
#OpenMarket
#PerceptLabs
#PineScript
#OrderFlow
#Footprint
#Trading
#TechnicalAnalysis
#التداول
#التحليل_الفني
TradingView keeps adding limits. We remove them.
Open a free https://t.co/C4sV8EHPU4 account and get:
→ Unlimited charts & widgets
→ Custom indicators & strategies
→ Tick charts
→ TPO & Volume Footprint
→ Liquidity heatmaps
→ Custom timeframes
→ Trading directly from your charts
→ Ad free experience
And instead of taking more money when you trade:
We give you up to 50% of your trading fees back in cash.
A trading platform should help traders make more money, not charge them more every year.
🚨 THIS IS HOW THE S&P 500 WILL CRASH
The Fed is about to hike rates again.
Oil is above $100.
The S&P 500 has stopped growing.
And Anthropic is preparing to go public at a $2 TRILLION valuation and raise $100 BILLION.
Now ask yourself one question:
WHERE DOES THAT $100 BILLION COME FROM?
Funds need cash. Institutions need allocation.
And the easiest place to get it is from the same stocks they are already massively overweight:
Nvidia. Microsoft. Google. Amazon. Meta.
The exact companies holding the S&P 500 near all-time highs.
The Mag 7 already controls more than 34% of the entire index.
Without AI, this market would already look completely different.
Now Wall Street is preparing to pull liquidity OUT of the companies keeping it alive.
THE STOCKS HOLDING UP THE MARKET ARE ABOUT TO BECOME THE SOURCE OF LIQUIDITY FOR ANTHROPIC.
And here is the part almost nobody understands:
Anthropic will NOT immediately enter the S&P 500.
So institutions can sell S&P holdings to fund the IPO...
But passive S&P money does NOT automatically flow back into Anthropic.
That creates a liquidity vacuum:
MAG 7 → SELLING
ANTHROPIC → BUYING
S&P 500 → LOSING ITS SUPPORT
AND PUBLIC MARKET LIQUIDITY BECOMES EXIT LIQUIDITY FOR PRIVATE INSIDERS.
We’ve seen this before.
- 1972: Nifty Fifty.
- 2000: Dot-com IPO mania.
- 2021: SPACs. Coinbase. Robinhood. Rivian.
Now it’s Anthropic:
- $2 TRILLION valuation.
- $100 BILLION raise.
Retail thought they were buying the future.
They were buying near the end of the liquidity cycle.
And that’s exactly where the next real buying opportunity appears.
I’m not afraid of the dump.
I’M WAITING FOR IT.
Remember, I’ve been trading markets for over 15 years.
When the liquidation starts and I see the level worth buying, I’ll post it here publicly like I always do.
Turn notifications on.
If you’re not following yet, you’ll understand why that was a mistake later.
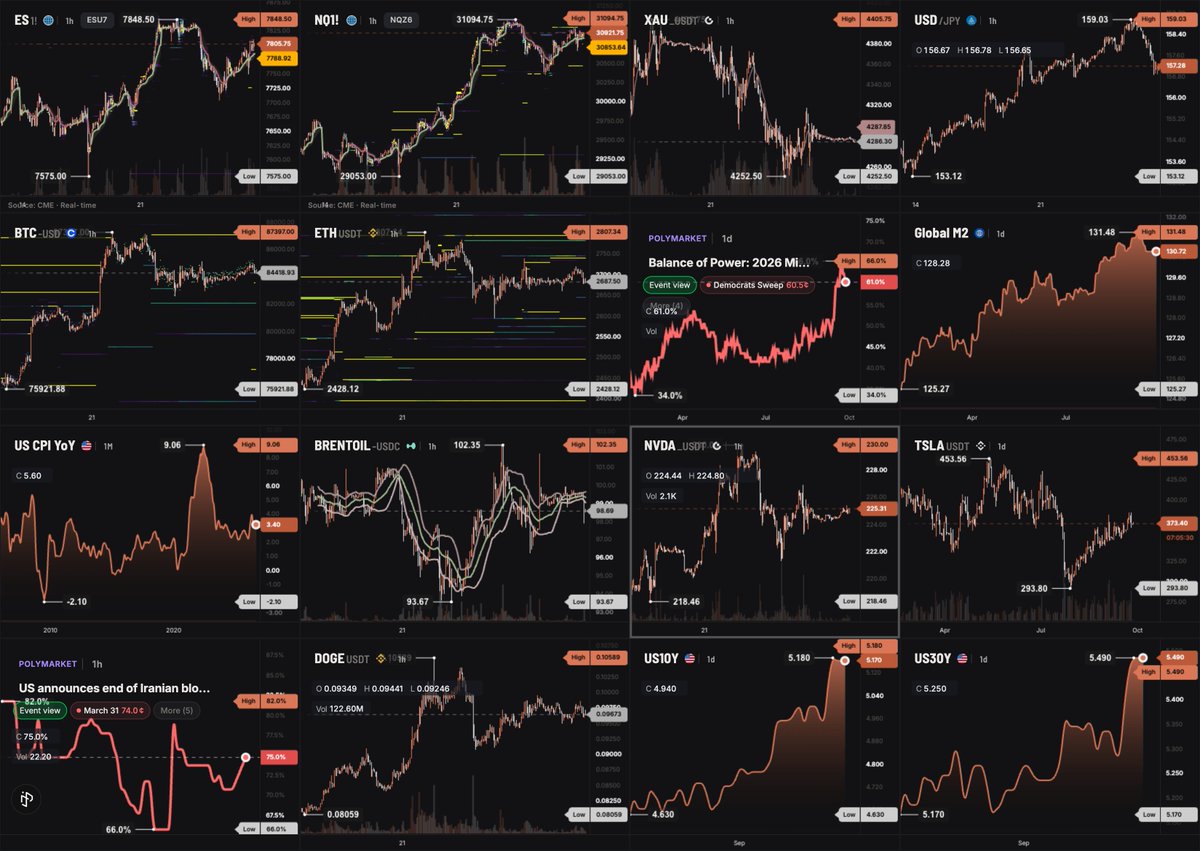
TradingView charges $2,399 a year to plot 16 charts on one screen.
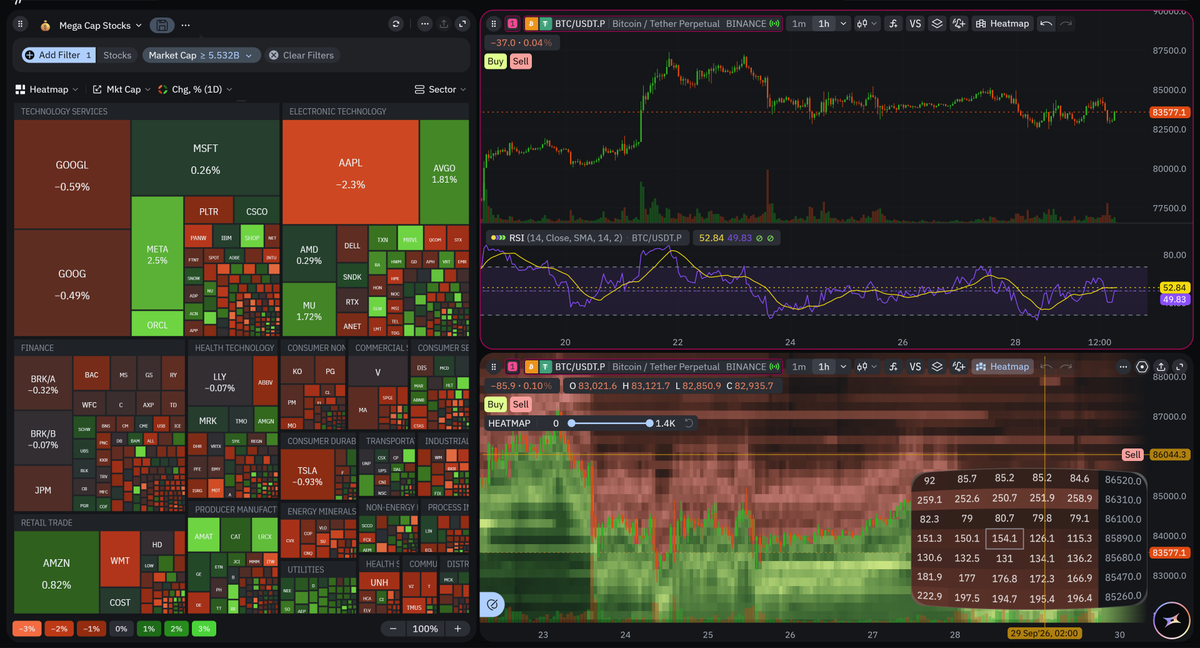
Starting today, you can do the same for free on OpenMarket.
Everyone now gets:
→ up to 16 charts per layout, any grid from 1x1 to 4x4
→ no limit on classic indicators: RSI, MACD, moving averages, Bollinger and more
→ 5,000+ economic series from 200+ countries and 50+ central banks
And beyond candles: footprints from every trade, not estimates, and live order book heatmaps from real depth, on crypto, CME futures and more.
Every market, one terminal:
• US stocks and tokenized stocks
• Crypto
• CME futures
• Forex, commodities, indices
• Prediction markets
• Macro: CPI, GDP, rates, M2 for 200+ countries
https://t.co/U91agdMf58
Coin almadan önce mutlaka bilmeniz gereken siteler ve araçlar.
Kaydedin lazım olur.
Chainspect: Zincirlerin gerçek işlem hızı
Scam Sniffer: Oltalama sitelerini yakalar
CryptoQuant: Borsalara giren ve çıkan coin miktarı
Jumper: Zincirler arası en ucuz köprü yolunu bulur
Laevitas: Opsiyon verisi, büyük para hangi seviyeye bahis yapmış
Zapper: Cüzdanın bütün pozisyonları tek ekranda
TokenUnlocks: Hangi coinde ne zaman kilit açılıyor
TradingLite: Emir defteri ısı haritası, alım satım duvarları
BitcoinTreasuries: Hangi şirket kaç Bitcoin tutuyor
Artemis: Zincirlerin kullanıcı ve işlem sayısı
Whale Alert: Büyük transferlerin anlık bildirimi
Checkonchain: Bitcoin döngüsünün hangi aşamasında olduğumuz
Pocket Universe: İmzalamadan önce işlemin sonucunu simüle eder
DropsTab: Açılacak miktarın piyasa değerine oranı
Santiment: Sosyal ve zincir verisi yan yana
Velo Data: Vadeli piyasa verisi ve borsalar arası fark
Earnifi: Unuttuğun airdropları tarar
L2Beat: Layer 2’ler gerçekten merkeziyetsiz mi
Breadcrumbs: Paranın nereden nereye gittiği görsel harita
Bitbo: Tek sayfada onlarca Bitcoin göstergesi
Blockaid: Zararlı işlem uyarısı verir
DefiLlama: Her protokolün kilitli parası ve zincir karşılaştırması
Kingfisher: Likidasyon ısı haritası, büyük tasfiye nerede olacak
Koinly: Vergi raporu hazırlar
Ultrasound money: Ethereum arzı ve yakılan miktar
Hyblock Capital: Kaldıraçlı pozisyonların yığıldığı fiyat seviyeleri
Rotki: Açık kaynak portföy takibi, veri kendi bilgisayarında kalır
Farside Investors: ETF’lere günlük giren ve çıkan para
MetaSleuth: Çalınan fonun izini sürme
Exocharts: Her mumun içinde alıcı mı satıcı mı baskın, tek tek gösterir
Layer3: Airdrop görevleri tek yerde
Mempool space: Ağ yoğunluğu ve gerçek işlem ücreti
Token Terminal: Protokoller gerçekte ne kadar gelir üretiyor
Revokecash: Cüzdanına verdiğin token izinlerini iptal et
SoSoValue: ETF akışı ve kurumsal talep takibi
Flipside Crypto: Kendi sorgunu yazıp ham veri çekme
Coinglass: Likidasyon haritası ve fonlama oranı, kimin patlayacağını önceden gösterir
IntoTheBlock: Hangi fiyattan kaç kişi almış, kim zararda
Tokenomist: Vesting takvimi ve dağılım oranları
Wallet Guard: Tarayıcı tarafında cüzdan koruma
Woocharts: Döngü göstergeleri ve tarihsel karşılaştırma
Honeypotis: Alabildiğin ama satamadığın tokenları tespit eder
Growthepie: L2 maliyet ve kullanıcı karşılaştırması
Aggr trade: Bütün borsaların canlı işlem akışı tek ekranda
CryptoRank: Unlock, fon turları ve yatırımcı listesi
Glassnode: Uzun vadeli tutucular satıyor mu, biriktiriyor mu
Vybe Network: Solana zincir analitiği
Chainabuse: Bu adres daha önce dolandırıcılık raporu almış mı
TradingView ha añadido IA y la cobra a 7,50 $ al mes.
No seas primo, aqui te comparto una MCP de código abierto de @Tradesdontlie. Es GRATIS, guárdalo !
https://t.co/JovyDjtN0z
ÚLTIMA HORA: Google Gemini ahora puede analizar cualquier acción como un analista de Wall Street (gratis).
Aquí tienes 9 increíbles prompts de Gemini que sustituyen terminales de Bloomberg de $4.000 al mes:
Guárdalo en favoritos
TradingView 공식 MCP 설치법 Guide
공식 MCP 주소
https://t.co/AdKxzmLdEs
ChatGPT 설치
1. ChatGPT → Settings
2. Plugins → Add → MCPs → Add MCP Server
3. 아래 정보 입력
Name
TradingView Official MCP
Type
Streamable HTTP
URL
https://t.co/AdKxzmLdEs
4. Save
5. Plugins → MCPs → TradingView Official MCP
6. Authenticate 클릭
7. TradingView 로그인 후 접근 권한 허용
MCP 메뉴가 안 보이면
Settings → Apps → Advanced Settings → Developer mode
를 먼저 활성화하면 된다.
Claude 설치
1. Claude → Settings
2. Connectors
3. Add custom connector
4. TradingView MCP 주소 입력
https://t.co/AdKxzmLdEs
5. Add
6. TradingView 로그인 후 권한 허용
Claude Code에서는 터미널에
claude mcp add --transport http mcp-tradingview https://t.co/AdKxzmLdEs
입력 후
/mcp
에서 TradingView 인증을 진행하면 된다.
연결 후에는 이런 식으로 바로 요청할 수 있다.
“TQQQ 최근 1시간봉 데이터 가져와 EMA 구조 분석”
“BTCUSDT 4시간봉 기준 추세와 변동성 분석”
“TradingView Screener에서 조건에 맞는 미국 주식 검색”
OHLCV, 기술지표, 스크리너, 뉴스, 경제지표, 실적·배당 캘린더, Watchlist, Alert까지 TradingView 데이터를 AI에서 직접 활용할 수 있다.