@TCT_Lazoo Besides TCT, @Moneytaur’s system delivers great plays, and he shares some of the biggest insights here on X, but in my opinion it’s harder to use successfully. Both are great.
Congratulations :)
⚠️ Liquidity Cheatsheet ⚠️
The Algos that run the markets are programmed
"To go after liquidity levels, to respect fibs, to close imbalances, (...)" -@Moneytaur_
I will explain how to find those liquidity levels:
🔹Image 1: Liquidity Blocks
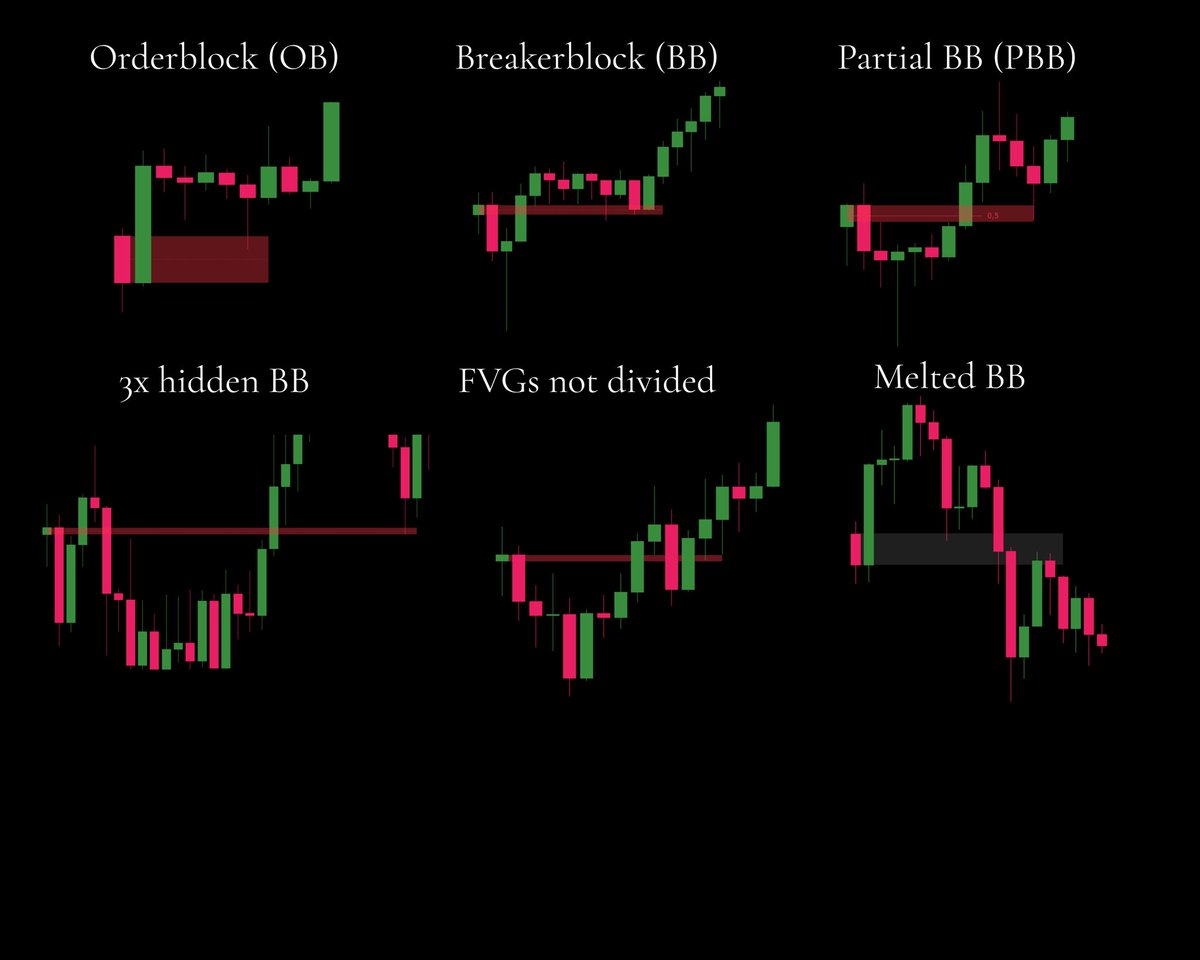
Order Block (OB) = Candle + Larger Candle (opposite color)
Breaker Block (BB) = Order Block fully hidden behind a FVG (see Image 2 for FVG explanation).
The more hidden it is (behind more FVGs), the more powerful it becomes. And the higher the timeframe, the more powerful it is.
Partial BB: If the Order Block was wicked into, narrow it down to the unwicked portion. It’s only valid if the equilibrium (EQ=0,5 fib) of the OB wasn’t taken.
Undivided FVGs are weaker, but they can still be used.
Melted Breaker Blocks (BBs) are the weakest.
A Breaker is stronger when price moves quickly through it. For example, a 1D Breaker Block (BB) with a 12H wick inside isn’t fully untouched as it would appear on the 1D timeframe.
But if the Breaker Block is ignored even on lower time frames through FVGs, it becomes much stronger because its liquidity remains fully intact.
That’s also why refinement works, it reveals the untouched areas on lower timeframes.
For better entries, you want to see a Break of Structure and a retracement into those liquidity levels.
🔹Image 2: Wicks
FVG = Grey Zone
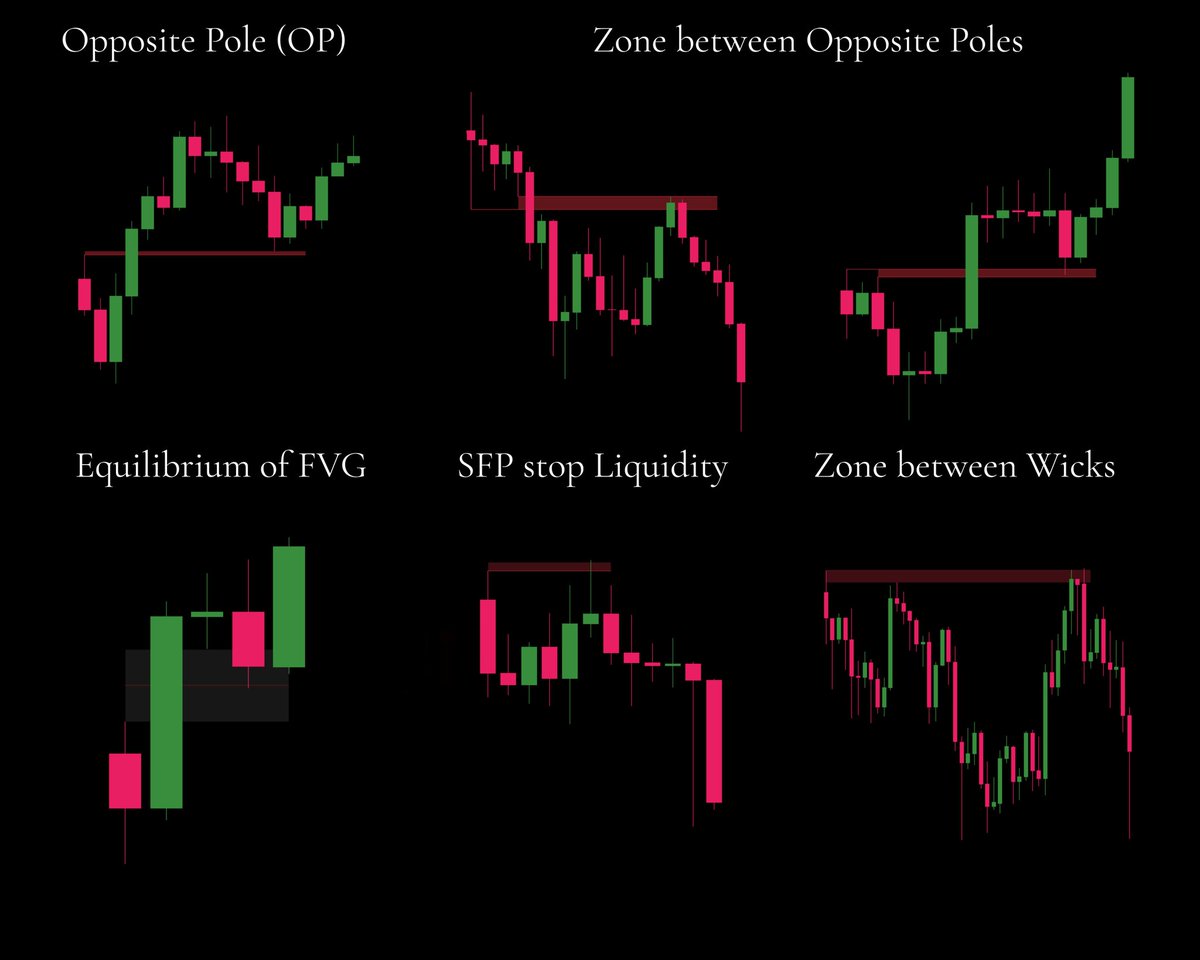
3-candle pattern: One large candle between two candles with wicks. The zone between those wicks is the Fair Value Gap.
The EQ of an FVG can act as an important confluence since algorithms often use it.
Opposite Poles are wicks located behind an FVG. You can use a single pole and the zone above/below it, or the area between two poles.
Wicks (Swing High/Low):
The majority of stops are usually located above swing highs or below swing lows. These stops provide liquidity before market makers reverse price. (SFP=Swing Failure Pattern)
The zone between wicks marks an area where price action could execute an SFP on the nearby swing high or low.
An SFP of the major swing high is possible, though price might front-run the most obvious wick.
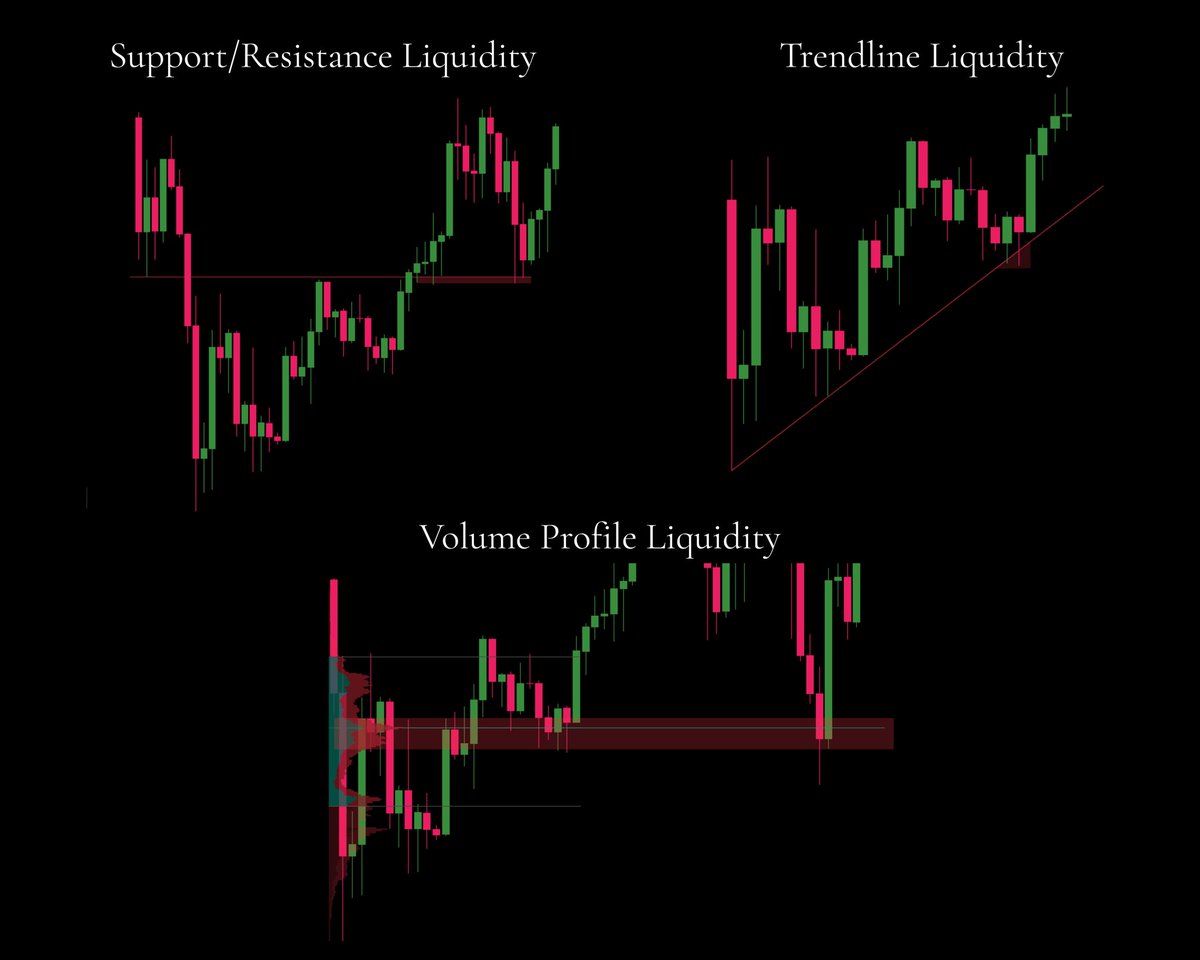
🔹Image 3: S&R, TL, VP
Support and Resistance offer liquidity because retail traders commonly use these levels.
Market makers identify liquidity or stop clusters below support and above resistance, similar to how they view trendlines.
The Volume Profile shows where most positions were opened. These areas often contain breakeven stops or intentions to exit at breakeven, making them zones that provide counterparty Liquidity for MMs.
Value Area Highs (VAH) and Value Area Lows (VAL) are also important levels.
If price fails to trade outside these levels, aka as a failed auction, it often returns back into the value area.
"Once you see it, you can’t unsee it." -MT
- MARKET STRUCTURE -
- Basics
@Moneytaur_ does not reference market structure often, not because its not important, but because these basics should be learned elsewhere. For this writeup, here’s a brief refresher before moving to some MT-specific concepts.
-------
- Trends
Trends are always relative to the timeframe.
Higher timeframe trends dominate lower ones.
Bullish Trend
Consists of a series of higher highs and higher lows.
Bearish Trend
Consists of a series of lower highs and lower lows.
📝A sideways trend is made up of smaller trends confined to a range.
-------
- Structure
Market structure is the foundation on which all key concepts in MT’s trading style are built. Liquidity, imbalances, and supply and demand are all rooted in structure.
Price action is the process that builds this foundation. PA follows liquidity, and this constant search for liquidity shapes structures.
Imbalances between buyers and sellers create directional moves (FVGs), while balance creates fair value zones (Ranges).
Balance → Imbalance → Balance → Imbalance
“If there’s no significant imbalances, there will be OBs and Supply/Demand fresh levels. If there’s no OBs and Supply/Demand fresh levels, there will be significant imbalances.
If there’s none at all it will ⚡️ into a ‘fresh’ level and build a new trading range.
Few…” https://t.co/UOSYiuqJrm
The higher the timeframe, the more robust the structure and the more reliable the signal. HTF > LTF.
Structure defines supply and demand, premium & discount, and creates liquidity zones. It also defines ranges. When price action moves beyond these range boundaries, there are four main possible outcomes:
• Break out/down: price breaks through the range and keeps moving.
• Rejection: price fails to break the range.
• Break out/down plus retest: price closes relevant candle bodies past the range and continues after retracing back into key liquidity.
• Fake-out: price breaks out/down, and then reverses.
Outcomes 3 and 4 differ clearly.
Fake-outs are usually sharp and aggressive, often leaving large wicks from stop hunts or liquidity grabs.
Retests tend to be slower and more deliberate, usually following higher timeframe candle closes past the prior range boundaries.
“Look for HTF body close above previous most significant swing highs. If not, it’s likely a false breakout. If it does, the highest probability play is waiting for a pullback into key level before continuation into the next HTF liquidity level, and if there’s none to take it will likely go to new ATH.”
https://t.co/0DG6h2dw79
- Internal vs. External Structure
External Structure
• The overall trend visible on a higher timeframe (relative to a lower timeframe).
• A weekly chart is made up of seven daily candles; compared to the daily, the weekly is external structure.
Internal Structure
• The smaller movements within the higher timeframe, seen on lower timeframes.
• Shows smaller trends inside the larger move.
Internal structure can shift short-term without changing the external trend. Always let the external (HTF) structure guide your HTF bias; internal structure offers early clues.
Example: (📈 in comments)
This 2W chart is external structure and clearly in an uptrend.
On this daily chart of the grey box, we are in a downtrend. This is internal structure.
The examples highlight the importance of always seeing structures in relation to each other.
M > W > D > H > M > S
Internal structure shifts can be the early clue that external structure may change. Let the higher timeframes define the macro structure and watch for early signs on lower timeframes.
-------
- Market Phases
The Four Market Phases
Accumulation
• Typically follows a downtrend but can appear anywhere market makers prepare for markup.
• The range lets market makers accumulate while pushing news to fit the narrative.
Buy Program (Bull Market/Markup)
• Follows accumulation or re-accumulation.
• The asset appreciates in value.
Distribution
• Typically follows an uptrend but can appear anywhere market makers prepare for markdown.
• The range lets market makers offload while pushing news to fit the narrative.
Sell Program (Bear Market/Markdown)
• Follows distribution or re-distribution, depending on context.
• The asset depreciates in value.
(📈 in comments)
- The Psychology of the Phases
Accumulation
Emotion: Skepticism, disbelief, apathy
Psychology: Most traders are fearful or disinterested. Market makers are quietly buying.
Behaviour: Retail avoids the market; volume is low; sentiment is bearish or indifferent.
Media manipulation: The most bearish news marks the bottom. “Markets are dead.”
Bull Market (Markup/Buy Program)
Emotion: Optimism, excitement, euphoria
Psychology: Confidence builds as prices rise. Retail starts buying in; FOMO.
Behaviour: Volume increases; media turns positive; public participation grows.
Media manipulation: Coverage increases and sentiment turns bullish in line with price.
🔺Intensifies with trend
Distribution
Emotion: Greed, overconfidence, denial
Psychology: Retail believes the trend will continue; smart money is offloading.
Behaviour: Volatility increases; price chops; bullish sentiment remains high.
Media manipulation: News remains bullish; influencers push FOMO narratives.
Bear Market (Markdown/Sell Program)
Emotion: Anxiety, fear, panic, capitulation, despair
Psychology: Retail sells in panic. Smart money prepares to accumulate again.
Behaviour: Heavy selling; negative news cycle; retail sells at loss.
Media manipulation: After the initial selloff, fear-driven headlines dominate.
🔺Intensifies with trend
🔺Understand that the system runs on predictable human behaviour. Stay hyper-aware of your own emotions and learn to flip them into signals instead of traps.
“When you feel you will make a lot of money by holding, it is close to the top. When you feel you will lose all your money by holding, it is close to the bottom.
Your own fear and greed emotions are two of the most powerful indicators you will ever find.” https://t.co/oHAxhgJtCy
-------
- Market Structure Shifts
Changes in structure are vital for gauging the probabilities of the next move. Understanding these shifts and the patterns that reveal them is essential for becoming consistently profitable.
BOS – Break of Structure
A BOS occurs when price closes relevant candle bodies past a significant high or low. It confirms a change in structure.
CHoCH – Change of Character
A CHoCH happens when price breaks structure in the opposite direction of the current trend. It’s the first signal of a possible trend reversal.
BOMS – Break of Market Structure
A BOMS is a clear break of market structure, usually on higher timeframes and significant levels. It confirms a shift in intent when validated and often shows higher volume and leaves FVGs behind.
- Trend Changes
Using trends, BOS, CHoCH, and BOMS helps identify key structural shifts in the market. Knowing when the market transitions from a buy to a sell program is crucial for being profitable.
“Buy program: Bullish BBs work wonders.
Buy program: Bearish BBs can often fail, unless optimal.
Sell program: Bearish BBs work wonders.
Sell program: Bullish BBs can often fail, unless optimal.” https://t.co/CWKVFBwZSe
Putting all learned concepts together helps us spot potential tops forming. Using the ideas above gives us further confirmation.
(📈 in comments)
-------
- MT’s 1,2,3 System (Squiggles)
For MT, structural shifts are an essential part of his setups. The system has three parts:
• A valid break of a key level (BOS)
• A retrace into liquidity
• Entry at the refined level to ride the reversal
This approach ensures we get the optimal entry after fuel is taken, letting us ride the trade longer with clearer invalidation and better RR.
“There’s no MTF or HTF candles closing above key PSH, so you don’t long here. For the highest probability long it’s the squiggle on the chart, with MTF (at least) close above key PSH plus pullback (the entry) before bullish continuation.” https://t.co/DwsTmv5NUI
“All “squiggles” mean the strategy is to wait for close above or below HTF key levels as stage 1 of 3, pullback or retracement into key levels if you can find them, and most of the time you can because bots always leave such levels with fuel behind, to come back later and reverse price again as stage 2 of 3 and this is your entry, and then continuation into the direction of the first move, stage 3. This is how these liquidity games work.”
https://t.co/20IM2XZU8d
Breakout trading is popular, but charts like the one below, and the effectiveness of squiggles, show its weakness clearly.
“You can always choose to long the breakout, but this isn’t going for high probability as it’s what all retail traders do, and the game’s designed to stop or liquidate them all, collecting fuel, and then proceed in the direction retail traders expected, which will then make them start revenge trading as they were ‘right but wrong’.”
-------
- Using Liquidity as a Guide
Market makers leave footprints that help us assign probabilities to the next move. Liquidity is key. When key levels are left behind and price action approaches a level without taking the liquidity first, chances are high, it will revisit to grab that fuel before continuing.
“A helpful hint to determine if a breakout will reverse into a key level before trend continuation is to check if there’s a key level left behind in the previous range that price is attempting to break out from. If the key level is present, especially on HTF and you can refine it into lower timeframes, the probability of a pullback into that level before continuation becomes significant, as price tends to gravitate toward such levels. Additionally, if there’s a key level above the swing high that can be taken, it could act as fuel for a drop into the lower level, setting up for a subsequent pump.” https://t.co/dLb32EUytJ
Alternatively, when no such levels exist, the probability is higher that the breakout/down is real and price action will continue in the direction.
“If you cannot find such, the probability for breakout into price discovery, without looking back for a while, is higher.” https://t.co/uxu7gczPIQ
-------
- Confirming a BOS
In general, higher timeframe structures need higher timeframe confirmations. Use timeframes relevant to the trade. For higher timeframe levels MT often looks for closures 12h or higher. Further HTF closures add confluence and reinforce the likelihood the break is real.
Always watch for body closes above or below the swing high or swing low.
(📈 in comments)
Without a confirmed BOS, we risk falling for fake moves. A confirmed BOS marks clearer intent. Wait for the signal, place orders where the fuel sits, and ride the continuation.
🔺Lately, more HTF closes have resulted in reversals. Market makers are aware that retail is looking at daily closes.
“Don’t fall for false moves. Learn to identify confirmed BOS on HTF and you will level up instantly.”
(📈 in comments)
There’s no single timeframe that automatically invalidates every setup. The last five minutes of a HTF candle can close below a level without any real prior price action in that area. Zoom in on lower timeframes and check what’s happening. Look for signs of strength or weakness to support your decision. Stay flexible and weigh all factors.
Things to consider:
• How optimal is the level?
• Where is the level located?
• Is the asset high volume?
• What are majors doing?
• How does price behave around the level?
• Are newly formed LTF structures being respected?
• Is there spoofing?
• What is order flow showing?
MT has posts calling for 12H+ closes to confirm or reject a level; others rely on 2H. This is closer to an art than a rule, an edge that only comes through screen time and real experience.
“Take notes on this PA, because it will change your game. You can go through timeframes up until 2H and you will notice there’s no candle bodies closing below the level where the 2D BB is at. The hint is there. From here I’ll wait for key SH or SL to be taken and find an entry on pullback or retracement. 0 candle bodies closed below 2D BB. Body, not whisker. At least a 2H full body, specifically for SOL as it’s a high TV coin.” https://t.co/NWU3jY4LnM
-------
- Timeframes
Moneytaur has his own definitions of timeframes. You can either adopt his schematics or come up with definitions that are a better fit for you.
“micro TF: 5min and lower
LTF: 15min > 2H
MTF: 2H > 12H
HTF: 12H > M+” https://t.co/ddmUmlaFK9
HTF (12h+)
• Hold the most liquidity and are the most reliable.
• The higher the TF, the clearer the signal of the predominant trend.
• 1W+ are macro timeframes.
• HTF plays = up to 3% of trading account, max 5% if optimal.
MTF (2h–12h)
• First reliable validations of BOS, CHoCH, BOMS.
• Key for refining levels.
• MTF plays = up to 2% of trading account.
LTF (5m–2h)
• Super-refined entries, exits, and stops.
• First possible signs of BOS, CHoCH, BOMS.
• Less reliable as they hold less liquidity.
• LTF plays = up to 1% of trading account.
mTF (<5m)
• Ultra-refined entries, exits, and stops.
• Entries or exits based on micro structure reactions to key levels.
“In micro timeframes, you can better see when a price reversal is likely, since the ⚡️ at key levels is a powerful sign of that. If you spend time in those timeframes when the price is reaching key levels where you expect a reaction, you’ll start to notice a pattern and better understand whether a reversal can actually occur or if the reaction is too weak. As for the ‘ping-pong’ at key levels, it’s the same, but weaker than in lower timeframes and harder to read, since you don’t see proper candle bodies, so you just have to get used to it.”
📝Note on Timeframes and TradingView
• TradingView anchors all intraday timeframes to the daily close.
• Timeframes that do not evenly divide into 24h will produce one partial candle at the end of each daily session.
• This shorter candle is always the last candle before the session reset at 00:00 UTC.
• So a 23h candle is 1 x 23h + 1 x 1h candle. When trading a 23h level, the chance is high that you are in reality taking a trade based off a 1h hOB.
Moneytaur’s theory about Fibonacci levels isn’t the typical retail “draw from swing low to swing high and wait for a bounce” approach — he treats Fibs as a liquidity confluence tool, not as a standalone signal.
Here’s the breakdown of his full logic:
🔹 1. Purpose of Fibs: Confluence with Liquidity
He uses Fibonacci retracements to identify confluence with hidden liquidity and refined order blocks, not to “predict” reversals in isolation.
“Fibonacci levels help you to add confluence to liquidity levels, so in case they match them, you’ll likely know that their reliability is stronger.”
So the Fib is meaningful only when it aligns with a HOB, FVG, or refined liquidity zone.
🔹 2. Preferred Levels
Moneytaur focuses almost exclusively on:
0.5 (Equilibrium)
0.618 (Golden zone)
0.705 (Algorithm Fib)
0.786 (Deep discount)
He explicitly avoids 0.236 and 0.382, calling them “less impactful.”
“0.5 + 0.705 + 0.618 + 0.786 are the most powerful fib levels, especially the first two… that’s why you never see me adding 0.236 or 0.382.”
The 0.705 is crucial — he refers to it as the “algorithm Fib”, the midpoint between 0.618 and 0.786 that more accurately represents algorithmic/market maker behavior, especially in crypto’s high-volume markets.
🔹 3. Multi-Timeframe Fib Refinement
He layers Fibs across different TF swings to identify overlapping retracement zones:
“0.705 on a higher TF swing + 0.5 on a lower TF one = extra confluence = very powerful level.”
Example:
Draw Fib on the macro swing (HTF) → find 0.705 retracement.
Draw Fib again on a micro swing (LTF) → find 0.5 retracement.
If both align near a hidden liquidity zone or HOB → that’s his “sniper entry.”
🔹 4. Premium vs. Discount Framework
In his rulebook, he uses Fibs to define premium (short zones) and discount (long zones):
“Look for short setups in PREMIUM zones and long setups in DISCOUNT zones. This is very important as it will help you invalidate setups.”
This means:
Above equilibrium (0.5) → premium area → look for shorts.
Below equilibrium (0.5) → discount area → look for longs.
🔹 5. Fib Extensions for Targets
He also uses Fib extensions for take-profits or next liquidity targets:
“Extensions to calculate targets are another crucial part of my strategy, with the area of 1.618 + 1.454 + 1.272 that often helps me to find amazing 🎯.”
🔹 6. Summary — His Fib Logic
Core Fibs: 0.5, 0.618, 0.705, 0.786
Purpose: Liquidity & OB confluence (not standalone)
Algorithm Fib: 0.705 – midpoint between 0.618 and 0.786
Multi-TF Approach: Stack Fibs from HTF and LTF swings for confluence
Zones: Long in discount (<0.5), short in premium (>0.5)
Targets: 1.272, 1.454, 1.618 extensions
Avoid: 0.236 / 0.382 (weak retail zones)
In short —
Moneytaur uses Fibonacci retracements as a precision tool for liquidity alignment, not as a predictive indicator.
He seeks where the fib equilibrium overlaps with hidden liquidity — that’s where the market reverses hardest.
@urso_de_shorts@costamdiogo É uma casa a arder, a qualidade é péssima e ainda há pessoas a defender o seu partido quando o desinteresse é a normalidade, em vês de discutirem formas de dinamizar o país parece mais um reality show
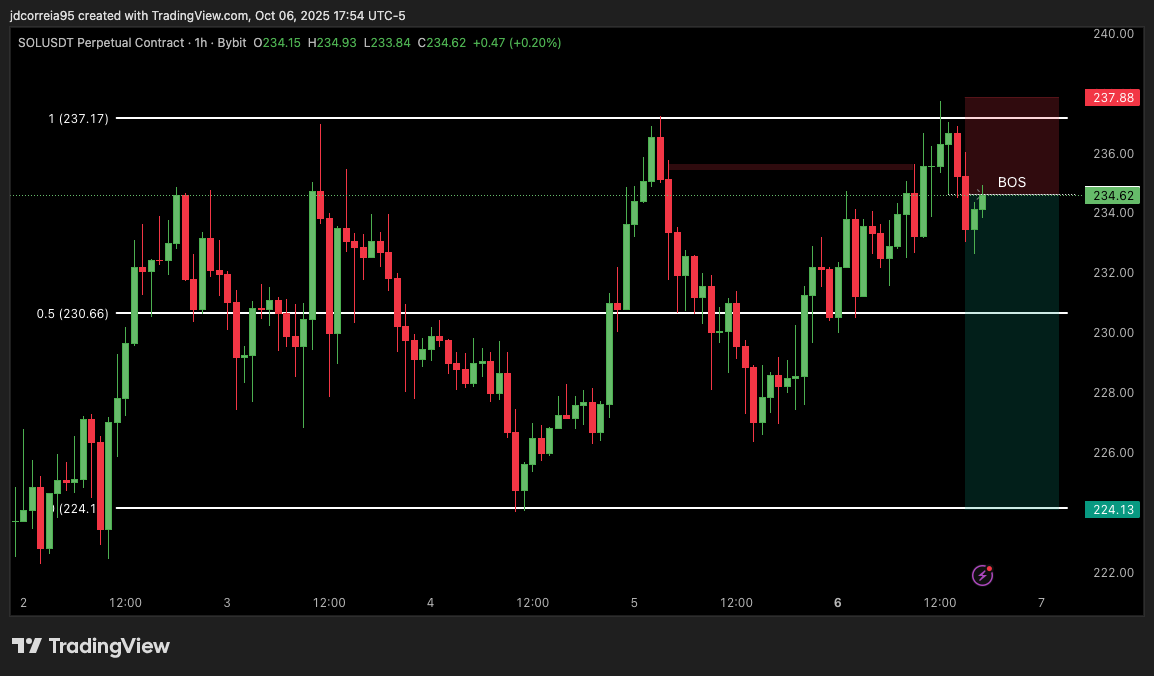
@Larskooistra_ I was following the same setup but considered the third tap at 19h and got stopped by the next move down, what prevented you from longing the bos at that movement?
How To Refine Using Gaps
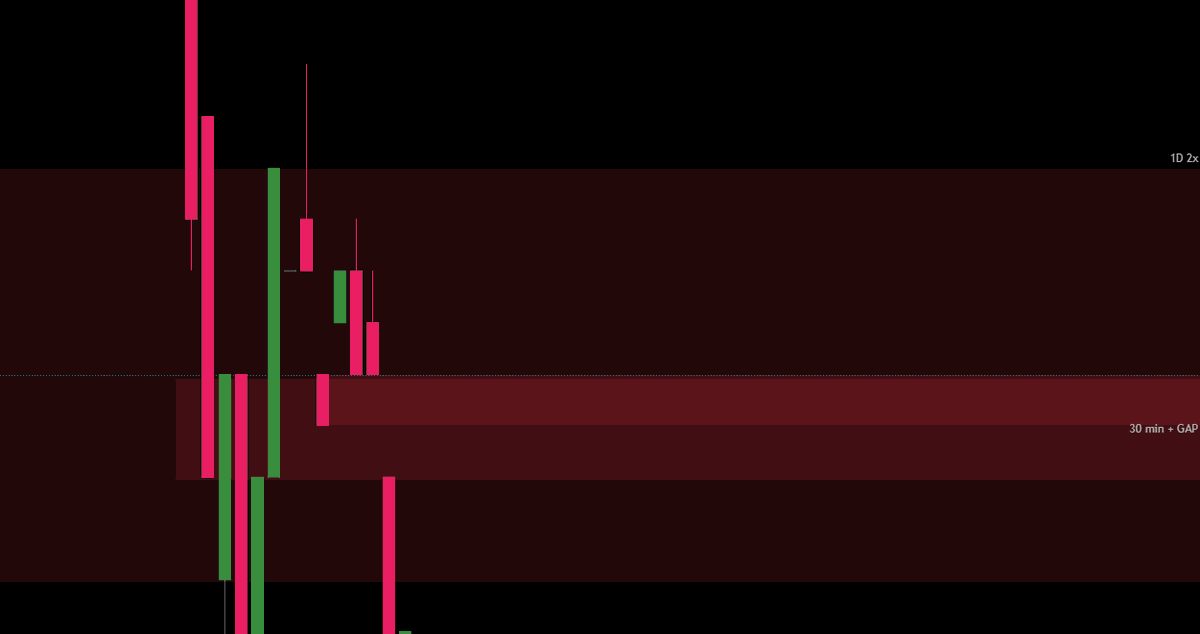
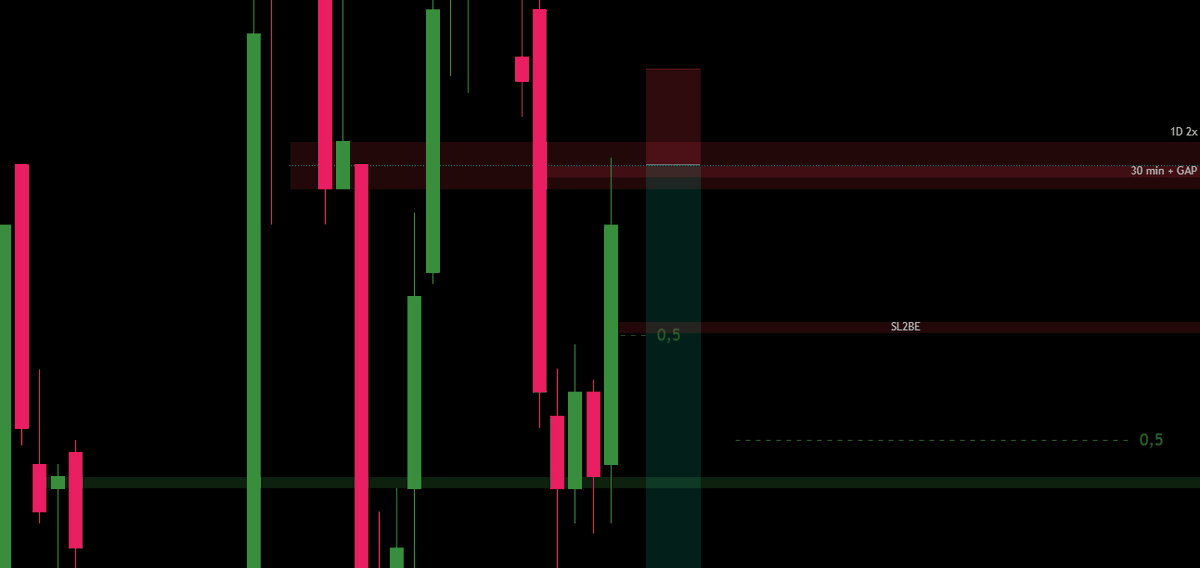
1.Example ACB 1D 2x hidden BB
To refine it, one could find a 30min Orderblock. To go further, you go on lower TFs until you find the GAP on the 5min TF. The gap itself adds strength to the overlapping 30min OB. The Breaker behind the gap narrows it down even more. (+1D EQ)
2.Example BAC 1W+5D BB
At first you identify the 1W Breaker. Then you scan through lower TFs until you find the 5D BB. To refine it even more you go on the 4D TF and find the GAP behind a FVG overlapping with the 1W EQ.
Final Reversal:
MT used the same method here:
https://t.co/6bnwIH3ENE
If you enjoyed this Thread:
1. Like and RT
2. Follow me @OverlordEins for more
If you have any questions put them in the comments below👇
@MorphwareAI Bot drops a pixelated/blurred image with a secret code hidden inside, Community engages, Each action makes the image clearer.
Buyback fund continues to accumulate.
Once the image is clear enough, the hidden code is revealed. user submits the correct code in Telegram
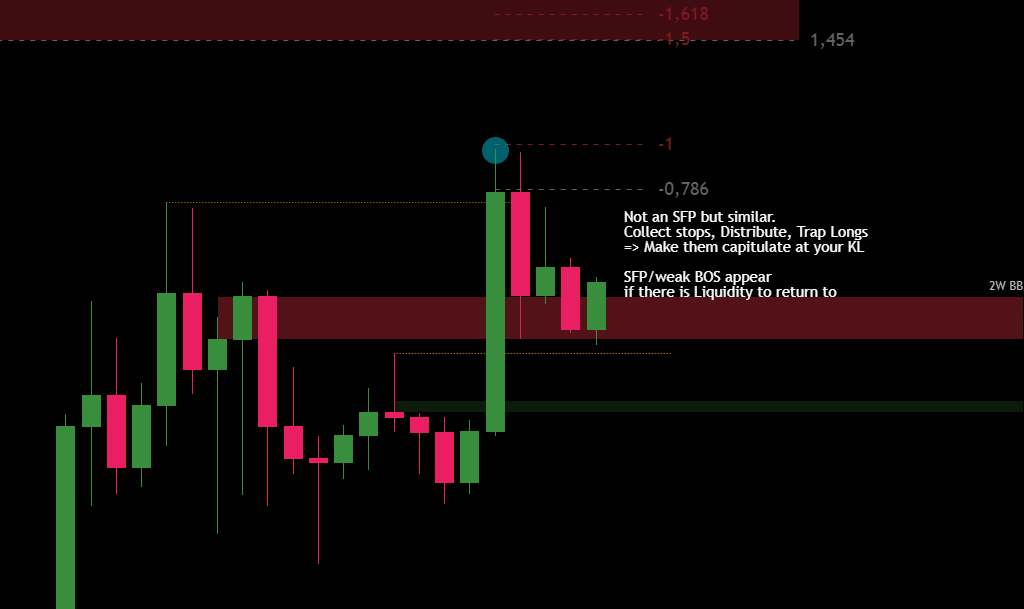
🧵Swing Failure Patterns (SFP) happen if there is Liquidity to Take or to Return to.
SFPs create the necessary counterparty Liquidity for Market Makers (MM) to fill their orders.
That's how Wyckoff and 3-Drive patterns work. They SFP previous SL/SH to get their orders filled by collecting stops and baiting breakout traders.
I will explain the most important scenarios with examples below.👇
1. SFP To Return To Liquidity:
Key Liquidity (KL) attracts Price Action (PA) like a magnet. MMs might use an SFP to distribute some of their positions before reaccumulating again at KL.
Think of PA like an elastic band stretched to hunt stops/trap traders before returning to Liquidity again.
If those trapped traders capitulate, they just accelerate the move towards KL and might provide counterparty volume for MMs to get their positions filled.
⚠️SFPs become more probable if there is liquidity to return to.
2. SFP When Taking Liquidity:
• Below Key Liquidity
MMs create the necessary counterparty volume before reversing.
• Within/Above Key Liquidity
If you enjoyed this Thread:
1. Like and RT
2. Follow me @OverlordEins for more
If you have any questions put them in the comments below👇