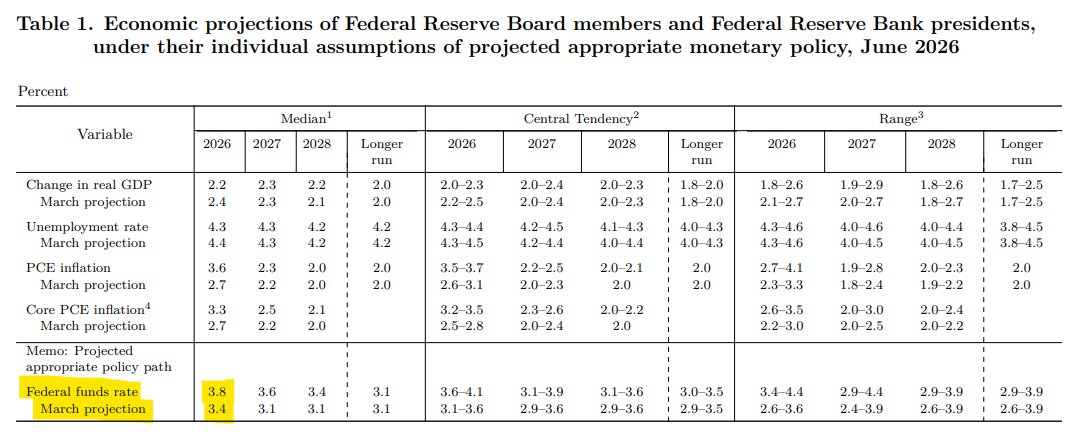
Very hawkish dot plot.
Nine out of 18 officials have at least one hike this year (and six of those 9 have *multiple hikes*).
Only one person has a cut this year, and one participant (presumably Warsh) didn't submit an SEP
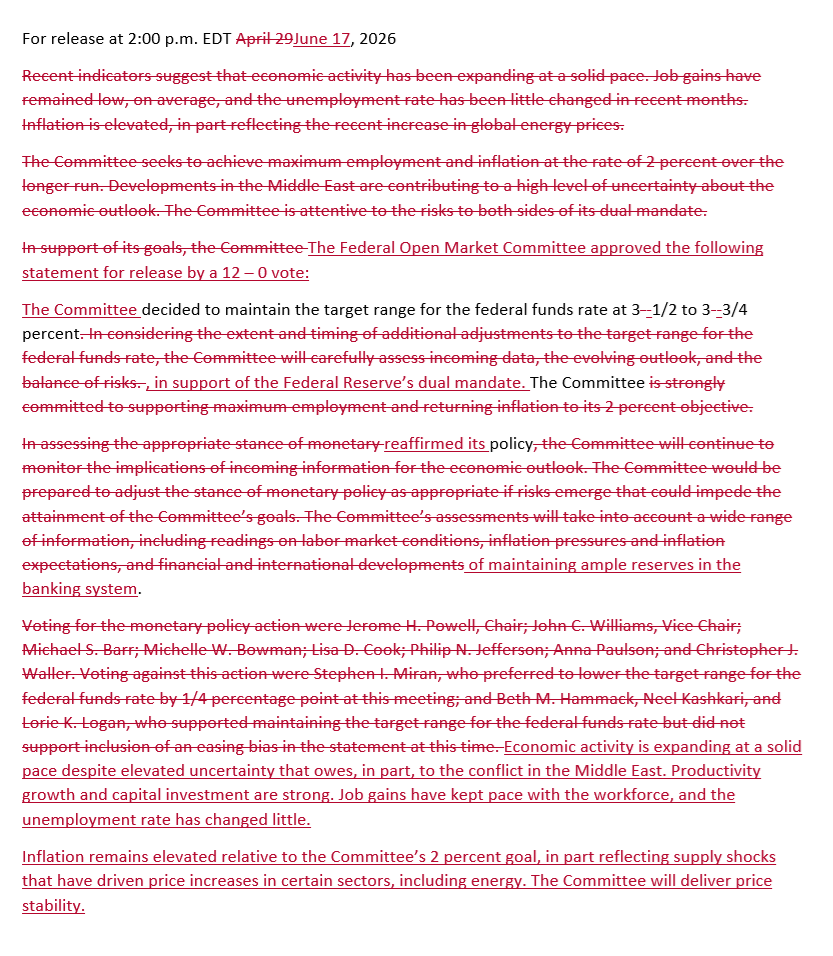
The statement gets a complete writethru from top to bottom, much shorter
Big shift in Fed dot plots with the median member now forecasting 1 rate HIKE this year when previously they were forecasting 1 rate CUT.
The stock market may not like it but this is the right move if the Fed wants to regain any credibility as an inflation fighter.
"With the three largest passive S&P 500 funds now holding more than $2.6 trillion combined ... prices are increasingly set by mechanical flows rather than by anyone judging what companies are actually worth."
-Apollo Slok
Best case Warsh signals the end of the war shifts the FED policies to wait and see with a mid to long term focus on lowering rates.
Keep in mind Warsh asserted that artificial intelligence will act as a major disinflationary force in the long run.
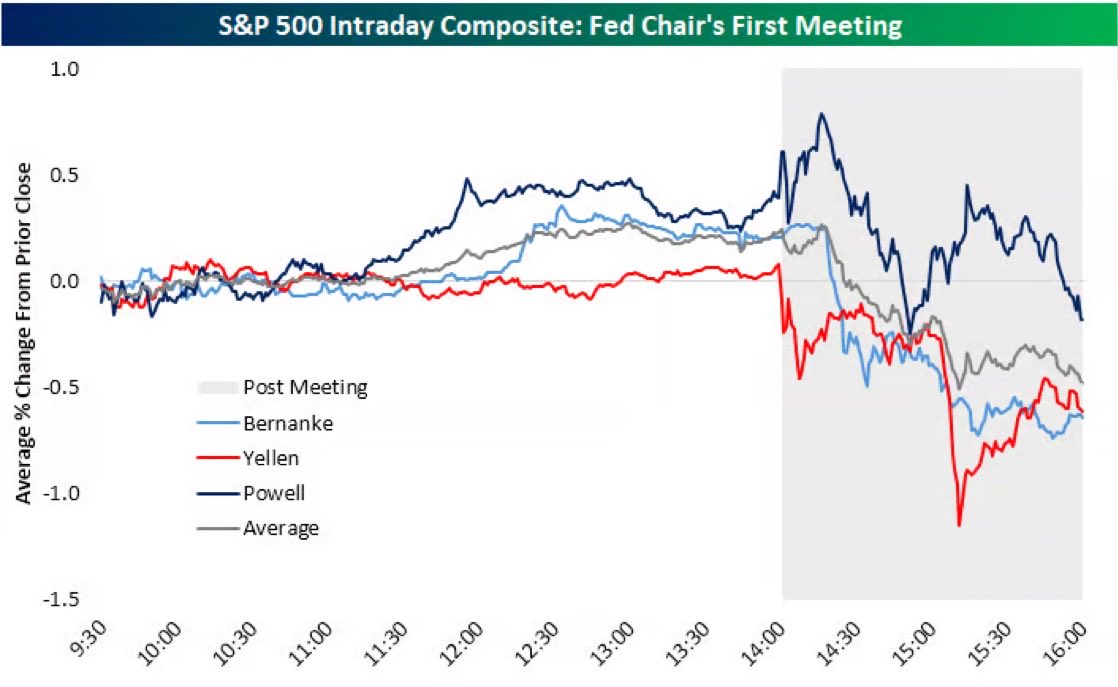
The first FED chair meeting is set for Tuesday.
Yields should drop sharply tomorrow due to the peace deal, it will be interesting to see how they continue into the week.
Gold miners have been taken out back.
Gold is more than 24% below its three-year high.
99% of GDX miners are in bear markets.
After similar stress since 1993, gold's median return was flat to negative.
The same setup preceded 50% crashes and 50% rallies.
Read full analysis: https://t.co/b5EidO7rr2
I am half way through the new Market Wizards book, and few things stand out insane work ethics, self leadership, self belief bordering on delusion and ability to go deep once they found setup ideas.
DOLLAR COULD RISE ON WARSH RATE-HIKE SIGNAL
The dollar may strengthen if incoming Fed Chair Kevin Warsh signals openness to rate hikes at the June 16–17 meeting, says TD Securities strategist Howard Du. The Federal Reserve System is seen as more hawkish than peers (except ECB), but markets await clearer guidance. Keeping a 2026 hike on the table could lift USD demand during U.S. trading hours amid resilient data. (58 words)
It's refreshing to see this chart on one axis instead of two.
By removing the dual axis and putting it on the same scale, you can see an important difference between the 1970s is that inflation was already problematic before the 1973-74 oil shock. The analogue in this example, the 2021 inflation, didn't have the same issue going into that spike, and inflation had returned to a lower level following the surge.
OIL SURGES PAST $110 AS WAR RISKS INTENSIFY
Oil jumped above $110 and diesel topped $200 after Trump threatened escalation in Iran, raising fears of prolonged disruption through the Strait of Hormuz.
Despite hints the war could end soon, no clear timeline or plan has emerged, keeping markets on edge. With the strait effectively closed, supply remains severely constrained and prices have surged—Brent is up about 50% since the conflict began.
Refined fuels are under even more pressure, with diesel spikes signaling rising global inflation risks. Tight supply is evident, with near-term oil contracts trading at record premiums.
Until there’s clarity on de-escalation or Hormuz reopens, analysts expect continued volatility and elevated energy prices.