⚠️Hindenburg Omen flashing a warning signal?
Multiple Hindenburg Signals clustered together flags an Omen. Friday's close triggered a new Omen. The previous Omens since 1998 are shown below.
⚠️SPX 1M and 3M Correlation levels have hit extreme lows while fund managers are back to nearly fully invested.
The only other time this has happened was early July, 2024. SPX climbed +3% over the next few weeks before crashing -10%
⚠️SPX has now closed >25 days above the 8ema and >5 days above the 1.5 std deviation of the 20dma.
This has only happened 3 other times since 1990
- Sept 2, 2020
- Jan 21, 2020
- April 15, 2010
SPX Fixed Strike vol has spiked higher 3 days in a row as as SPX climbs higher (stocks up / up vol).
The last time this happened was Aug 26, 2020, where SPX climbed nearly another 3% over the next 5 days for a blow-off top.
I just went max bearish equities. However plenty of bull cases exist. The six big things that can make me wrong
1) Collapse of long term oil prices back to the low's
2) The passage of a highly stimulative fiscal package or reconcilliation
3) Manipulation of the Treasury Issuance such that they issue less duration and more bills, and Fed Balance sheet manipulation - These things are really bad for USD
4) AI ROI for all spenders on picks and shovels surprises on the upside vs already lofty earnings expectations AND margin doesnt come from firing workers.
5) Fed cuts short rates more than expected
6) Investors, companies, and banks lever up more than expected to invest and consume (Animal spirits accelerate and persist.) Which absorbs the massive overhang of issuance of government bonds, corporate bonds, IPO's etc which elevated growth expectations depend without a decline in prices, rise in yields.
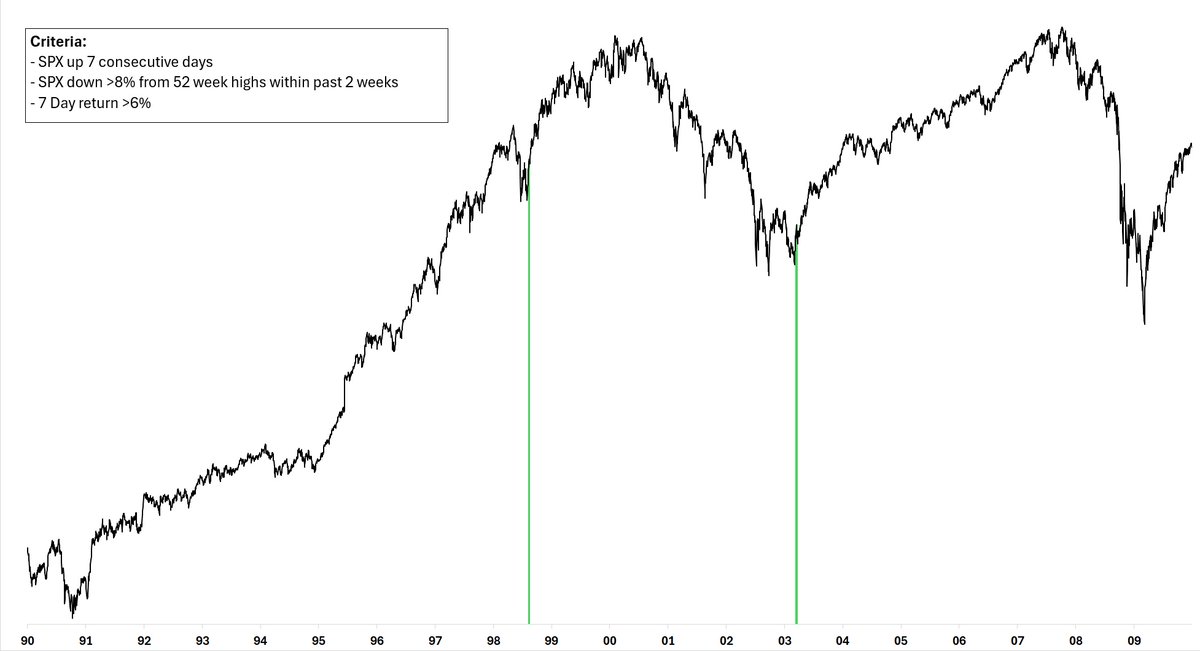
⚠️SPX is now up 7 days in a row and gaining more than +7% after having been down nearly -10% from recent highs in the last couple weeks.
Below are the similar cases since 1990
@wadecapital@alpha_pls@drakeondigital Generally when accounts wont simply show a chart is because it's either not true or because its just for the engagement bait.
Anyways, here are the dates and graphs:
- Apr 8, 2026
- Dec 3, 2018
- Sept 2, 1999
- Oct 11, 1994
@spotgamma@zerohedge I believe this is actually just the sum of the "naive" gamma of all the individual stocks in the s&p. Nothing to do with "dealer gamma" at all.
@SqueezeMetrics@cognitivedis312 The last time GEX hit these levels was just Jan 20, 2022. Stocks still fell another 5.8% over the next two days before the first deadcat bounce even started.
A similar drop today would hit SPX 6,000 before bouncing back above the 6500 area.
@WalterDeemer Today's voter turnout was the lowest on record in the polls entire history. Even more unusual during a series of down weeks in the market.
⚠️SPX down 5 consecutive weeks after being at ATHs less than 40 trading days ago.
This has often led to a near-term bounce though not necessarily a bottom.
Notably the 1973 case which saw oil prices spike 400% and markets down nearly📉50%.
⚠️BOUNCE WARNING?
Below graph highlights the first bounce after going from ATHs to 3 consecutive closes more than -1% below the 8 ema followed by a close above it.
For cases where markets headed back lower, a bounce first to the 20 dma was often the case.