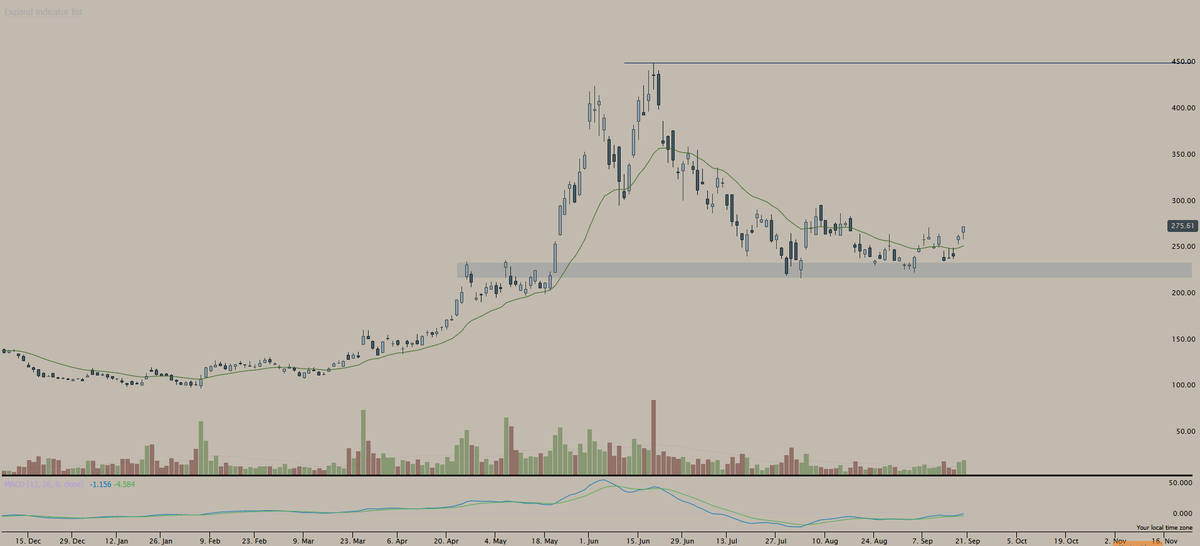
The best traders in the world often talk about how your main focus should be in the following..
environment > themes > setups > entry's
It doesn't get much better than this.. liquid leaders forming huge bases while reclaiming the 20EMA & approaching breakouts with volume expanding.
Some made great short traps eg: $AMD "head & shoulders" with a failed breakdown only for it to rip to new highs just weeks later.
Other are finding there footing while the market has taken a breath. Either way some great oppertunity to capitalise on going into Q4.
If not already in I'd focus on $MU dipping below $1000 for one last shot to load up + $SNDK to wick below $1700 before reclaiming and starting the real move!
(if your lucky enough to get a dip)
Charts: $MU $SNDK $AMD $ARM
There’s a huge misconception that the point of a deep dive is the output, like a model book.
That’s why you see dedicated software popping up. The kind that claims: “Qullamaggie told you to do a deep dive; here’s the tool to do it.”
That’s also why people try to build such deep dives, or take other notes, with AI. Which is like saying that real-time translation earbuds are as good as actually learning the language.
The point is the process.
Going through that struggle is the only meaningful way to learn and grow.
The process is what builds your mental network. It’s how you learn pattern recognition through the lens of your edge.
The output is just the tangible part, useful for later review — for reinforcement and finding areas for improvement with fresh eyes.
(Also useful for getting engagement on social media, or even packaging and selling to people. Which is why I’m especially sceptical about super-polished deep dives. The value actually comes from messiness with a clear throughline.)
No successful trader credited their success to a tool that did the studying for them.
They credit it to studying themselves. (Though often directed by those who did a similar study before them — idea generation!)
That alone speaks volumes.
My Dan Zanger deep dive is available for free, based on only free materials.
Several people DMed me, offering access to Dan’s old newsletters, but I declined. Copyright issues aside, I really wanted to prove just how much you can learn from what’s freely available online.
Individual sources are all linked in my write-up (https://t.co/UVtcDAVmsx), but for convenience, here’s a list of the key resources I used.
Dan’s own website, containing various written interviews (2000–2010)
https://t.co/upm796AY8D
Written interview with the CMT Association (2009)
https://t.co/M2mwPjqmLa
Probably Dan’s best interview, and certainly the highest WWR one (2005)
Part 1: https://t.co/Hy6DKfc7YT
Part 2: https://t.co/ZKgj9VAcQb
Very good longer spoken interview from 2016
https://t.co/f1IEFaJuaV
More recent spoken interviews on Spotify (2018 & 2020)
2018: https://t.co/6TLSONMl56
2020: https://t.co/YofXQWEQ2B
A few live broadcasts Dan did, with this being the most interesting IMO (because you can feel just how much he’d improved at environmental awareness/trading less; from 2015)
https://t.co/DDbZH5ZySM
The ‘catch’ is that going through this stuff takes a LOT of time and effort. But that’s also a good thing. The *intentionality* this type of exercise requires is what makes a study method effective.
Plus, an edge, by definition, involves doing things of value others can’t or won’t do. And when it comes to information in the public domain, the edge must come from what you do with it.
As Dan said: you can lead someone to water, but you can’t make them drink.
A Free gift for you guys
A Group Momentum Tracker.
After a 2-week-long deep dive, I have come to the conclusion that momentum trumps relative strength.
https://t.co/3TJq9ZNwI4
Here’s a tip that’ll change how you watch sectors:
Semis were close to rolling over. Then they woke up.
Most people weren’t paying attention to how clean the 21EMA retest on $SMH actually was.
When the ETF is testing its 21EMA, look at the individual stocks within that theme that are front-running it. Those are the names screaming “I am a good buy” before the crowd even notices.
That’s exactly what happened with Chips and AI names
$AMD $INTC $MRVL $DELL $NBIS $GNRC $BE $MU
Qullamaggie on If You’re Not a Moron You Will Make it Far in Trading
“The best thing are people that keep commenting on YouTube. They’re like hey what’s ADR hey how do you trade your setup. He’s like dude the instructions are literally on the screen. It’s amazing like this is the reason — you know if you’re just a little bit above moron level, you gonna make it far in life. Because most people they just can’t get above the moron level. Like the level you need to reach to get successful in any field is actually lower than you would think. Because most people are just not really… yeah everyone just wants to get rich, they want everything served on a silver platter. Those are the people that pay our bills haha.”
When I talk about a "mini coil setup," what I'm really talking about is TIGHTNESS.
1 of my favorite tools for visualizing this is the tightness indicator created by @TaPlot. When you start seeing 3+ candles trading within the range of a larger ignition candle, that's usually a sign that volatility is contracting, sellers are getting absorbed, and energy is starting to build.
From COMPRESSION comes EXPANSION.
Now combine that with a leading stock, a strong theme, a healthy market environment, and a name coming out of a large base...and you're stacking multiple layers of probability in your favor. It doesn't guarantee anything, but it absolutely gets my attention!
$OUST and $UMAC are 2 names that recently flagged through this process. I've been talking about both for weeks, and now they're starting to show the type of tightness I'd expect to see before potentially building out the right side of the base.
When there are hundreds of charts to look at, my focus always comes back to the same thing:
> leading RS name in the upper-right corner of the chart
> emerging from large bases
Leaders, leaders, leaders.
That's where I spend most of my time, and that's where the biggest opportunities tend to come from.
Chart: $OUST + $UMAC.
Most traders study today's hot stocks.
I study the biggest winners from the last 100 years.
Why?
Because the patterns never change. 📈
Look at the chart below.
The stock is from 2004.
Yet it shows the exact characteristics I still look for today:
1. A clean chart pattern (Cup & Handle, Flat Base, Base-on-Base)
2. Huge volume accumulation
3. Strong EPS and sales growth
4. Support at key moving averages
5. Relative strength before the breakout
6. A market coming out of a correction
Different decade.
Different stock.
Same footprints.
I've studied thousands of historical winners.
The surprising part?
The biggest winners rarely look random.
They leave clues before the move.
The more charts you study, the more you realize that monster winners tend to follow the same blueprint again and again.
Most traders spend their time searching for the next stock.
I spend a lot of time studying the last great ones.
That's where the real lessons are.
These patterns repeat.
I've taught this process to thousands of traders.
You can learn it too.
I've realized the majority of my profits have never come from buying the breakout itself.
It's come from buying the pullback after the breakout.
Almost every trade I take starts with a stock coming out of a large base. I'm talking about names that have spent months, and sometimes years, moving sideways while institutions accumulate.
Then eventually something changes... maybe it's earnings, or it's a new product cycle. Maybe it's a theme gaining momentum? Whatever the catalyst is, price finally starts leaving the range.
And funny enough, that's where the 99% get excited.
Ironically, that's where I usually become patient.
The breakout gets my attention, but the pullback is often where I get involved.
1 of my favorite setups is the first pullback after a major base breakout. If I miss that one, I'll usually focus on the second consolidation. In my experience, these are often the "highest quality" opportunities because the stock has already proven it can break out, institutions have already shown their hand, and now I'm simply waiting for the market to give me a lower-risk entry.
I like to think about it this way:
- A breakout is the market making a statement.
- The pullback is the market asking a question.
"Are buyers actually willing to defend this area?"
That's what I'm trying to figure out.
When a stock pulls back after breaking out of a large range, I'm paying very close attention to how it behaves. Does it immediately fall apart? Or does it hold key levels and refuse to give back much ground?
When it comes to behavior, I look for TIGHTNESS.
If a stock breaks out 20%, then spends the next two weeks trading in a very tight range while volume dries up, that's constructive behavior to me. Sellers are becoming exhausted while buyers continue absorbing supply. The tighter the action becomes, the more interested I become!
Volume is another huge clue.
During the breakout, I want to see volume expand. That's evidence that institutions are participating. Then during the pullback or consolidation, I want volume to contract. If volume is exploding on every red day, that's usually not what I want to see. But if volume starts drying up while price remains near highs, that's often a sign that selling pressure is becoming limited.
1) Price tells me what happened.
2) Volume tells me how much conviction was behind it.
I also spend a lot of time studying the personality of a chart.
Some stocks are constructive, and some stocks are sloppy.
Some names respect the 9EMA for weeks + months. Others constantly undercut and reclaim support before moving higher. Some stocks have violent shakeouts. Others grind methodically higher.
This is why I constantly study prior winners.
I'm trying to understand how a stock behaves when it's healthy.
> Does it respect moving averages?
> Does it recover quickly after pullbacks?
> Does it close near highs?
> Does it show relative strength on market weakness?
> Does it stay tight?
Those are the little nuances that I look for from a potential leader.
A simple list I look for:
1) Find a stock breaking out of a large base.
2) Confirm relative strength v.s. the market + sector.
3) Wait for the first or second pullback.
4) Watch volume dry up.
5) Look for tightness near major support.
6) Execute on 15 or 30min pivot reclaim.
7) Risk against the low.
Most people think the money is made by finding the perfect breakout... but I've found the money is usually made by finding the strongest stocks and then having the patience to wait for the first real opportunity to join the trend.
If the stock is truly a leader, the breakout is often just the beginning.
The first pullback is where the real asymmetric opportunity tends to show up. That's where I want to be positioned. That's where risk is usually the smallest.
And if the trend continues, that's often where the biggest winners begin!
Chart: $AMKR.
This image has stood the test of time for a reason.
When markets get choppy, I tend to focus on undercuts, failed breakdowns, and reclaim setups because they force weak hands out before the next potential move higher.
In stronger trending environments, b/o's can work better... but I'm also willing to buy dips into the 9/21EMA while anticipating the breakout before it happens. The strike rate might be slightly lower, but the risk/reward is often much better because my stop is already defined underneath support.
Different environments, but the same goal... to define risk tightly and position before the crowd.
So much positive feedback🚀
If you wanna study @Qullamaggie trades which made him $105 millions (for a few days), this is it💰
@jackschwager new Market Wizard book prove it has never been more achievable to make life changing money in the market for anyone
Link in comments 👇
If you are not making money during this run:
You are likely trading the WRONG stocks..
For the last few weeks, all I've done was:
-Focus on strong themes (Semis, space, memory)
-Buy these names on pullbacks into the EMA's
-Hold these winners & don't sell too early
Once these start building bigger bases, now you are going to look for rotation into emerging themes.
How to know where to look?
1. Start With Relative Strength
Emerging themes always leave footprints.
You’ll notice:
-Certain groups stop selling off during weak markets
-They recover faster than indexes
-Multiple stocks in the same niche begin moving together
-Volume starts increasing across the sector
For example:
$IGV was making new highs while $QQQ was still below the previous all time highs
This showed relative strength in the ETF, and software stocks began to emerge with strong setups
2. Scan Weekly Charts First
You will start noticing that when almost every stock in a sector is setup on the weekly timeframe.. and explosive move follows.
Emerging themes usually appear first on:
-Weekly bases
-Weekly breakouts
-Multi-month consolidations
For example data centers recently.. all had a massive weekly base
3. Follow Volume Closely
Volume is one of the clearest signs of institutional participation.
You will start noticing:
-Highest volume EVER print
-Accumulation volume patterns
-Low volume sell offs
-A breakout with expanding volume often signals real demand
This tells you that institutions are piling into the trade
4. Watch for “Character Changes”
One of the earliest clues is a change in behavior.
Examples:
-Stocks stop failing on breakout attempts
-Pullbacks become shallow
-Names begin closing near highs instead of lows
-Weak sectors suddenly start holding moving averages
A new theme usually starts with:
-Better closes
-Better reactions
-Better continuation
before the headlines catch up...
For example $PLTR and $HOOD in the last few days.. starting to act much better and changing their characters.
5. Track News Narratives
Themes are often tied to macro narratives:
-AI spending
-Government backing
-Defense budgets
Follow themes, and stocks that have a REASON to go higher.
For example drone stocks last week, after the news that the government might take a stake...
Now this becomes top watch.
6. Focus on the Leader (Most important)
Every theme usually has:
-a leader
-secondary names
-laggards
The leader is where institutions concentrate first.
Your goal is to find the strongest theme, the strongest sector, and the strongest stock in that sector.
Characteristics of a leader:
-breaks out first
-has the best volume
-holds moving averages best
-reacts strongest after pullbacks
Most importantly... stack probabilities
Theme + Catalyst + Setup + Leading stock = super performance
I lost $60,000+ during my first 2 years in the Market trading 0DTEs & penny stocks.
Please don't be me.
This is exactly what I do now:
- +1 month out minimum on options
- Trade leaders +90% of the time
- Bottom fish maybe ~10%
- Relative strength first, setup second
- Keep losses small
- Weekly chart = thesis
- Daily chart = timing
- 15/30min = execution
- Focus on Stage 1 → Stage 2 transitions
- Compression → expansion
- Price, Volume + 9/21/50EMAs = simplicity
- Price first, volume provides context
- Buy strength off weakness
- Wait for buyers to prove they're there
- Keep losses small
- Average up, never down
- Let winners pay for losers
- Minimize my time on X
- Build conviction through homework
- Trade themes with institutional sponsorship
- no tightness = no trade
- Protect mental capital at all cost
- Break-even means break-even
- Focus on risk before reward
- Journal everything
- Keep losses small
Turns out making money became a lot easier once I simplified my core approach... and stopped trying to turn $500 into a Lamborghini once a week.
How to spot a stock’s “change of character” moment:
The answer is in the chart. 6 pizza slices:
1) the trend flips
- lower highs + lower lows...flips to...higher lows + higher highs
- the first HL is typically my signal
- look @ the annotated chart I attached
2) relative volume
- shows increased interest
- well above 200day RVOL baseline
- subtle, but clear volume pops at first
3) breaking of key levels
- price pushes though prior resistance
- prior resistance becomes support
- breakout holds
4) laggard to leader
- former laggard starting to lead
- relative strength improves
- feels like it's always green on red days
5) new reaction to pullbacks
- dips bought faster
- pullbacks become shallower
- can't break support
6) bad news is shrugged off
- negative headlines are still bought
- strong reactions to any news
- any selling = absorbed
It's all about behavior. Know when it changes.
Example below: $NBIS.
Feel free to bookmark + keep,
- Luc
I am trying to align myself with the strongest stocks in the strongest groups while they are already proving institutional demand through price.
1) I am not looking for cheap stocks.
2) I am not looking for broken charts.
3) I am not trying to be early in names that have shown me nothing.
I want strength that is already visible, then I wait for a controlled entry where I can define risk.
My process always starts with leadership.
Before I care about the setup, I ask myself: is this name actually leading? Is it outperforming the market? Is it outperforming its sector? Is it holding up on red days? Is it reclaiming moving averages quickly after pullbacks? If the answer is no, I usually lose interest fast.
Relative strength first.
Setup second.
After that, I look at the group. 1 strong stock is interesting, but multiple strong stocks in the same theme usually means institutional rotation. That is why I constantly track semis, AI infrastructure, power, defense, quantum, software, crypto, and any group where money is clearly flowing.
Then I look for structure.
Momentum alone is not enough for me... I need tightness & I need compression. I need a place where risk makes sense.
If a stock already made a strong move, I do not want to chase the emotional candle. I want to see it pause, digest, pull into the 9/21EMAs, build higher lows, absorb sellers, and start tightening again.
That is where the opportunity forms.
The move higher creates attention + the pullback shakes out weak hands. The tightness stores energy, and once price starts reclaiming pivots again, the next move higher can happen fast.
This is why so much of my trading revolves around:
> Stage 1 → Stage 2 transitions
> 9/21EMA pullbacks
> undercut/reclaim setups
> 15/30min pivot entries
> weekly breakout structures
> tight flags after expansion
> relative strength names on weakness
The actual entry is where I get aggressive.
If a leading stock pulls into support, undercuts a key level, then reclaims and starts turning back up on the 15/30min timeframe, that is one of my favorite entries. I can place my stop near LOD or the support pivot, know exactly where I am wrong, and participate right as momentum starts returning.
If I am wrong, I lose small.
If I am right, the stock should start working almost immediately.
Momentum trading is not buying random green candles.
It is finding true leadership, waiting for structure, entering where risk is tight, and then having the patience to let the winner work.
Most of my trades are small losses, breakeven trades, or small wins.
The outlier winners pay for everything.
Simple... but NOT easy.
$DELL is another name from this cycle that I genuinely think traders NEED to study in depth over the coming months, alongside names like $ARM.
This is exactly how I believe institutions position themselves before a stock fully transitions from “dead money” into true leadership:
If I were backtesting $DELL, the very first thing I’d study is the Stage 1 base itself.
$DELL spent over 750+ days building a massive base while most people were focused elsewhere. That’s an element I look at because the longer a stock spends absorbing supply, the more meaningful the move can become once demand finally overwhelms sellers.
Then, slowly… the character started to change, and that's the part I'm constantly watching for.
> Price stopped reacting bearishly to good news.
> Weekly closes tightened up.
> Volume started expanding on upside moves.
> Pullbacks became shallower.
> The stock started reclaiming the 9/21week.
Those are the subtle clues I constantly look for because that’s usually a sign institutions start accumulating shares over time.
“WHY do institutions suddenly care about this name again?”
For my personal selection criteria, narrative is top of the list...just think about $DELL now, from 10+ years ago. $DELL completely transformed from an “old hardware company” into a direct AI infrastructure beneficiary right in front of everyone’s eyes.
All of the sudden...
- AI server demand exploded
- backlog expanded toward ~$43B+
- hyperscalers needed infrastructure
- sovereign AI demand accelerated
- $NVDA partnerships strengthened
- liquid cooling + Blackwell systems became big catalysts
...and Dell Technologies World reinforced the entire AI server narrative.
That story is important to me because institutions NEED a reason to aggressively deploy capital.
And once the narrative + price + volume + positioning all start aligning together, that’s where I begin stacking layers of probability as aggressively as possible.
That’s really how I think through these names.
“Don’t just study that $DELL broke out. Study why the breakout mattered.”
Then break down...
- why the 750+ day base mattered
- why volume participation mattered
- why reclaiming MAs changed character
- why AI server backlog gave institutions a reason
- why headlines kept confirming price
- why pullbacks were bought instead of faded
- why this was Stage 1 → Stage 2 & not random strength
The biggest winners almost always leave footprints before they move.
And I want to intentionally study enough prior leaders that when the next $DELL shows up, my eyes immediately recognize the behavior.
That's my goal for infinite & beyond!
Chart: $DELL.