A lot of people have been asking for an update on this chart, so I’ll just leave this here for anyone who needs to see it.
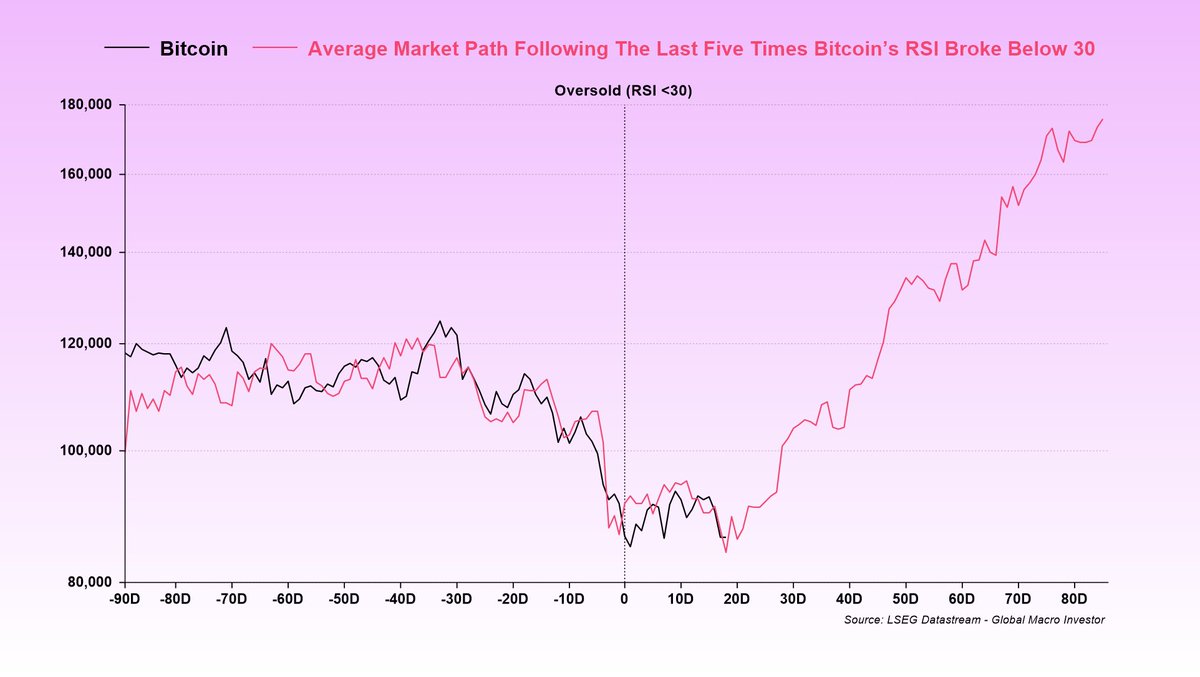
This shows the average BTC trajectory following an oversold RSI reading, with RSI falling below 30 at t=0.
So far, it’s been pretty bang on.
Unless you believe the 4-year cycle is still in play, which we don’t, this chart should hold up contextually over time.
No, it won’t be perfect, but assuming the bull market isn’t already over, it’s a useful chart to keep in mind.
As we’ve outlined many times, based on our work on the business cycle, the current path of financial conditions, and our expectations for overall liquidity, the balance of probabilities is that this cycle extends well into 2026.
In that world, the 4-year cycle is dead.
Remember, the 4-year cycle was never about the halving, despite widespread belief that it is, but instead has always been driven by the public debt refinancing cycle, as outlined in our work at GMI, which post-COVID was pushed out by one year.
In our view, the 4-year cycle is now officially broken because the weighted average maturity of the debt term structure has increased.
And the bigger picture is that there is still a vast amount of interest expense that needs to be monetized, which has far exceeded GDP growth.
Another thing to keep in mind is that bases can take time to form and usually come with plenty of chop before the bigger up-move kicks in.
Finally, let me repeat what I said when I first posted this chart last month.
If you think the bull market is over and we are now facing twelve months of pain, this chart is not for you. Move along...
These are all solid points.
Let’s take it one step further…
Think back to the 2016 to 2017 cycle.
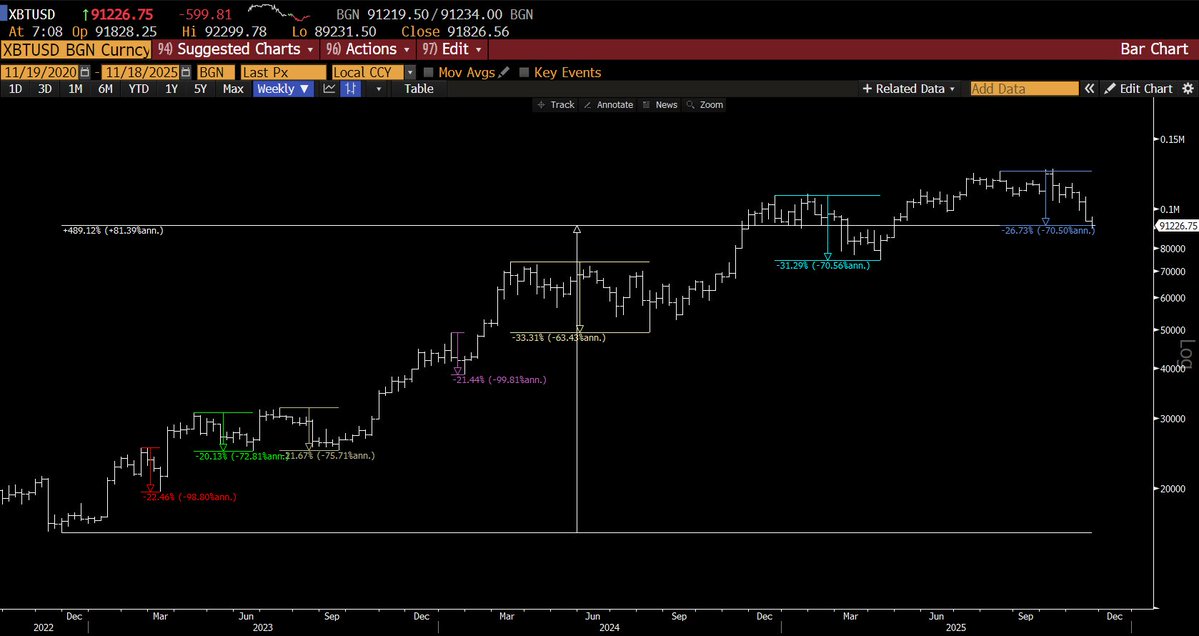
Bitcoin took a 20% hit, two 30% hits, one 35% hit, and three separate 40% flushes. It was relentless. Yet the market still delivered a 46x move.
The human mind conveniently forgets how awful those corrections felt because the final outcome rewrote the narrative.
Now look at this cycle...
We have had four 20% pullbacks and now three 30% pullbacks (chart 1).
Nothing about this is new. It only feels painful because you are inside the move right now. And if you are anchored on the idea that the cycle peaks this year, which is not our base case but is a view many people hold, it becomes very easy to convince yourself that you missed the bulk of the move, that it’s all over, and that the best of this cycle is already behind us.
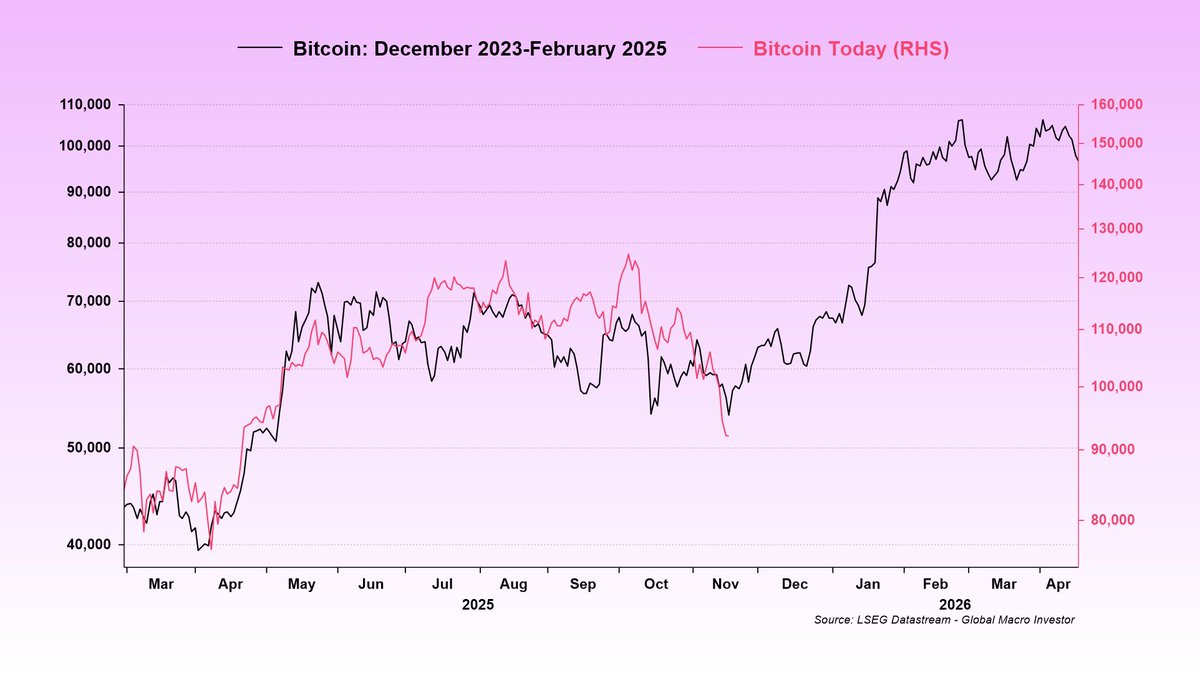
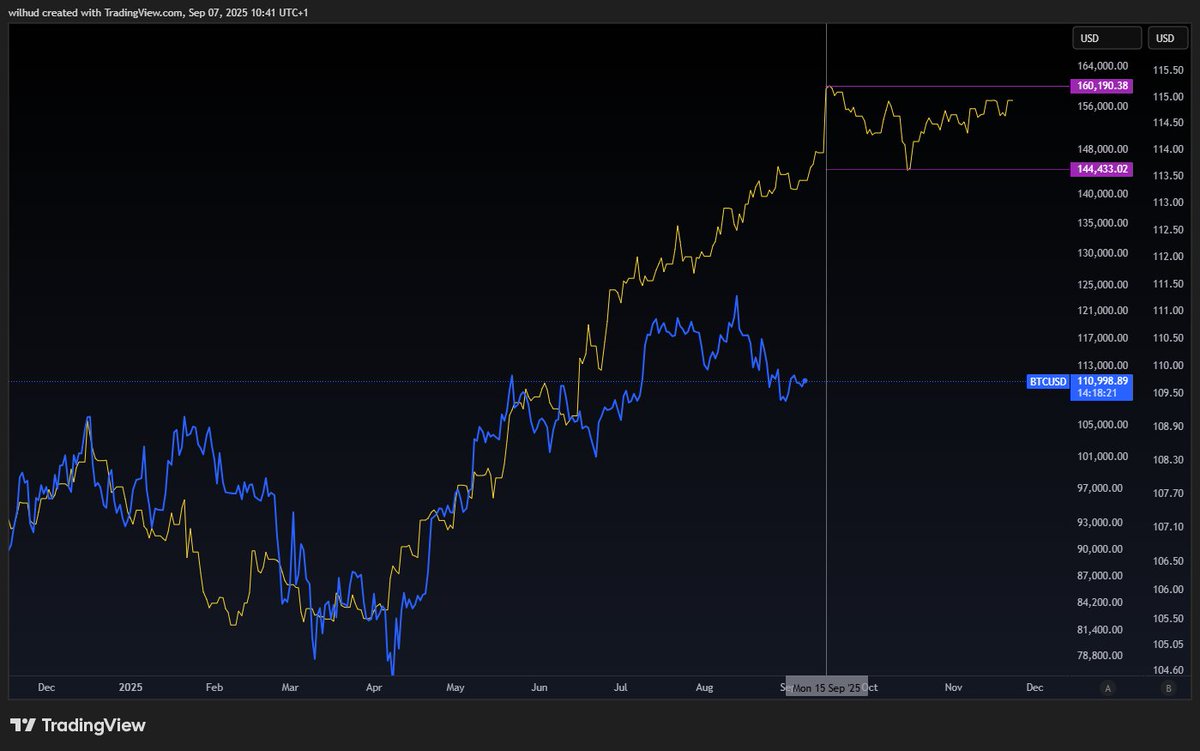
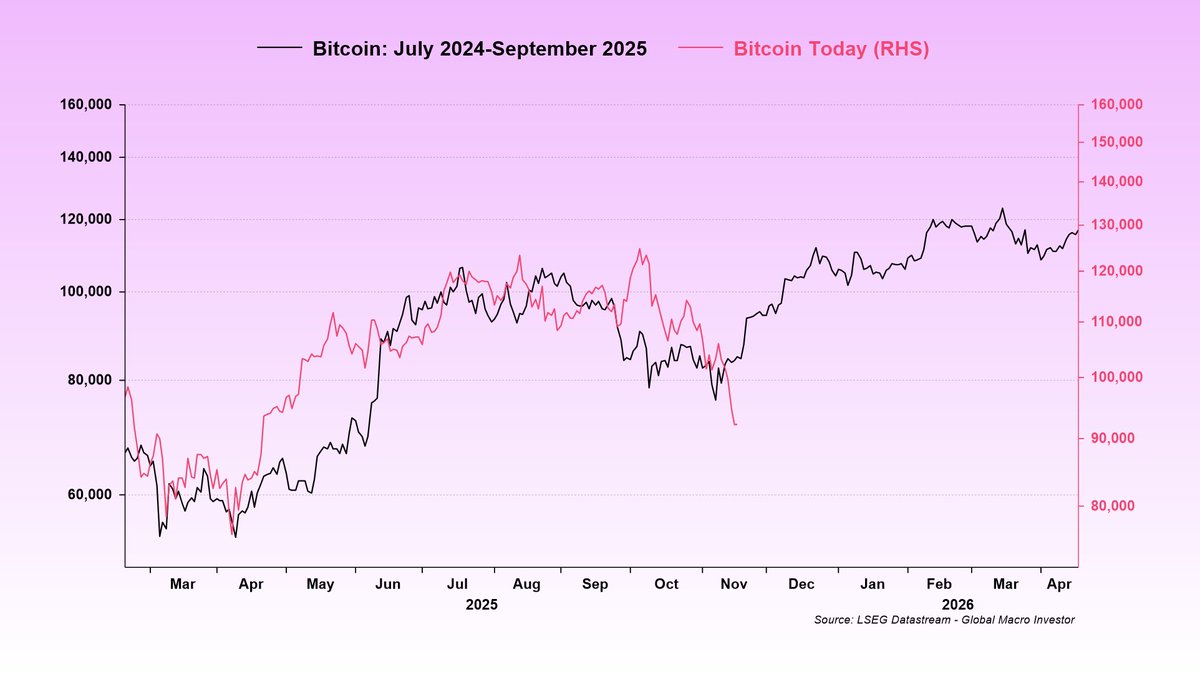
What really stands out is how similar these corrective structures have been over the past couple of years, as shown in charts 2 and 3…
The pattern, the size, the timing, they keep repeating. It is almost fractal. I have more examples of this as well.
When you compare both the magnitude of the pullback and the amount of time spent correcting, it suggests we are getting very close to the end of this move.
Now, to Raoul’s point, sentiment is indeed completely washed out…
Everyone is calling for the top. People are capitulating emotionally and not analytically. That is exactly the environment where bottoms tend to form. RSI is sitting at 28, and DeMark counts are close to flashing 9s and 13s almost across the board.
Nothing is guaranteed, but the probabilities are starting to lean heavily toward a bottom forming this week. Let’s see…
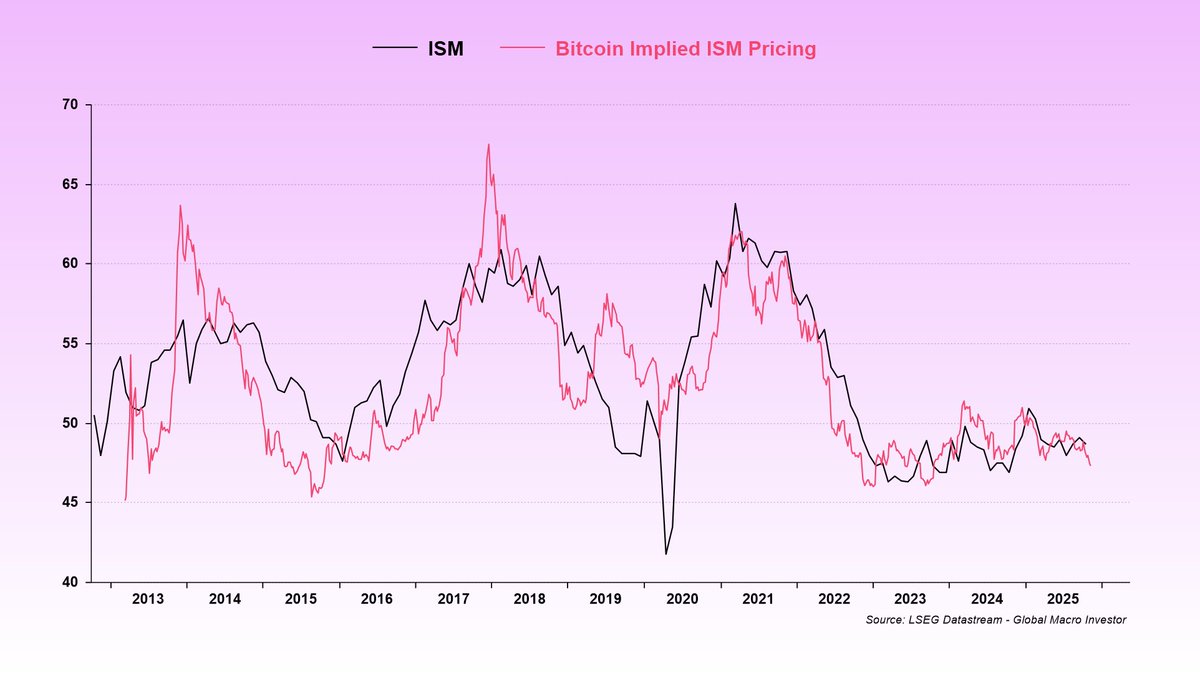
And remember, most people are overcomplicating the idea that Bitcoin’s traditional four-year cycle can extend. It’s simple. If the business cycle extends, the crypto cycle extends (chart 4).
Bitcoin is a macro asset…
Ok, let’s get one thing straight…
Delinquency rates on credit card loans (or otherwise) are not a leading indicator. The ISM is not a leading indicator. PMIs are not a leading indicator. Heavy truck sales are not a leading indicator. Job openings are not a leading indicator. Consumer confidence is not a leading indicator. Small business confidence is not a leading indicator. Durable goods orders are not a leading indicator. Capital goods orders are not a leading indicator. Jobless claims are not a leading indicator. Payrolls are not a leading indicator. The unemployment rate is not a leading indicator. Retail sales are not a leading indicator. Port traffic is not a leading indicator. Rail traffic is not a leading indicator. Freight volumes are not a leading indicator. Rig counts are not a leading indicator. Bank lending is not a leading indicator. The Conference Board LEI is not a leading indicator (I know, crazy, but no…).
All of these indicators are coincident at best, some even lagging. But not all coincident economic data is created equal. Some start flashing early when the cycle turns.
Our GMI US Coincident Business Cycle Index pulls together some of the more forward-looking elements within the coincident economic data, including early employment trends I’ve talked about before and a few other signals that tend to move first.
But more importantly, EVERYTHING is downstream to changes in financial conditions…
Here’s the backdrop:
Our lead indicators bottomed in June 2022, leading both the ISM and our coincident index by around nine months.
By March 2023, exactly nine months later, the ISM and our GMI index had also bottomed and started turning higher.
Lagging data, particularly the unemployment rate, continues to rise and that is what keeps the Fed engaged.
Most assume rising unemployment is always bearish for risk assets. But it depends entirely on the cycle’s context and where lead indicators are heading… and they’re rising.
What’s the bottom line?
The labor market is doing exactly what it needs to do to bring rates lower, which will eventually feed through to rate-sensitive areas of the economy like housing and manufacturing, driving the next leg of the business cycle higher.
It’s a recursive feedback loop.
Once you get The Everything Code Dominoes, the whole thing suddenly makes sense…
You see how it all fits together, and you understand the cycle phasing and variable leads and lags.
From there, it’s easy: focus on what really matters and ignore the noise…
#Ethereum 🔷 Weekly Chart
Despite the recent price action, #ETH is currently in the midst of creating a constructive trend, turning a multi-year resistance into new support.
We’re far closer to new ATHs than most realize.
$ETH 🔗https://t.co/STHe3eFcyO
Same thing happens all the time... the crypto market is focused on a big breakout, gets levered long ahead of it, it fails at first attempt so everyone gets liquidated... only then does the actual breakout occur, leaving everyone sidelined.
1/ $BTC M2 catch up loading...
Study Q4 Study 🍌
Study @RaoulGMI
Study rate cuts
Study gold break out
Study new Fed 3% mandate / regime shift @42Macro
Study 10yr yields
Study Q4 seasonality
Study Alt season (Alts -53% vs $ETH 2nd chart)
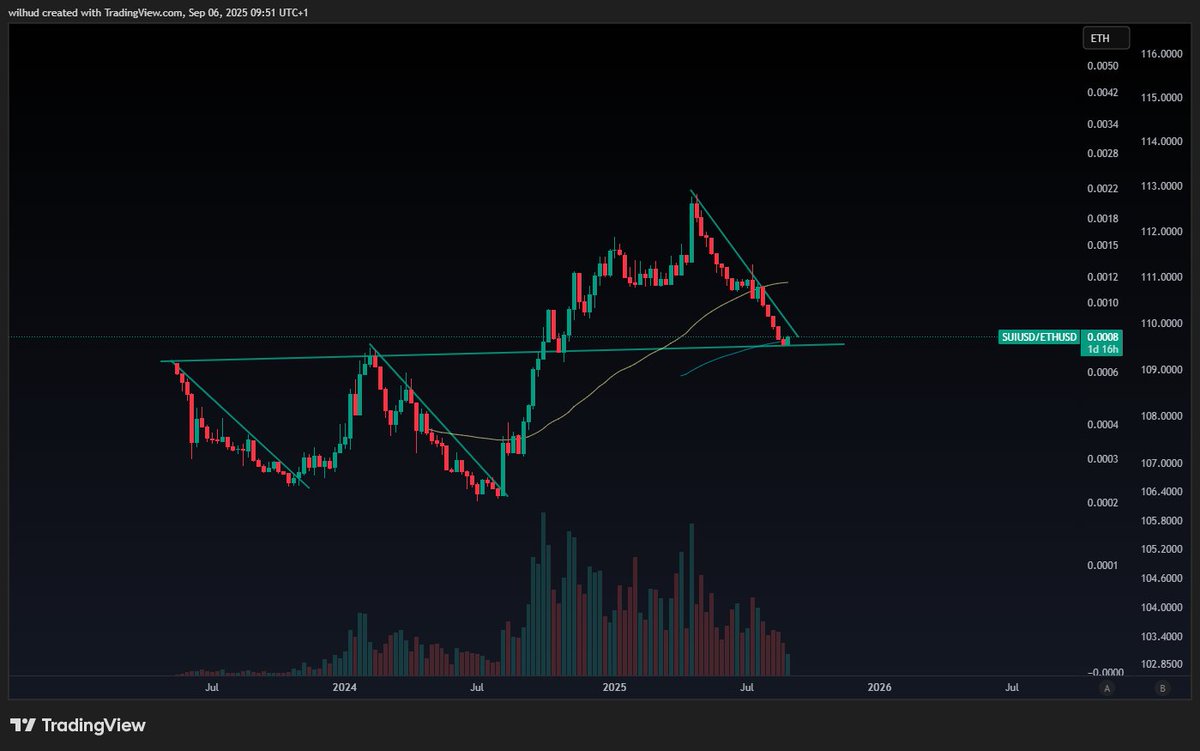
$SUI / $ETH looking v close here, especially when we consider $OTHERS / $ETH has just put in the most oversold weekly RSI in history. Alt season loading. 1/2
Instead of trying to guess which news event is “cycle top” worthy, what if you just watched the cycle?
Because the one that’s always mattered is at the bottom.