Microsoft - $MSFT weekly
$350 is the most important level on this chart.
It acted as resistance twice - 2021 and 2023. Then during the April 2025 tariff selloff, when everything broke down, $350 held as support. The level flipped.
Now price is testing it again.
Three touches. Same level. Years apart.
Current price: $350.
Two scenarios from here.
Scenario A - level holds. $350 acts as support again. $400 back on the table.
Scenario B - level breaks. Prior support becomes resistance. Downside target: $310.
Five years of history at this level.
Break or hold? 👀
@KobeissiLetter Interest payments are now the largest single cost of owning a home.
CPI at 4.2%. PPI at 6.5%. Rates aren’t coming down..
The math doesn’t work - and it’s not changing anytime soon.
$MSFT update.
Yesterday I posted $350 as the most important level on the weekly chart.
Low of the move: $349.20.
Four years of structure. Held within a dollar.
I don't believe in timing the market. But that level was hard to ignore.
Break or hold? 👀
Microsoft - $MSFT weekly
$350 is the most important level on this chart.
It acted as resistance twice - 2021 and 2023. Then during the April 2025 tariff selloff, when everything broke down, $350 held as support. The level flipped.
Now price is testing it again.
Three touches. Same level. Years apart.
Current price: $350.
Two scenarios from here.
Scenario A - level holds. $350 acts as support again. $400 back on the table.
Scenario B - level breaks. Prior support becomes resistance. Downside target: $310.
Five years of history at this level.
Break or hold? 👀
Chipotle ($CMG) is down ~60% from its all-time high.
There's an 18-year trendline that has caught every major crash this stock has ever had.
Every bounce from this line: ~2,000%. ~280%. ~700%.
Three times this held. Each time there was a reason.
Here's the full story. 🧵
Microsoft - $MSFT weekly
$350 is the most important level on this chart.
It acted as resistance twice - 2021 and 2023. Then during the April 2025 tariff selloff, when everything broke down, $350 held as support. The level flipped.
Now price is testing it again.
Three touches. Same level. Years apart.
Current price: $350.
Two scenarios from here.
Scenario A - level holds. $350 acts as support again. $400 back on the table.
Scenario B - level breaks. Prior support becomes resistance. Downside target: $310.
Five years of history at this level.
Break or hold? 👀
Apple - $AAPL daily.
One of the cleanest flag formations on the market right now.
Price sold off hard from $317. Then consolidated in a tight, orderly flag. Classic structure - sharp move, controlled pullback, coiling.
Two levels that matter.
$300 is the line. Price needs to reclaim and hold above it to keep the flag intact.
Below $295.50 - the flag breaks. When flags break, the move that follows tends to be sharp and quick. Downside target: $270-$275
Clean structure. Clear levels.
Break or hold? 👀
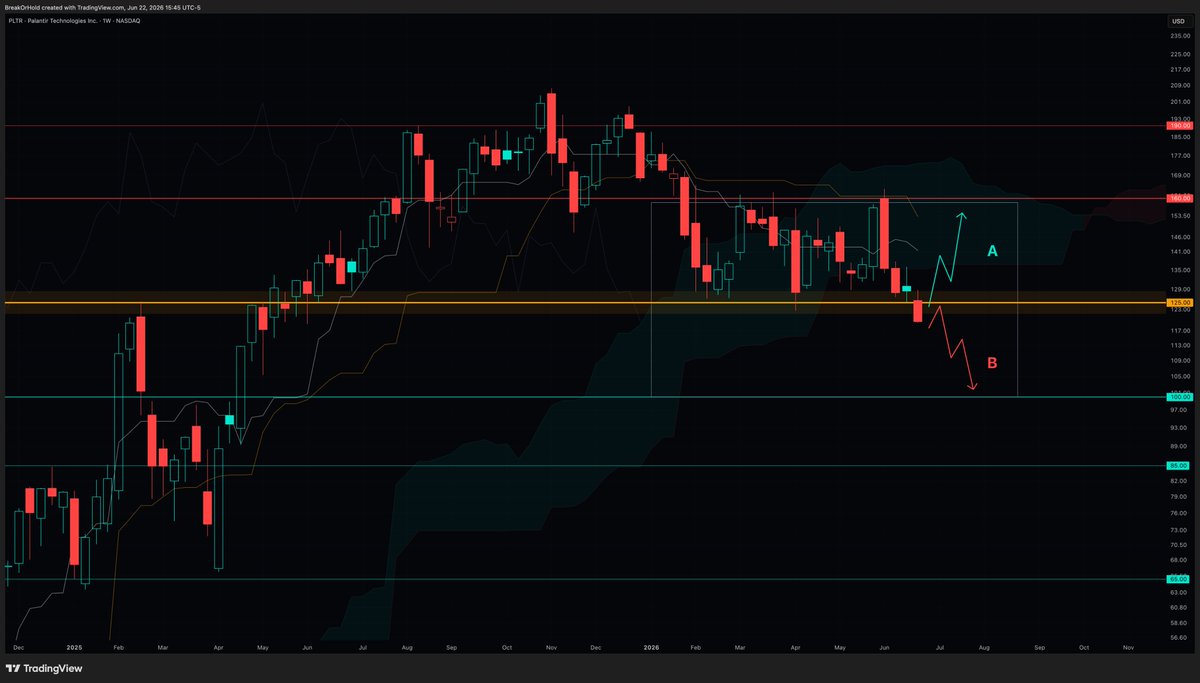
$PLTR weekly
Palantir broke a major level today.
All of 2026 - consolidation between $125 and $160. Nearly six months of range. $125 was the previous all-time high. That level held the entire time.
Until today. Daily close: $119.50
Price is now below the Ichimoku cloud on the weekly. Leading cloud is red. The structure has shifted.
Two scenarios from here -
Scenario A - fakeout. Price looked below $125, found nothing, reverses hard. $125 flips back to support. $160 back on the table.
Scenario B - true breakdown. $125 becomes major resistance. The entire consolidation range becomes a ceiling. Downside target: $100
Six months of range. One daily close below it.
Confirmed or fakeout - that's the question.
Break or hold? 👀
Apple - $AAPL daily.
One of the cleanest flag formations on the market right now.
Price sold off hard from $317. Then consolidated in a tight, orderly flag. Classic structure - sharp move, controlled pullback, coiling.
Two levels that matter.
$300 is the line. Price needs to reclaim and hold above it to keep the flag intact.
Below $295.50 - the flag breaks. When flags break, the move that follows tends to be sharp and quick. Downside target: $270-$275
Clean structure. Clear levels.
Break or hold? 👀