S&P 500 – Market Perspective
Markets may be transitioning from expectation to reality.
Monthly & weekly momentum turning.
Structure weakening.
#SPX#SP500#TechnicalAnalysis
Markets continue pushing higher, but historically low yields and stretched valuations suggest risk may be building beneath the surface.
A few thoughts below 👇
#SPX#SP500#NASDAQ#TechnicalAnalysis
@sasaigeyooooo Agreed.
Strong businesses ultimately matter most.
I’m just mindful that price can move well ahead of value for periods of time, which is where momentum & timeframe analysis help.
I always consider the weekly & daily timeframes together.
Weekly = directional bias
Daily = condition & timing
The weekly MACD turning up often signals the bigger move developing.
The daily helps assess strength, extension or deterioration.
Context matters.
#SPX#SP500
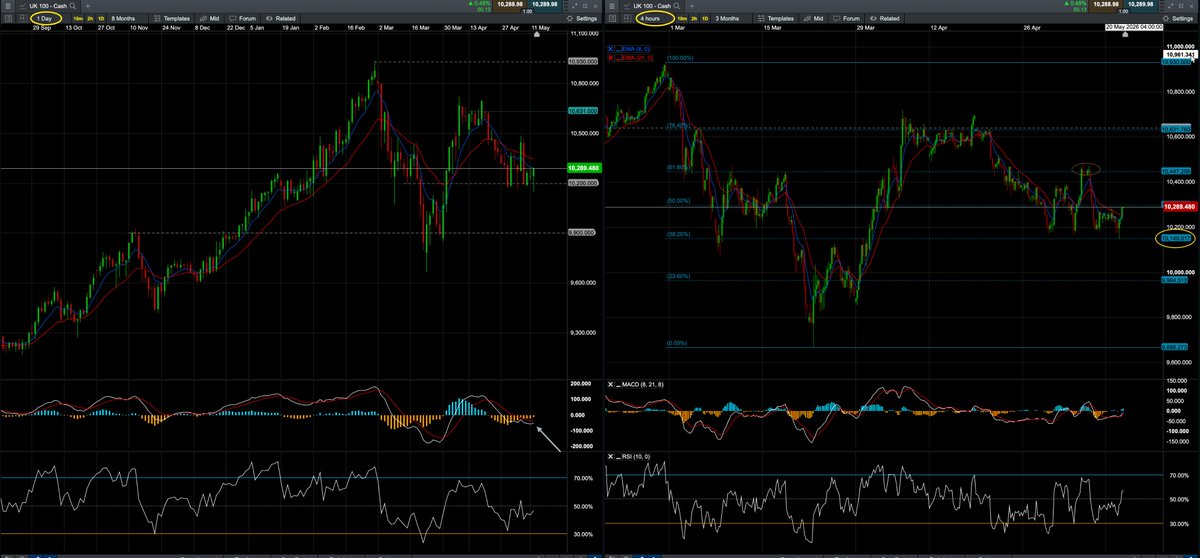
FTSE 100 (UK100)
Similar structure to SPX 5 days ago now playing out.
Daily momentum rolled over (MACD).
4H failing below prior resistance fib 76.4, 10,631.
#FTSE#UK100#TechnicalAnalysis
Markets pushing higher…
Nasdaq +41.9%
S&P +30.5%
FTSE +23.4%
Strong performance.
But the Bank of England warns markets may not reflect underlying risk.
Strength doesn’t remove risk—
it often hides it.
https://t.co/vKE8F3jkJW
FTSE 100 (UK100)
10,640 remains key.
If US opens bullish, could see a push through resistance and continuation higher.
Shorts need to be cautious here.
#FTSE#UK100#TechnicalAnalysis
FTSE 100 (UK100)
10m showing repeated tests of 10,640 resistance.
Now watch (1m):
→ EMA (8/21) cross down → short trigger
→ Stop above 10,640
Level tested multiple times — looking for rejection.
#FTSE#UK100#TechnicalAnalysis
@steve_sholli Hi Steve. Good question.
I don’t try to pick the top, I manage the move.
If 4H momentum starts to fade,
my main exit is the 8/21 EMA cross in the opposite direction. Factor in the daily —if coming off a strong low, momentum can carry, I’m more patient, let 4H cross confirm.
FTSE 100 (UK100)
Higher TF bearish, short-term bounce in play.
Daily MACD turning up from oversold → counter-trend strength.
Next resistance 10,447 (61.8%)
Then watch:
Break & hold above → 10,631 (76.4%)
#FTSE#UK100#TechnicalAnalysis
@steve_sholli Thanks Steve, really appreciate that. The videos were great to make but very time intensive, so I’m focusing more on written analysis for now. Glad you’re finding value in it.
S&P 500 – Market Perspective
Markets may be transitioning from expectation to reality.
Monthly & weekly momentum turning.
Structure weakening.
#SPX#SP500#TechnicalAnalysis
S&P 500 update.
Since my last post, Feb 12 (6844) momentum has continued to weaken. Price now ~6650 and 6800 support has failed.
Monthly MACD turning down, weekly momentum deteriorating.
Bounce → watch 6800–6900 for possible lower high.
#SPX#SP500#TechnicalAnalysis
Technical note:
Repeated tests of major support often absorb liquidity over time.
24K has now been tested several times on the NASDAQ — something worth keeping in mind.
#NASDAQ#TechnicalAnalysis